科技創新與韓國公司營運成效間之關聯 - 政大學術集成
70
0
0
全文
(2) 科技創新與韓國公司營運成效間之關聯 Correlation between Technological Innovation and Performance of Korean Firms. 研究生:玉昌訓. Student: Charles Ok. 指導教授:吳文傑. Advisor: Jack Wu. 立. 政 治 大. ‧ 國. 學. 國立政治大學. 商學院國際經營管理英語碩士學位學程. y. sit. Nat. A Thesis. ‧. 碩士論文. er. io. Submitted to International MBA Program. n. al National Chengchi University iv. n U in partial fulfillment e n gofcthe h iRequirements. Ch. for the degree of Master in Business Administration. 中華民國一○一年五月 May 2012.
(3) Acknowledgements The completion of this thesis was possible with the encouragement and help from many people. First of all, I would appreciate to my thesis advisor, professor Jack Wu who guided and advised me with his passion and respectful insight with many ideas to build up the structure of this thesis.. 政 治 大 Ms. Lichi Ho who has kept me remind me to stay as learner and student. 立. I would like to express my sincere gratitude to the member of IMBA office, specially to. ‧ 國. 學. I should thank to my IMBA study group – named OK family – Cathy ,Dennis, Joyce, Misha and Betty, who shared their warmth.. ‧. n. er. io. sit. y. Nat. al. Ch. engchi. I. i n U. v.
(4) Abstract. Correlation between Technological Innovation and Performance of Korean Firms. By. 立. 治Ok 政Charles 大. ‧ 國. 學. Globalization provides all business players with equal threats as well as equal opportunities at the same time. Information can be obtained with low cost through wire,. ‧. wireless technology, learning by themselves and partnership of strategic alliance. High. y. Nat. sit. technology and special know-how may take more time to be built than buy. Now the global. n. al. er. io. market is open and flat. Competition which normally erodes profit of firms is taken for. i n U. v. granted and can’t be avoided. Joseph A. Schumpeter believed that entrepreneurs would do. Ch. engchi. “creative destruction” to avoid from stationary state of economy and to seek new profit opportunities, and he considered the concept of innovation to be new products, new method of productions, new markets and environment which can change rules of the game of business players. Many Korean firms have jumped into international competitive markets to expand their presences to pursue both profit and growth. Creating competitive advantages by low cost or differentiation of strategy and products in the competitive business environment are very important factors. Innovation is one of the competitive advantages. Innovation may be categorized into three parts; technology, manufacturing process, strategy and marketing. Here in the thesis, I take technology as vehicle of comparison, and use the number of granted II.
(5) patents as the degree of technological innovation. This thesis will make comparison among the firms which have more number of patents and less number of patents to see if technological innovation contributes better financial performances. Patents are used as barrier against new entrants and defending vehicle in the time of patents conflict with market competitors. This thesis will analyze and verify whether the more a firm is innovative in technology, the better financial performance it may enjoy in the severe competitive environment.. 立. 政 治 大. ‧. ‧ 國. 學. n. er. io. sit. y. Nat. al. Ch. engchi. III. i n U. v.
(6) TABLE OF CONTENTS Chapter 1 ...............................................................................................1 1.1 Introduction ................................................................................................... 1. Chapter 2 ...........................................................................................12 2.1 Literature review R&D, innovation, patents and company performance ........................................................... 12. 治. 政 Chapter 3 ...........................................................................................21 大. 立. Financial analysis of correlation between technological innovation and performance of. ‧ 國. 學. Korean firms. 3.1 Technological innovation ............................................................................ 21. ‧. 3.1.1 Granted patent data ........................................................................................... 21. sit. y. Nat. 3.2 Hypothesis ................................................................................................... 23 3.3 Methodology ............................................................................................... 24. al. er. io. 3.3.1 Past Financial Performance .............................................................................. 24. n. 3.3.1.1 Correlation between patents and sales growth ................................... 25. Ch. i n U. v. 3.3.1.2 Correlation between patents and gross profit..................................... 26. engchi. 3.3.1.3 Correlation between patents and ROE ............................................... 28 3.3.2 Comparative Financial Performance ................................................................ 29 3.3.2.1 Profitability ........................................................................................ 29 3.3.2.2 Stability .............................................................................................. 38 3.3.2.3 Liquidity............................................................................................. 42 3.3.2.4 Efficiency Ratio ................................................................................. 44 3.3.2.5 R&D expense and gross profit ......................................................... 50 3.3.3 Comparison between Korea GDP growth and sales growth ............................ 54 3.3.3.1 Korea GDP and sales growth 2005-2006 ........................................... 54 3.3.3.2 Korea GDP and sales growth 2006-2007 ........................................... 56 3.3.3.3 Korea GDP and sales growth 2007-2008 ........................................... 57. IV.
(7) 3.4 Challenges of correlation between Technological Innovation and Performance ....................................................................................................... 59. Chapter 4 ...........................................................................................60 4.1 Patent as a tool of competitive advantage ..................................................... 60. Chapter 5 ...........................................................................................61 5.1 Results ........................................................................................................... 61. Chapter 6 ...........................................................................................64. 政 治 大. 6.1 Conclusion ................................................................................................... 64. 立 References .........................................................................................67 ‧. ‧ 國. 學. n. er. io. sit. y. Nat. al. Ch. engchi. V. i n U. v.
(8) List of Tables Table 3-1 Distribution of industries by patent (2005 – 2008) ................................................ 22 Table 3-2 Comparison of profit ratio between largest number patents firm and the rest ......... 32 Table 3-3 Comparison of ROE between largest number patents firm and the rest ................ 35 Table 3-4 Comparison of ROA between largest number patents firm and the rest ................ 37. 立. 政 治 大. ‧. ‧ 國. 學. n. er. io. sit. y. Nat. al. Ch. engchi. VI. i n U. v.
(9) List of Figures Figure 2-1. Identification of patenting strategies in a patent portfolio on the firm level ......... 18 Figure 3-1 Correlation between patents and sales growth ...................................................... 25 Figure 3-2 Correlation between patents and gross profit ....................................................... 26 Figure 3-3 Correlation between patents and ROE .................................................................. 28 Figure 3-4 Average number of patents per firm by industry .................................................. 30 Figure 3-5 Average profit ratio per firm by industry .............................................................. 31. 政 治 大. Figure 3-6 Average ROE per firm by industry ....................................................................... 34 Figure 3-7 Average ROA per firm by industry ....................................................................... 36. 立. Figure 3-8 Average debt ratio per firm in order from highest ratio to lowest ........................ 39. ‧ 國. 學. Figure 3-9 Patent total (2005 – 2008) per company ............................................................... 40 Figure 3-10 Average debt to asset ratio per firm in order of patents number ......................... 41. ‧. Figure 3-11 Average current ratio (industry) .......................................................................... 43 Figure 3-12 Average current ratio per firm in order from largest number of patent to lowest 44. Nat. sit. y. Figure 3-13 Average asset turnover (industry) ....................................................................... 46. io. er. Figure 3-14 Average asset turnover ratio per firm in order from largest number of patent to lowest ................................................................................................................ 47. n. al. i n U. v. Figure 3-15 Change of gross profit and change of sales (2005 to 2008) ............................... 49. Ch. engchi. Figure 3-16 Industry comparison for R&D/sales and gross profit ......................................... 51 Figure 3-17 Comparison of R&D/Sales and gross profit per firm by industry ...................... 53 Figure 3-18 Korea GDP and sales growth, 2005 – 2006 ........................................................ 55 Figure 3-19 Korea GDP and sales growth, 2006 – 2007 ........................................................ 56 Figure 3-20 Korea GDP and sales growth, 2007 – 2008 ........................................................ 58. VII.
(10) Chapter 1. 1.1 Introduction. Performance of a company can be affected by two factors. The one is internal factor comprising its capabilities and resources, and the other is external factor comprising micro. 政 治 大 external factors are not. Good 立performance of a company may begin with good analysis about and macro economies. Capabilities and resources are controllable by organization, while. ‧ 國. 學. its capabilities based on its resources as well as external factors. Then a company can set up its strategy and implementation plan to achieve its targets based on its analysis results. Its. ‧. Nat. io. sit. response, then determine optimum one among good strategies.. y. strategy should be simulated against competitors’ actions and reactions and customers. n. al. er. Analysis for external factors may include industry’s dominant economic features and. Ch. i n U. v. competitive forces, driving forces to change industry and their impacts, rivals’ strategies. engchi. based on their strength and weakness, competitive success factors, attractiveness of the industry which a company presents. Optimum strategy can be drawn, firstly, to identify company resource strength and competitive capabilities which may take several forms such as high yield and low cost operation system, advanced equipment and factories, human assets, intellectual capital, key patents, intangible assets, good strategic alliances. No company can have only absolute strength in all aspects in modern competitive markets, they may have competitiveness in some factors and weakness in others relatively comparing with competitors. Monopoly is exception. Companies are doing their production or. -8-.
(11) service activities in uncertain environments with their strength and weaknesses. Uncertain environment may bring more critical affects to companies rather than internal factors, because wave of industry, national, international economy are uncontrollable. The factors such as economies of scale, time to market, advanced technology, low cost production method have brought good financial performance to companies, but the companies with these strength are still to be affected to their outstanding performances by unexpected. 政 治 大 external environments and bring higher performance with their limited resources. In the 立 change of market and economy. How companies can be less affected by unexpected change of. severe competitive markets, firms consistently should bring new ideas and innovation to their. ‧ 國. 學. products and process. Product innovation is stimulated by technological competition,. ‧. downward and horizontal knowledge sourcing, diversification, laboratory research, innovation. sit. y. Nat. experience and high capital intensity. Innovation output refers to the results of innovation. io. er. process. Innovation is often measured by the percentage of sales from new products. Alternative measures are patents. The innovation output is influenced by the innovative inputs. n. al. and innovation process.. Ch. engchi. i n U. v. Patents may be the vehicle to be able to carry companies cross against slow growth of national and international economy, and protect themselves from competitors’ patents which may impede their production and service activities to create good performances. Patents also can create monopoly supply. In present markets we can easily find monopoly or oligopoly supply by patents. Microsoft’s Window, Fuji’s optical film ( Wide view angle film), 3M’s prism sheet (Double Brightness Enhancement Film), Qualcomm’s CDMA (Code Division Multiple Access), Intel, AMD and Samsung (Nand Flash and SSD), Apple and Google (OS).. -9-.
(12) Established high technology companies typically spend at least 5 percent of sales on technology and innovation-related activities, start-up companies may spend significantly more. Technology is a resource of paramount importance to many organizations. Managing this resource for competitive advantage entails integrating it with the firm’s strategy in order to be able to access the firm’s innovative capabilities and identify how they may be leveraged or improved.. 政 治 大 The criteria for success regarding inventions and discoveries are technical rather than 立. At the origin of the technological innovation process are inventions and discoveries.. commercial. Though patents by inventions and discoveries sometimes allow their originators. ‧ 國. 學. to establish a potential for economic rents with subsequent innovations, but there may be a. ‧. significant time lag between doing scientific research and using the inventions and discoveries. sit. y. Nat. to create successful innovations. A successful innovation is one that returns the original. io. er. investment in its development plus some additional returns which enjoy a sufficiently large market for the innovation to be developed. Innovations are the outcome of the innovation. al. n. v i n process, which can be defined asC the combined activities leading to new, marketable products hengchi U. and services. Innovation by business is achieved in many ways, with much attention now given to research and development for breakthrough inventions. Research and development spur on patents and other scientific innovations that lead to productive growth in such areas as IT, medicine, engineering and government. The more radical and revolutionary innovations tend to emerge from research and development, while more incremental innovations may emerge from practice. But there are many exceptions to each of these trends. Patents facilitate and encourage disclosure of technological innovation into the public domain for the common goods. Technological innovation with patent may drive firms to. - 10 -.
(13) achieve their goals mostly in dealing with new products development. Patent provides the right to exclude others from making, using, selling which is usually 20 years from filing date. Registered patents for the idea, product, technology, the company can enjoy 20 years of advantage in the markets, which bring a successful launch of the product with reasonable profit to the company. Some patent can change the position of the company from follower to leader, deficit recorded to profit creator, low profile brand to high reputation identity,. and so on. New products from technological innovation eventually can replace older and continue to. 政 治 大. drive growth upwards. Some patents may not bring the good returns in short time due to the. 立. investment in R&D, or production yield not enough high.. 學. ‧ 國. underperformance of the technology, less market acceptance, low return against high. ‧. From reviewing literatures about company performance, some literatures pointed that. sit. y. Nat. company size is more important rather than technological innovation for financial. io. er. performance. In consideration of this finding and the industry culture of Korea that has some numbers of conglomerates such as Samsung, LG and very large size companies,. al. n. v i n large C size firms whose capital is over hengchi U. conglomerates and very. U$500 millions are not. included in this analysis. By excluding the conglomerate and very large size companies, it may help to depict the relationship between technological innovation and financial performance among firms in similar or same industry. The 106 companies in the data of this thesis have a significant number of granted patents and strong financial structure in their industry. The analysis is proceeded for the period of 4 years from 2005 to 2008 upon their financial performance and granted patents. 106 firms consist of 2 utility suppliers, 2 fertilizer manufacturers, 3 auto parts manufacturers, 3 electrical companies, 6 electronic firms, 6 metal manufacturers, 10 iron and. - 11 -.
(14) steel works, 15 chemical makers, 16 food and beverage manufacturers, 24 pharmaceutical companies. During the period of 2007 and 2008, Korea economy as well as global economy has been slow down, while Korean enjoyed good economy growth in 2005 and 2006 in the circumstance of good export market and slow domestic market. This paper compared Korea GNP growth against the sales growth of 106 firms to see if technological innovation can still. 政 治 大. contribute to company growth to exceed GNP growth rate even in the hardship of macroeconomy environment.. 立. ‧ 國. 學 ‧. Chapter 2. sit. y. Nat. n. al. i n U. R&D, innovation, patents and company performance. Ch. engchi. er. io. 2.1 Literature Review. v. Hans Loof and Almas Heshmati (On the relationship between innovation and performance : A sensitive analysis, December 2002) showed a positive relationship of innovation and sales per employee (elasticity) on five different performance measurements (value added per employee, sales per employee, operating profit per employee, employment growth, return on assets). The sales margin is not significantly influenced by innovative output. In a comparison of manufacturing firms and service firms, there is striking homogeneity between innovation and productivity whose similarity was observed in both level and growth rate dimensions. Their conclusion supported the view that services and. - 12 -.
(15) goods are not much different. A consideration of different performance measures show that sales is a less appropriate proxy for value added when the relationship between innovation and performance is analyzed. Employment increases with innovation output only for services while no strong correlation can be established between innovation intensity and growth in profit for neither categories of firm. They found a closer relationship between innovation output and the level of value added. 政 治 大 firms is compared to cases where innovations are new to the market. There is a close 立 per employee, the level of sales per employee and sales margin for innovations new to the. association between the level of profit and innovation for services as well as for. ‧ 國. 學. manufacturing firms.. ‧. Alfred Kleinknecht analyzed the strength and weaknesses of traditional five alternative. Nat. sit. y. innovation indicators in The Non Trivial Choice between Innovation Indicators in Economy,. n. al. er. io. Innovation and New Technology published in 2002. Among the five indicators : R&D, patent. i n U. v. applications, total innovation expenditures, share in sales taken by imitative products, share in. Ch. sales taken by innovative products,. i application showed more and severe eR&D n gandc hpatent. weakness than is usually assumed. Also his factors analysis suggested that there was little correlation between the various indicators. Other characters of R&D are; firstly R&D is an input of innovation process and input can be used more or less efficiently. In principle, R&D says nothing about output side of innovation process. Secondly R&D is only one out of several inputs including product design, trial production, market survey, employee training and investment in fixed assets. He stressed that patent indicator missed many non-patented inventions and innovations. Some types of. - 13 -.
(16) technology are not patentable. On the other hand, what is share of patents that in never translated into commercially viable products and process?. Can this share be assumed across. the branches and firm size classes ? Patent figures can be obscures by strategic behaviors. A firm may not commercialize the patent but use it to prevent that a competitor can patent and use it. His research suggested that R&D and patenting have more shortcomings than in often. 政 治 大 from this that it would not be much difference, which indicator one happened to use. However, 立 thought. Direct measures of innovative output are to be preferred. One could have concluded. the apparent correlation between the indicators turned out to be mainly caused by one. ‧ 國. 學. common factor: firm size. Once firm size is normalized, the correlation disappears. Each of. sit. y. Nat. various sources of bias, depending on what is being investigated.. ‧. the five relative indicators examined showed him a different story. Several indicators have. n. al. er. io. The share in sales of innovative products in total sales is not strongly related in size.. i n U. v. Smaller firms have a lower probability to innovate, but once they innovate, that share in sales. Ch. engchi. is not lower than in large firms. Demand enhances innovation and innovation enhances demand, but the evidence is still inconclusive on the relative strength of causation in either direction. There seems to be a difference between determinants of products and process innovation. Luuk Klomp and George Van Leeuwen explained the innovation intensity and comparison between innovative and non-innovative firms, in Netherlands Official Statistics, 1999 in their writing the Importance of innovation for company performance. They described the flow from input into innovation to innovation sales, company performance and sales. - 14 -.
(17) growth. They compared the growth rate for total sales and employment between innovative and non-innovative firms. Although the importance of innovation for economic activity is often widely acknowledged, this does not imply that by definition non-innovative companies perform worse than their innovative firms. One can’t even exclude the possibility that noninnovative companies perform better on average. It is expected that technological innovation will not be able to explain all observable heterogeneity. A significantly positive effect of the level of innovation output on sales growth was observed, but this is not the case for. 政 治 大. employment growth, and confirmed in the significantly positive feedback effect from. 立. company level sales growth to the level of innovation intensity. They showed the relationship. ‧ 國. 學. between innovation and company performance. They explained the innovation intensity by several variables,. total sales, cash flow, technological opportunities, R&D on a permanent. ‧. base, innovation push and/or pull factors.. Innovation intensity can be seen as the effect a. y. Nat. sit. firm puts in innovation. It is often measured by the R&D expenditures divided by the total. n. al. er. io. sales, or the number of employees dedicated to the innovation. The innovation intensity is. i n U. v. influenced by the firm size, export intensity and prior sales level or the education of. Ch. engchi. employees, external supports and innovation process characteristics. Edward M. Bergman analyzed the innovation and R&D of Dutch construction cluster. While innovation may not be second nature to construction firms, the manufacturing and service firms within the construction cluster outperform all other firms in terms of innovativeness and R&D activity. Innovation is not performed for its own sake. Its goal is better corporate performance. Although the relationship between innovation and corporate performance is a complex one, innovation is important. The innovation in the construction cluster showed considerable importance for improving sales. Most innovations are still of the. - 15 -.
(18) technology-push type and less of the market-pull type. Well-developed order portfolios provide no incentive to move forwards with innovative constructions and experiment, while low margins imply that little finance is available for investing in R&D and innovation. John Hagedoorn and Myriam Cloodt (2003) found the relationship regarding different indicators of innovative performance in their research of Measuring Innovative Performance: Is there an advantage in using multiple indicators? First, their research suggested that there. 政 治 大 new product announcements. A systematic disparity was found for neither the sample as a 立 was no major systematic disparity amongst R&D input, patent counts, patent citations and. whole, nor for individual sectors, or when taking the international distribution into account.. ‧ 國. 學. Second, the latent variable innovative performance measures the overall, broad interpretation. ‧. of innovative performance of companies in terms of their research input, the size of their. sit. y. Nat. inventive activities, the quality of their inventive output and their level of new product. io. er. introduction. Third, a single indicator approach is invalid for a certain industry sector, a composite construct that overarches all stages of the innovation process could be used for the. al. n. v i n measurement of innovative performance C h of companiesUin particular sectors. They suggested engchi that there were inter-sectoral differences between the ratios of the different indicators. In that sense, there are differences with regard to the degree to which, for instance particular levels of R&D lead to patents and new products. Peter Neuhausler explained in the paper of Patents and the financial performance of firms that innovative capability is the ability to successfully complete innovative processes, i.e. implement respectively commercialize new or improved products, services and technologies, where the major innovation incentive increases future profit prospects. The successful completion of the innovation process alone, however, is not a sufficient condition. - 16 -.
(19) to obtain the expected benefits from innovation. A firm has also to be able to appropriate these benefits, implying that it prevents its competitors from imitation. Thus, effectively protecting innovations requires firms to set up effective protection mechanisms, where formal intellectual property rights, in particular patents, are among the most important instruments. The results of R&D and the protection of outputs can influence the market value of a firm. To approximate the protected outputs and the technology base of a firm, the patent application can be used. Patents are one of the most important innovation indicators to assess. 政 治 大. technological competitiveness on the micro and the macro level as they are among the most. 立. important visible artifacts of R&D processes. To sum up the results of the various models, the. ‧ 國. 學. mere number of patent applications does not seem to be a very good predictor of firm performance, although a significantly positive but small effect can be found on Return on. ‧. Investment.. sit. y. Nat. io. er. Holger Ernst in his writing of Patent portfolios for strategic R&D planning found that patent can support technology management in all five areas (internal, external, technology. al. n. v i n creation, technology storage, technology framework. The use of patents C h use) of the conceptual engchi U in technology management can be classified according to the two major functions of patents.. First, a granted patent protects the inventors, at least for a period of time, from imitation. Thus, patent protection supports the internal use of technology. Effective patent protection has been identified as an important source of competitive advantage. Patented technology can be used externally to achieve important operational (e.g. by patent sale) and strategic (e.g. access to technology by cross-licensing or R&D alliances) benefits. Second, patents contain important information for technology management. The value of patent information can be attributed to a variety of reasons: patent data are available even for companies that are not required to. - 17 -.
(20) report R&D data. They can be allocated to sub-fields of interests, i.e. business units, products, technological fields, or inventors; this enables a more precise competitor analysis. He found that company performance as measured by sales growth and sales per employee increased with patents quality and the combination of patent quality and patent activity, which they called patent performance. His empirical analysis suggested a positive relationship between patenting strategies and company performance.. 政 治 大. Figure 2-1. Identification of patenting strategies in a patent portfolio on the firm level. 立. ‧. ‧ 國. 學. n. er. io. sit. y. Nat. al. Ch. engchi. i n U. v. Nicholas Bloom and John Van Reenan analyzed intellectual property and firm performance in their study of Patents, Real Option and Firm Performance (The economic Journal, March 2002) that patents are potentially powerful indicator of technological innovation. They showed that patents have had an economically and statistically significant impact on firm level productivity and market value. They found that patents citations are more. - 18 -.
(21) informative than the simple patent counts that have been used previously in the literature, and while patenting feeds into market values immediately it appears to have a slower effect on productivity, and higher market uncertainty reduced the impact of new patents on productivity. One potential explanation is that the new products and processes which are covered by the patents have to be embodied in new capital equipment and training. Firms may also need to undertake further research and development, as well as expensive marketing and advertising to promote their new products. As such, this will involve extensive sunk cost investments –. 政 治 大. these capital, training, research and marketing outlays will be irreversible. They used the. 立. concept of two different knowledges : embodied knowledge which is products and processes,. ‧ 國. 學. and disembodied knowledge representing the remaining idea which the firm has under patent but has not yet committed into actual production. With these two concepts, they valued the. ‧. company in terms of profit, sales, market value of the company, growth. Patent citations are. y. Nat. sit. potentially useful source of information in tracking the flows of knowledge across industries. n. al. er. io. and countries and they intended to use the citations data in combination with R&D to. i n U. v. investigate investment amount. If more uncertain environments reduce the productivity. Ch. engchi. benefits from patents then it is likely that reductions in uncertainty will imply a larger effect on firms’ incentives to innovate. Government’s attempts to reduce uncertainty will have a direct effect on productivity through increasing the productivity impact. Martin A. Bader and Frauke Ruether surveyed Europe’s 500 firms and found that innovations and patents make important contributions towards corporate success. Since innovations are of immense significance in the attainment of a competitive edge today, their protection may create durable corporate success. Innovations and patents are therefore considered to be success factors for companies of all sizes and industries. More than 90. - 19 -.
(22) percent of the interviewees emphasized the importance of innovations and patents for corporate success. Innovative products and patents contribute to turnover, profit of firms and are held in high esteem as drivers of success. The results of this study thus confirmed that patents no longer are solely used for protection but started to be seen as a corporate success factor and as an asset. They used three valuation approaches for patents: a) market approach which compared the data between the comparable object and the value sought, b) income approach which is based on the assumption that the value of an intangible asset results from. 政 治 大. the future success which will be generated by the asset in the form of cash flows, c) cost. 立. approach which checks the costs required to create an exact duplicate of the asset in question. ‧ 國. 學. or the costs for the manufacture or acquisition of a similar asset.. ‧. Christian Helmers assessed the effect associated with patenting on firm growth for high-. sit. y. Nat. and medium-tech start-up companies in Great Britain between 2000 to 2001. He did not find. io. er. patenting to be associated in a robust and statistically significant way with firm growth. While coefficient of the patenting indicator is positive and statistically significant indicating a. n. al. Ch. growth advantage, the coefficient of trademarks. engchi. v i n and the number U. of directors are not. statistically significant. The coefficient of the initial assets, firm growth is negatively correlated with start-up size. The correlation between a firm’s average growth performance and investment amount is statistically and economically significant. An increase of firm’s growth was economically sizeable effect.. - 20 -.
(23) Chapter 3. Financial Analysis of Correlation between technological innovation and performance of Korean firms. 3.1 Technological innovation. 治 政 to companies by making unique products or low cost大 products with innovative production 立 process or attractive products which meet the requirements and needs of customers.. Technological innovation may relatively contribute financial stability and profitability. ‧ 國. 學. Technologically innovative firms may show better financial performance than less innovative. ‧. firms.. sit. y. Nat. n. al. er. io. 3.1.1 Granted Patent data. Ch. i n U. v. The database of patents by firms and industry is constructed based on the data of Korean Intellectual Property Office.. engchi. - 21 -.
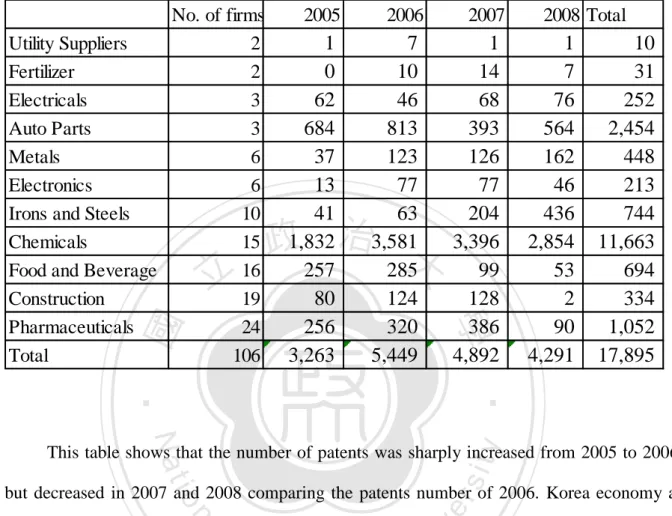
(24) Table 3-1 Distribution of industries by patent (2005 – 2008). 1 0 62 684 37 13 41 1,832 257 80 256 3,263. 2006. 2007. 7 10 46 813 123 77 63 3,581 285 124 320 5,449. 政 治 大. 1 14 68 393 126 77 204 3,396 99 128 386 4,892. 2008 Total. 1 7 76 564 162 46 436 2,854 53 2 90 4,291. 10 31 252 2,454 448 213 744 11,663 694 334 1,052 17,895. ‧. ‧ 國. 立. 2005. 學. No. of firms Utility Suppliers 2 Fertilizer 2 Electricals 3 Auto Parts 3 Metals 6 Electronics 6 Irons and Steels 10 Chemicals 15 Food and Beverage 16 Construction 19 Pharmaceuticals 24 Total 106. y. Nat. sit. This table shows that the number of patents was sharply increased from 2005 to 2006,. n. al. er. io. but decreased in 2007 and 2008 comparing the patents number of 2006. Korea economy as. i n U. v. well as global economy had been slow down from 2007, which might have affected the firms. Ch. engchi. and industries to be conservative to the investment in research and development of new technology. From the total number of 17,895 patents during the period of. 2005 to 2008, chemical. makers take 65% of patents, which can be said that one chemical company registered 195 patents per year. Chemical makers might have been very aggressive for technological innovation in the competitive environment. Auto parts companies occupy 13.7% of patents, indicating 205 patents per company, which might have reflected rapid growing of technology and safety to lead the vehicle markets and provided the best value to users.. - 22 -.
(25) 3.2 Hypothesis It is reasonable to assume that technological innovation will positively affect financial performance of firms. Technologically innovative company may show higher efficiency of every unit of shareholder’s equity to generate better profit. The technologically innovative firm may appeal its product to the market for better function and efficiency, thus its product can sell at higher price. Even at the same selling price with that of competitors, it can enjoy higher profit due to its low cost from its process innovation. Technological firms may invest. 政 治 大. more in new equipments and may borrow much money from bank or loaner for its R&D. 立. purpose. In this case its pure earning by its technological innovation with higher value and. ‧ 國. 學. process competitiveness may be higher than less innovative firms. This leads to the first hypothesis.. ‧ y. sit. io. er. EBITDA). Nat. H1: Technological innovation leads the firms to higher profitability (gross profit, ROE, ROA,. The importance of R&D can’t be too much emphasized for firm’s technological innovation, and. n. al. i n U. v. technological innovation will contribute to firm’s performance. Commonly technological. Ch. engchi. innovation is output of R&D. The more R&D activities may bring more technological innovation. So, technologically innovative firms may invest more in R&D which may bring better performance. This leads to the second hypothesis.. H2: Technological innovation leads the firms to invest more in R&D which results in higher performance. The product of the technologically innovative firm may sell better in the market, because it has cost competitive from its production process innovation, or higher and better function in its product with technological innovation. In this respect, the technologically innovative firm may have better sales revenue. Companies with low profit margin tend to have high asset turnover, while companies with high profit margin tend to have low asset turnover. This leads to the third hypothesis.. - 23 -.
(26) H3: Technologically innovative firms have lower asset turnover. (We assume that technologically innovative firms show high margins.) The product of technologically innovative firm may take a position of advantage with better function and efficiency comparing with competitors. Users may prefer it to similar or equivalent product. More frequent selection and preference for the product of technologically innovative firm may contribute to higher growth in sales. This leads to the seventh hypothesis.. H4: Technologically innovative firms show higher sales growth.. 政 治 大 better than that of competitors. So, the growth of technologically innovative firms may exceed 立 GDP growth of Korea. And even in the slow time of national economy, its products may still. In the high wave of national economy, the product of technologically innovative firm may sell. ‧ 國. 學. show better sales, while the product of less technologically innovative firms may suffer in sales. This may lead to the eighth hypothesis.. ‧. H5 : Technologically innovative firms may exceed GDP of Korea in growth.. n. al. er. io. sit. y. Nat. 3.3 Methodology. Ch. engchi. i n U. v. 3.3.1 Past Financial Performance. We will use a methodology across historical time periods for the same company to see if correlation exists between the number of granted patent and each financial performance. This relationship, which is expressed by what is known as correlation coefficient, is represented by a value within the range of 1 to -1.. - 24 -.
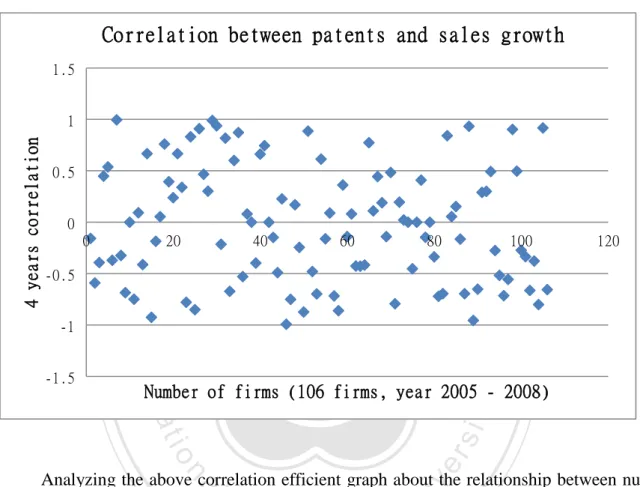
(27) 3.3.1.1 Correlation between patents and sales growth. Figure 3-1 Correlation between patents and sales growth. Correlation between patents and sales growth 1.5. 0.5 0 -0.5 -1. 立. 40. 60. 80. 100. 120. ‧. -1.5. 20. ‧ 國. 0. 政 治 大. 學. 4 years correlation. 1. n. al. er. io. sit. y. Nat. Number of firms (106 firms, year 2005 - 2008). i n U. v. Analyzing the above correlation efficient graph about the relationship between number. Ch. engchi. of patents and sales growth, 15 of 106 firms show perfect or strong positive linear relationship (from 0.7 to 1.0), and 21 firms show moderate positive linear relationship (from 0.3 to 0.7), and 15 firms show weak positive linear relationship (from 0.1 to 0.3), and 6 firms indicate no linear relationship ( zero ). Meanwhile 12 firms show weak negative linear relationship (from - 0.1 to – 0.3), and 16 firms show moderate liner negative relationship (from – 0.3 to – 0.7), and 21 firms indicate perfect or strong negative leaner relationship. Checking the firms of strong positive and moderate positive correlation in details, 1 of 3 auto parts firms, 4 of 15 chemicals firms, 4 of 19 construction firms, 1 of 3 electrical firms, 1. - 25 -.
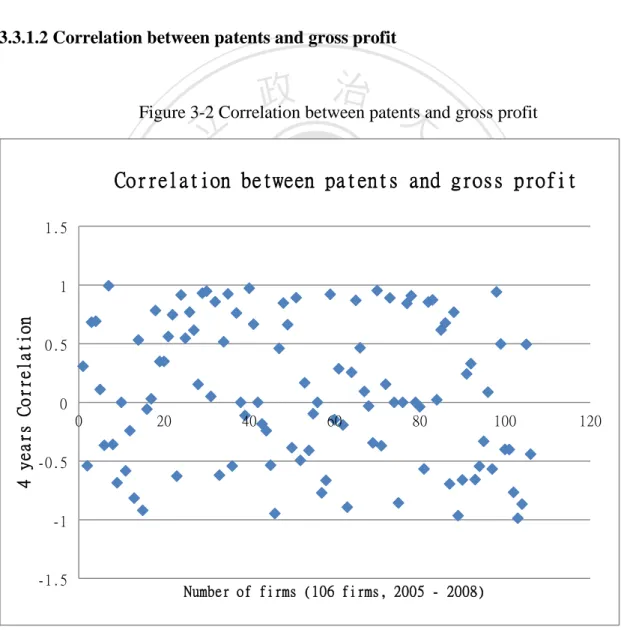
(28) of 6 electronic firms, 1 of 2 fertilizer firms, 2 of 16 food and beverage firms, 2 of 6 metal firms, 14 of 24 pharmaceutical firms, 3 of 10 iron and steel firms fall in the range of strong or moderate position correlation. This analysis result does not show correlation between patents and sales growth. 3.3.1.2 Correlation between patents and gross profit. 治 政 Figure 3-2 Correlation between patents 大and gross profit 立. sit. n. al. er. io. 0.5. y. Nat. 1. ‧. ‧ 國. 1.5. 4 years Correlation. 學. Correlation between patents and gross profit. 0 0. 20. Ch 40. e n g60c h i. i n U. v. 80. 100. 120. -0.5. -1. -1.5. Number of firms (106 firms, 2005 - 2008). Reviewing the above correlation efficient graph about the relationship between number of patents and gross profit, 23 of 106 firms show perfect or strong positive linear relationship. - 26 -.
(29) (from 0.7 to 1.0), and 19 firms show moderate positive linear relationship (from 0.3 to 0.7), and 12 firms show weak positive linear relationship (from 0.1 to 0.3), and 7 firms indicate no linear relationship ( zero ). Meanwhile 10 firms show weak negative linear relationship (from - 0.1 to – 0.3), and 25 firms show moderate linear negative relationship (from – 0.3 to – 0.7), and 10 firms indicate perfect or strong negative leaner relationship. Checking the firms of strong positive and moderate positive correlation in details, 1 of 3. 政 治 大 of 6 electronic firms, 1 of 2 fertilizer firms, 4 of 16 food and beverage firms, 3 of 6 metal 立 auto parts firms, 3 of 15 chemicals firms, 9 of 19 construction firms, 0 of 3 electrical firms, 2. firms, 15 of 24 pharmaceutical firms, 1 of 2 utility supply firms fall in the range of strong or. ‧ 國. 學. moderate position correlation.. ‧. This analysis result does not show correlation between patents and gross profit. n. er. io. sit. y. Nat. al. Ch. engchi. - 27 -. i n U. v.
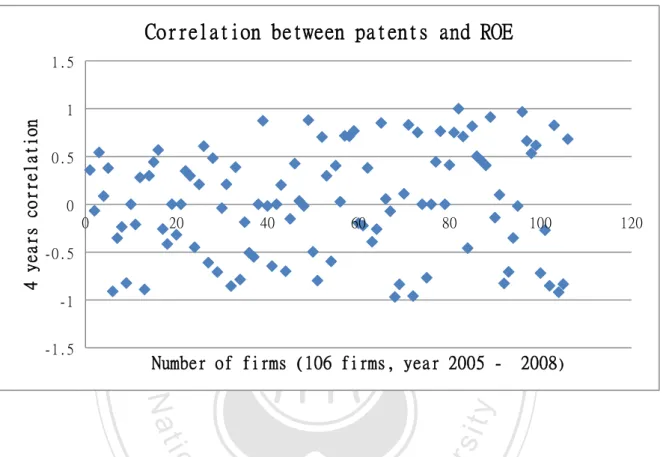
(30) 3.3.1.3 Correlation between patents and ROE Figure 3-3 Correlation between patents and ROE. Correlation between patents and ROE 1.5. 0.5 0 0. 20. -0.5. 60. 80. 100. ‧. -1.5. 40. ‧ 國. -1. 立. 政 治 大. 120. 學. 4 years correlation. 1. Number of firms (106 firms, year 2005 -. Nat. er. io. sit. y. 2008). Reading the above correlation efficient graph about the relationship between number of. al. n. v i n patents and ROE, 17 of 106 firmsCshow perfect or strong positive linear relationship (from 0.7 hengchi U to 1.0), and 21 firms show moderate positive linear relationship (from 0.3 to 0.7), and 14. firms show weak positive linear relationship (from 0.1 to 0.3), and 7 firms indicate no linear relationship ( zero ). Meanwhile 16 firms show weak negative linear relationship (from - 0.1 to – 0.3), and 13 firms show moderate linear negative relationship (from – 0.3 to – 0.7), and 18 firms indicate perfect or strong negative linear relationship. Checking the firms of strong positive and moderate positive correlation in details, 1 of 3 auto parts firms, 6 of 15 chemicals firms, 12 of 19 construction firms, 0 of 3 electrical firms, 2 of 6 electronic firms, 1 of 2 fertilizer firms, 6 of 16 food and beverage firms, 2 of 6 iron and. - 28 -.
(31) steel firms, 1 of 6 metal firms, 6 of 24 pharmaceutical firms, 1 of 2 utility supply firms fall in the range of strong or moderate position correlation. This analysis result does not show correlation between patents and ROE. 3.2.2 Comparative Financial Performance This analysis shows the comparison of financial performance of industries, firms,. 政 治 大 number of granted patent and 立financial performance ratio.. largest number patents and the rest firms in the same industry if correlation exists between the. ‧ 國. 學 ‧. 3.3.2.1 Profitability. sit. y. Nat. It is to measure the ability to earn income and sustain growth in both of short and long. io. al. er. term, and provide measures of the success of the firm at generating profits, to measure the. n. firm’s use of its assets and control of its expense to generate an acceptable rate of return.. Ch. engchi. i n U. v. 3.3.2.1.1 Gross profit ratio Gross profit margin reflects the efficiency, value and cost of the product. If the product is made by technological innovation, the process cost should be cheaper or the selling price should be relative higher. The product of innovative firm may have price competitiveness either by selling at higher price due to better attractiveness to customers or by making low cost with innovative production process. (Sales-COGS) / sales - 29 -.
(32) 3.3.2.1.1.1 Industry Comparison Figure 3-4 Average number of patents per firm by industry. Average No. of patents 900 800 700 600 500 400 300 200 100 0. 立. 政 治 大. Average No. of patents. ‧. ‧ 國. 學 sit. y. Nat. io. er. Analyzing the industries with the number of granted patent during the period of 2005 to. al. v i n C hand construction firms, for fertilizer firms, electronics firms e n g c h i U 40 to 60 for pharmaceutical firms, n. 2008, the average granted patents number per year is below 10 for utility suppliers, 20 to 40. food and beverage firms, 60 to 90 for electrical firms and metal firms, while chemical firms and auto parts firms show around 800 granted patent. The number of granted patents of medium size electronic companies are relatively much lower than the conglomerate Samsung Electronics ( 2005: 18,000 patents, 2006 : 17,000 patents, 2007 : 12,000 and 2008 : 8,000) and LG Electronics ( 2005 : 13,000 patents, 2006 : 8,500 patents, 2007 : 6,000 and 2008 : 5,700).. - 30 -.
(33) Figure 3-5 Average profit ratio per firm by industry. Average profit ratio 60% 50% 40% 30% 20% Average profit ratio. 10% 0%. 立. 政 治 大. ‧. ‧ 國. 學 sit. y. Nat. The firms in the industries of irons and steels, metal and electronic industries show. io. er. around 10% average gross profit ratio during the period of 2005 to 2008, and 10% to 20%. al. gross profit ratio for utility suppliers, electrical firms, construction firms, chemical firms and. n. v i n C hprofit ratio for food auto parts firms, 20% to 30% gross e n g c h i U and beverage firms, fertilizer firms, while pharmaceutical firms shows 53% gross profit ratio. Fertilizer companies are just a few players, so they may enjoy reasonable profit. Pharmaceutical firms, food and beverage firms may keep good profit ratio from low cost of products, even with commonly believed high research and development expense. The firms with largest number of granted patent in fertilizer and chemical industries show far higher gross profit ratio, difference to be 25 % higher for fertilizer and 15% higher for chemicals, than the other firms in the same indutries, while the firms with largest number of granted patent in the other 9 industries stay close to the other firms in the same industries for gross profit. - 31 -.
(34) 3.3.2.1.1.2 Comparison of firms inside the same industry Gross profit ratio among the firms inside the same industry is compared if there is correlation with the number of granted patents. The analysis indicates that individual company in the same industry shows the positive correlation trend rather than the comparison of industry to indistry. The below is the comparison table.. 政 治 大. Table 3-2 Comparison of profit ratio between largest number patents firm and the rest. 立. Food and Beverage. Electricals Construction. al. n. Electronics. io. Fertilizer. Nat. Metals. 13.6%. 4. 17.2%. 686. 15.8%. 7. 11.4%. 541. 63.0%. 23. 52.2%. 428. 7.2%. y. Pharmaceuticals. 6. 4. 10.4%. 343. 31.1%. 18. 25.8%. 28. 36.6%. 3. 11.9%. 25. 7.5%. 14. 14.5%. ‧. Irons and Steels. average gross profit. Average No. of patents. er. Utility Suppliers. average gross profit. sit. Patent number. the rest companies. 學. ‧ 國. company with most number patents. i n C 224 h i U e n g c h8.3% 88. 11.9%. v. 103. 13.9%. 13. 12.8%. Chemicals. 5976. 29.1%. 406. 14.4%. Auto Parts. 1906. 19.8%. 274. 15.1%. Some industries show positive correlation between the number of granted patent and gross profit ratio, some do not. The industries that show positive correlation are irons and steels firms, pharmaceutical firms, food and beverage firms, fertilizer firms, eletronic firms, construction firms, chemical firms and auto part firms. While the industries that do not show positive correlation are utilitiy firms, metal firms and electrical firms. In total 8 of 11. - 32 -.
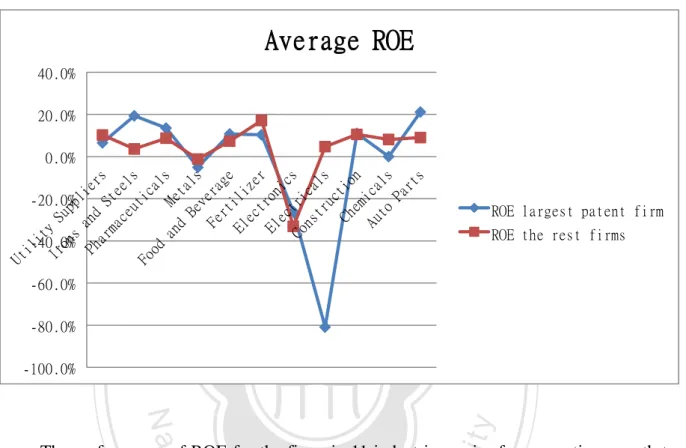
(35) industries have positive correlation between the number of patent citations and gross profit ratio.. 3.3.2.1.2 Return on Equity (ROE) ROE is the bottom line measure for the shareholders, measuring the profits earned for each dollar invested in the firm’s stock. Innovative product can make higher ROE than less. 政 治 大. innovative product. ROE shows how well the company with innovative products uses. 立. ROE is best used to compare companies in the same industry.. 學. ‧ 國. investment fund to generate earnings growth. The range of 15% to 20% of ROE is desirable.. ‧. ROE = Net Income / Equity. n. er. io. sit. y. Nat. al. Ch. engchi. - 33 -. i n U. v.
(36) 3.3.2.1.2.1 Industry comparison Figure 3-6 Average ROE per firm by industry. Average ROE 40.0% 20.0% 0.0% -20.0% -40.0%. 立. 政 治 大. ROE largest patent firm ROE the rest firms. -60.0%. ‧ 國. ‧. -100.0%. 學. -80.0%. sit. y. Nat. io. er. The performance of ROE for the firms in 11 industries varies from negative growth to. al. v i n C h show negative 24% of 2005 to 2008, and electrical firms e n g c h i U ROE average for the same period, n. positive growth. Electronic firms have negative 32 % ROE average per year during the period. and metal firms do negative 2% ROE average for the same period. Auto parts firms and construction firms range their ROE average around 11% to 13%, and other industries show their ROE average less 10%. Generally speaking about ROE of all industries, the performance is under 15%, which is considered to be under desirable level of commercial entity. In industries level, the number of granted patent does not seem to influence positively on ROE performance.. - 34 -.
(37) 3.3.2.1.2.2 Company comparison inside the same industry Table 3-3 Comparison of ROE between largest number patents firm and the rest company with most number patents Patent number. average ROE. the rest companies average ROE. Average No. of patents. 6. 6.5%. 4. 10.2%. Irons and Steels. 686. 19.3%. 7. 3.6%. Pharmaceuticals. 541. 13.5%. 23. 8.7%. Metals. 428. -5.1%. -1.2%. Food and Beverage. 10.7% 政 治 28 10.3% 大. 4. 343. 18. 7.3%. 3. 17.1%. 88. -26.1%. 25. -33.1%. 224. -80.9%. 14. 4.7%. 103. 11.0%. 13. 10.5%. 5976. 0.0%. 406. 8.1%. 1906. 21.1%. 274. 9.0%. 立. Fertilizer Electricals Construction Auto Parts. Nat. sit. y. ‧. Chemicals. ‧ 國. Electronics. 學. Utility Suppliers. io. er. Direction of the number of granted patent is inconsistent with that of ROE performance. Even largest number of granted patents firms in the metals, electronics, electrical industries. al. n. v i n C hthe period of 2005Uto 2008, and the rest firms in those show negative ROE growth during engchi. industries also struggle with negative ROE growth during the same period. The firms with largest number of granted patents in the auto parts, iron and steels industries. enjoy around. 20 % ROE growth, which is much higher than their competitors showing 4%. and 9%. respectively.. 3.3.2.1.3 Return on Assets ROA is a measure how effectively the firm’s assets are being used to generate profits. This is a useful number for comparing competing companies in the same industry.. - 35 -.
(38) Technologically innovative firm do not have to invest too much in fixed assets as conventional industries. So, innovative firm may have higher ROA than the less firms.. ROA = Net income / Total Assets. 3.3.2.1.3.1 Industry comparison Figure 3-7 Average ROA per firm by industry. 政 治 大. 立 Average. ‧ y. sit. n. al. er. io. 0.0%. Average ROA largest patent firm Average ROA the rest firms. Nat. 5.0%. ‧ 國. 10.0%. 學. 15.0%. ROA. -5.0%. Ch. engchi. i n U. v. -10.0%. Electrical firms have 1% annual average ROA during the period of 2005 to 2008, while the number of granted patent is largest among the industries. Irons and steels firms, metal firms registered the patents over 70 cases with average ROA to be 3.5% and 2.1% respectively. Pharmaceutical firms show 6% average ROA, while utility firms, food and beverage firms, construction firms reach around 4% average ROA. Electronic firms suffer from negative. - 36 -.
(39) growth of average ROA during the same period.. 3.3.2.1.3.2 Company comparison inside the same industry Table 3-4 Comparison of ROA between largest number patents firm and the rest the rest companies. company with most number patents Patent number. Utility Suppliers. 6. Irons and Steels. 立686. Auto Parts. 2.9%. 23. 5.9%. 4. 2.9%. 6.6%. 18. 3.9%. 28. 6.8%. 3. 7.4%. 88. -6.9%. 25. 0.2%. 224. -4.3%. 14. 3.7%. 103. 6.0%. 13. 4.0%. 406. 4.5%. 274. 6.0%. a5976 l C 1906 h. n. Chemicals. io. Construction. 343. 7. y. Electricals. Nat. Electronics. -2.1%. 4.8%. sit. Fertilizer. 428. 3.0%. e n12.8% gchi. er. Beverage. 6.7%. 4. ‧. Food and. 541. average ROA. Average No. of patents. 學. Metals. ‧ 國. Pharmaceuticals. 政 3.2%治 大 8.9% average ROA. i n U. v. The firms with largest number of patent citations in the industries of iron and steels, pharmaceuticals, food and beverage, constructions, auto parts keep superior characteristics to the firms with less number of patents, while largest number of granted patents in the industries of utility, metals, fertilizer, electronics, electrical and chemicals do not have correlation between the number of granted patent and average ROA .during the period of 2005 to 2008.. - 37 -.
(40) 3.3.2.2 Stability This is a measure of a company’s financial leverage indicating what proportion of equity and debt that the company uses to finance its assets. A high debt to equity ratio generally means that a company has been aggressive in financing its growth with debt. This can result in volatile earnings as a result of the additional interest expense. The debt to equity ratio also depends on the industry in which the company operates.. 3.3.2.2.1 Debt to Asset ratio. 立. 政 治 大. The higher the ratio, the greater risk will be associated with the firm’s operation,. ‧ 國. 學. indicating low borrowing capacity of a firm, which in turn will lower the firm’s financial. ‧. flexibility. If the ratio is less than 0.5, most of the company’s assets is financed through equity. If the ratio is greater than 0.5, most of the company’s assets is financed through debt.. y. Nat. er. io. sit. Technologically innovative company should not stay on high debt ratio in consecutive years, because the company can lower down the debt ratio after its innovative product is on the. n. al. market.. Ch. engchi. Total Debt / Total Assets. - 38 -. i n U. v.
(41) 3.3.2.2.1.1 Industry comparison Figure 3-8 Average debt ratio per firm in order from highest ratio to lowest. Average debt ratio 120.0% 100.0% 80.0%. 政 治 大. 60.0% 40.0%. 立 40. 60. 80. 100. 120. ‧ y. Nat. 40 of 106. 20. firms can be said to be through debt which means their debt to asset ratio is. sit. 0. 學. 0.0%. ‧ 國. 20.0%. Average debt ratio. n. al. er. io. over 0.5 (50%), 66 firms are through equity which means their debt to asset ratio is less 0.5. i n U. v. (50%) as annual average during the period of 2005 to 2008. In the analysis, a few firms have a. Ch. engchi. sudden increase of debt ratio in a certain year which affected bad influence to the average debt ratio to look poor. Many firms with a good number of patents also have high debt to asset ratio.. - 39 -.
(42) 3.3.2.2.1.2 Company comparison inside the same industry Figure 3-9 Patent total (2005 – 2008) per company. Patent total 100 90 80 70 60 50 40. 立. 30. 0. 1 5 9 13 17 21 25 29 33 37 41 45 49 53 57 61 65 69 73 77 81 85 89. Nat. sit. y. ‧. ‧ 國. 10. Patent total. 學. 20. 政 治 大. io. er. Among 106 firms, top 20 firms have 120 to 6,000 patent citations which make the graph. al. v i n order of the number of granted C patents the correlation between the number of patents h etonsee gchi U n. not to read easy, so I skipped top 20 firms to make the graph. The firms were top downed in. and debt to asset ratio during the period of 2005 to 2008. This is to see if the firms with larger number of granted patent have less debt to asset ratio by comparing the graph trend as below. The order of the firms in the average debt ratio as below is the same order as the above of patent total.. - 40 -.
(43) Figure 3-10 Average debt to asset ratio per firm in order of patents number. Average debt ratio 1.2 1 0.8 0.6 0.4. 立. 1 6 11 16 21 26 31 36 41 46 51 56 61 66 71 76 81 86 91 96 101 106. Average debt ratio. 學. ‧ 國. 0.2 0. 政 治 大. ‧ y. Nat. io. sit. Average debt ratio of the firms do not show positive correlation with the number of. n. al. er. granted patent, but top 60 firms have relatively better debt to asset ratio than the last 56 firms. Ch. during the period of 2005 to 2008.. engchi. i n U. v. Utility supplier industry shows 50% debt to asset raito for the firm with largest number of granted patents and 53% for the rest firms. Irons and steels firms indicate 54% debt ratio for the firm with largest number of granted patents and 41% for the rest firms in the same industry. Pharmaceutical firms range 50% debt ratio for the firm with largest number of granted patents and 39% for the rest firms. Food and beverage industry, fertilizer industry, chemicals industry and. electronics industry show 40% to 45% debt ratio for the firms with. largest number of granted patents as well as the rest firms. Electrical firms show 103% debt ratio for the largest number of patent citations and 22% debt ratio for the rest firms, while. - 41 -.
(44) auto parts firms indicate 39% debt ratio for the firm with largest number of granted patent and 100% debt ratio for the rest firms.. 3.3.2.3. Liquidity Ratio This provides information about a firm’s ability to meet its short-term financial obligation.. In general, the higher the value of the ratio, the larger the margin of safety that. 政 治 大 will not have high debt ratio 立in consecutive years, even though the debt ratio may be higher. the company possesses to cover short-term debts. The technologically innovative company. ‧. ‧ 國. 學. when it borrows money, but should not stay high in continuous years.. 3.3.2.3.1 Current ratio. y. Nat. sit. The higher the current ratio, the more capable the company is of paying its obligations.. n. al. er. io. A ratio under 1 (one) suggests that the company would be unable to pay off. i n U. its obligations if. v. they come due at that point. The current ratio can give a sense of the efficiency of a. Ch. engchi. company’s operating cycle or its ability to turn its product into cash. The innovative products that technologically innovative firms produce should be easy to turn into cash with strong attractiveness to customers.. Current Ratio = Current Assets / Current Liabilitie. - 42 -.
(45) Figure 3-11 Average current ratio (industry). Average Current ratio (industry) 3.5 3.0 2.5 2.0 1.5 1.0 0.5 0.0. 立. Average Current ratio (industry). 政 治 大. ‧. ‧ 國. 學 y. Nat. io. sit. All of 11 industries show healthy current ratio which is above 1 (one) as annual average. n. al. er. during the period of 2005 to 2008. Comparing the current ratio of 11 industries, Electrical. Ch. firms rank highest current ratio at 3.. i n U. v. Pharmaceutical firms and metal firms have 2.7, while. engchi. fertilizer firms show 2.3 current ratio. Food and beverage firms, irons and steels firms, construction firms locate at the current ratio of 1.5 to 1.9. Utility firms, auto parts firms and chemical firms show the current ratio at 1.0 to 1.4.. - 43 -.
(46) Figure 3-12 Average current ratio per firm in order from largest number of patents to lowest. 3.0 2.5 2.0. Firm with largest number of patents. 1.5 1.0 0.5 0.0. 立. 政 治 大. The rest firms. 學 ‧. ‧ 國. Current asset/current debt. Average current ratio. y. Nat. sit. Comparing individual firms in the same industry, the firms with largest number of. n. al. er. io. granted patents show higher current ratios only in three industries; utility supplier, auto parts and fertilizer during period of 2005 to 2008.. Ch. i n U. v. Higher current ratios are shown for the rest. engchi. firms which are not largest number of granted patents in the other industries. So, current ratio does not show positive correlation with the number of patent citations.. 3.3.2.4 Efficiency Ratio This ratio is used to measure the company’s use of the assets in generating sales revenue or sales income to a firm.. - 44 -.
(47) 3.3.2.4.1 Asset turnover ratio The firms with low profit margin tend to have high asset turnover, while the firms with high profit margin tend to have low asset turnover, because more assets are required to generate revenue which leads to more competition and less ability to raise price.. Companies. in retail industry tend to have a very hihg asset turnover ratio due mainly to cutthroat and competitive price. The higher the ratio when compared to competitors or year to year trends, the more efficiently management has used the company assets to generate revenue. Less. 政 治 大. technologically innovative company may have very high asset turnover due to cutthroat and. 立. competitive pricing. The product of high asset turnover can be daily or weekly consuming,. ‧ 國. 學. while the product of low asset turnover can be purchased once or twice per year. The technologlically innovative company will utilize its assets to generate high value and profit.. ‧ y. Nat. n. er. io. al. sit. Asset turnover = Sales / Total Asset. Ch. engchi. - 45 -. i n U. v.
(48) Figure 3-13 Average asset turnover (industry). Average Asset turnover (industry) 1.4 1.2 1.0 0.8 0.6 0.4 0.2 0.0. Average Asset turnover (industry). 立. 政 治 大. ‧. ‧ 國. 學. Each industry may request different level of capital investment to remain competitive. Nat. sit. y. and strengthen competitiveness, so the comparison among indusries may not give correct. n. al. er. io. information in the time of industry comparison. As explained in the beginning of this thesis,. i n U. v. all of the firms in this thesis has 500 millions US dollars as its total capital which may be a. Ch. engchi. reference tool not to deviate this comparison from reasonable analysis. Analyzing the above table, pharmaceutical industry, irons and steels industry have 0.9 which is lowest asset turnover among industries, while electronics industry, construction industry, chemicals industry and auto parts industry show their asset turnover ratio at 1.0. The rest industries have 1.2 of asset turnover ratio during the period of 2005 to 2008. It may say that pharmaceutical, irons and steels enjoy high profit margin business, while the industries such as utility suppliers, metals, food and beverage, fertilizers and electrical. - 46 -.
(49) firms are involved in price competitive market.. Figure 3-14 Average asset turnover per firm in order from largest number of patent to lowest. 2.50 2.00 1.50 1.00. 立. 0.50 0.00. Firm with largest number of patents. 政 治 大. The rest firms. ‧. ‧ 國. 學. Net sales/Total asset. Average asset turnover. er. io. sit. y. Nat. al. v i n C h of granted patents between the firm with largest number e n g c h i U and the rest firms in the same n. As for asset turnover of the firms in the same industry, asset turnover ratio is compared. industry during the period of 2005 to 2008. The firm with largest number of granted patents and the rest firms show their asset turnover at 0.86 and 1.63 respectively in utility supplier industry, and 0.83 asset turnover for the firm with largest number of granted patent and 0.96 for the rest firms for irons and steels industry, 0.78 asset turnover for the firm with largest number of patent citations and 0.87 for the rest firms for pharmaceuticals industry, 1.0 asset turnover for the firm with largest number of granted patents and 1.25 for the rest firms for food and beverage industry . 0.71 asset. - 47 -.
(50) turnover for the firm with largest number of granted patents and 1.74 asset turnover for the rest firms for fertilizer industry. Chemicals and construction industries show similar level of asset turnover between the firm with largest number of patents and the rest firms. The rest firms shows lower asset turnover than the firms with largest number of patents in the industries of electricals, metal and auto parts. Even though the asset turnover does not indicate considerable relationshipe with the. 政 治 大. number of granted patents, 8 of 11 industries are on the curve of positive correlation between asset turnover and patents number.. 學. ‧ 國. 立. 3.3.2.4.2 Degree of operating leverage. ‧. Technologically innovative firms will make the products with higher profit margin, or. sit. y. Nat. market controllable product with patent, which may bring higher growth in profit margin. io. n. al. er. comparing that of growth in sales revenue.. Ch. engchi. i n U. v. Degree of operating leverage = Percent change in gross profit / percent change in sales. - 48 -.
(51) Figure 3-15 Change of gross profit and change of sales (2005 to 2008) 400%. 300%. 200%. 100%. ‧ 國. Change of sales 2007 Change of sales 2008. al. n. -500%. Change of gross profit 2007. Ch. engchi. Change of gross profit 2008. sit. Change of gross profit 2006. er. io. -400%. y. Nat. -300%. Change of sales 2006. ‧. -200%. 學. -100%. 立. 1 4 7 10 13 16 19 22 25 28 31 34 37 40 43 46 49 52 55 58 61 64 67 70 73 76 79 82 85 88 91 94 97 100 103 106. 0%. 政 治 大. i n U. v. Analyzing the trend of growth between sales and gross profit during the period of 2005 to 2008, it is hard to find positive correlation between the number of granted patents and the growth trend of net income as well as sales growth. The firm with largest number of patents in utility supplier industry show incremental change of sales from 2005 to 2008, while the gross profit fluctuates year by year during the period of 2005 to 2008. The other firm in utility industry indicates same trend between the - 49 -.
(52) change of sales growth and gross profit. The sales of the firm with largest number of patents in pharmaceutical industry shows increase year by year, while the gross profit trend of growth fluctuates year by year during the period of 2005 to 2008. The sales change of 15 of the other 23 firms in pharmaceutical industry moves to same direction with the change of gross profit, while 8 of 23 pharmaceutical firms do not. Change of sales growth is positive year by year for the firm with largest number of patents in metal industry as the gross profit increases during 2005 to 2008. 3 of the other 5 firms in metal industry indicate same trend between change of. 政 治 大. sales growth and gross profit during 2005 to 2008, while 2 of the other 5 firms move. 立. differently. The firm with largest number of patents in irons and steels industry has positive. ‧ 國. 學. correlation between patent numbers and change of sales growth, change of gross profit growth. 6 of the other 9 firms in irons and steels industry move on same direction, while the other 3. ‧. firms do not. Change of sales growth of the firm with largest number patents moves to. y. Nat. sit. different direction with change of gross profit in food and beverage industry, 8 of the other 15. n. al. er. io. firms in food and beverage industry are on the same track of direction, while the other 7 firms. i n U. v. are not. Similar as above, some firms in the rest of industries such as fertilizers, electronics,. Ch. engchi. electrical, construction, auto parts do now show same trend between change of sales growth and gross profit, regardless of the number of granted patents.. 3.3.2.5 R&D expense and gross profit R&D can be one of major inputs for a firm’s technological innovation. The returns to R&D investment can be shown by a firm’s financial performance. R&D will bring a firm with innovative product or process innovation which is new to the firm or new to the market. The new product with new function or better function may attract customers so that they may be. - 50 -.
(53) willing to pay higher price or to replace the older one. With this positive return of R&D expense, firms may enjoy decent gross profit.. 3.3.2.5.1.1 Industry comparison The below figure shows the comparison between average R&D/Sales and average gross profit among different industries during the period of 2005 to 2008, to see if the more R&D. 政 治 大. expense has positive correlation with gross profit.. 立. Figure 3-16 Industry comparison for R&D/sales and gross profit. ‧ 國. er. sit. y. ‧. 20.0%. al. n. 30.0%. io. 40.0%. Nat. 50.0%. 學. 60.0%. Industry Comparison. Ch. engchi. i n U. v. Average R&D/sales Average gross profit. 10.0% 0.0%. Analyzing the above figure, pharmaceutical industry shows highest ratio of 3.0% average R&D/sales with 52.7% of average gross profit during the period of 2005 to 2008.. - 51 -.
(54) Food & beverage industry and fertilizer industry indicate 1.1% and 1.3% average R&D/sales ratio respectively with 26.2% and 26.9% of average gross profit respectively. Utility industry, electrical industry and chemical industry show 1.1% to 1.3% of average R&D/sales ratio respectively with 13% to 15% of average gross profit respectively. Metal industry, iron and steel industry, chemical industry indicate R&D/sales ratio less than 0.5% respectively with below 10% gross profit respectively, electronics and auto parts industries show the ratio around 0.7% - 0.8% with gross profit at 16.7% and 8% respectively. It shows somewhat. 政 治 大. positive relationship between average R&D/sales and average gross profit in industry. 立. comparison.. ‧ 國. 學. 3.3.2.5.1.2 Company comparison inside the same industry. ‧. The below figure shows the relationship of the number of patent citations with. y. Nat. n. al. Ch. engchi. - 52 -. er. io. number of patents has better gross profit than the others.. sit. R&D/sales and gross profit for the period of 2005 to 2008, to see if the firm with largest. i n U. v.
(55) Figure 3-17 Comparison of R&D/sales and gross profit per firm by industry. Comparison of R&D/Sales and Gross profit 100.0% 50.0% 25.0% 12.5%. largest number patent firm Average R&D/sales. 6.3% 3.1% 1.6% 0.8% 0.4%. 立. 0.2%. the others Average gross profit. ‧. ‧ 國. 學. 0.1%. 政 治 大. largest number patent firm Average gross profit the others Average R&D/sales. er. io. sit. y. Nat. al. R&D/sales ratio of the firm with largest number of patents shows 2% with 66.5% of. n. v i n C h while R&D/sales gross profit in pharmaceutical industry, e n g c h i U of the other firms is at 3% with 52.1% of gross profit. The firm with largest number of patents shows 2.5% R&D/sales with 17.1% gross profit while the others is at 0.1% R&D/sales with 36.6% gross profit in fertilizer industry. The firm with largest number of patents shows 2.8% R&D/sales with 14.8% of gross profit, while the others are at 0.8% R&D/sales with 15.4% gross profit in chemical industry. The firms with largest number of patents in metal, electronics and auto parts industries show higher gross profit with higher R&D/Sales than the others. The firms with largest number of patents in irons and steels, food and beverage, construction industries show lower R&D/Sales with higher gross profit than the other firms. The firms with largest number of patents in. - 53 -.
(56) utility and electrical industries show lower R&D/sales with lower gross profit than the others. The comparison of individual firms between largest number of patents and the others does not show as strong relationship as with the result of industries comparison. .. 3.3.3 Comparison between Korea GDP growth and sales growth 3.3.3.1 Korea GDP growth and sales growth 2005-2006. 政 治 大 In 2006, Korea suffered from slumped domestic market, high consumer price and high 立. ‧ 國. 學. unemployment, while enjoyed relatively good export growth with depreciation of Korean currency (Won) against US Dollar. Price competition that deteriorates net income of firms. ‧. became severe, and the macro environment for enterprise activity was tough. Under this. y. sit. io. n. al. er. domestic market.. Nat. circumstance, GDP growth of Korea reached over 5%, while all industry faced with cold. Ch. engchi. - 54 -. i n U. v.
(57) Figure 3-18 Korea GDP and sales growth, 2005 - 2006. GDP and Sales growth, 2006 80.0% 60.0% 40.0% Sales growth largest number patent firm Sales growth the rest firms GDP. 20.0% 0.0%. 立. -20.0%. ‧. -80.0%. ‧ 國. -60.0%. 學. -40.0%. 政 治 大. sit. y. Nat. al. n. patents. er. io. Based on 5.2% of GDP growth in 2006, The firms with largest number of granted. i n U. v. in 11 industries shows poor performance, while the rest firms reaches better. Ch. engchi. performance relatively. The largest number patent firms that show the sales growth over 5.2% are only from 3 industries ; irons and steels, electrical and auto parts. The firms with largest number of patents in the rest industries show the sales performance to be below 5.2% growth. The firms that are not largest number of patents show better performance than the largest number patent firms in 8 of 11 industries. Poor growth of year 2005-2006 is shown in the industries of fertilizer (0.8%). and auto parts (0.6%), food and beverage (1.5%) and. checmials (4.5%). The other firms in the rest industries indicate good performance of sales growth over 5.2%.. - 55 -.
數據

+7


相關文件
This glossary aims to provide Chinese translations of those English terms commonly used in the teaching of Business, Accounting and Financial Studies at secondary level
CAST: Using neural networks to improve trading systems based on technical analysis by means of the RSI financial indicator. Performance of technical analysis in growth and small
CAST: Using neural networks to improve trading systems based on technical analysis by means of the RSI financial indicator. Performance of technical analysis in growth and small
For the financial institutions, the implicit meanings of non-performing assets are facing the problems of deterioration of asset quality, bad mobility, poor
Another point to financial performance indicators used to measure the performance of the industry's performance, to explore market in domestic container shipping industry
The second part is to the interactions between the brightness, color temperature, and other performance of the bulb and the fabricating parameters such as: the filling volume of
This paper presents a Knowledge Value-Adding Model (KVAM) for quantitative performance evaluation of the Community of Practice (CoP) in an A/E consulting firm.. The
Wilson (1996), “A Longitudinal Study of the Impact of Market Structure, Firm Structure, Strategy, and Market Orientation Culture on Dimensions of Small-Firm Performance,” Journal
