National Chiao Tung University
Institute of Traffic and Transportation
Thesis
兩岸直飛政策對台灣航空產業之影響研究
Analysis of the Impact of Direct Flight Policy on
Taiwanese’s Aviation Industries
Advisor:Professor Jiuh-Biing Sheu
Graduate Student:Susana Tsang 9936535
兩岸直飛政策對台灣航空產業之影響研究
Analysis of the Impact of Direct Flight Policy on Taiwanese’s
Aviation Industries
研 究 生:曾玉玲 Student: Susana Tsang
指導教授:許鉅秉教授
Advisor: Professor Jiuh-Biing Sheu
國 立 交 通 大 學
交通運輸研究所
碩 士 論 文
A Thesis
Submitted to Institute of Traffic and Transportation College of Management
National Chiao Tung University in partial Fulfillment of the Requirements
for the Degree of Master
in
Traffic and Transportation Management July 2012
Taipei, Taiwan, Republic of China
中華民國一 0 一年七月
i
Analysis of the Impact of Direct Flight Policy on Taiwanese’s Aviation
Industries
Student: Susana Tsang Advisor: Professor Jiuh-Biing Sheu
Institute of Traffic and Transportation National Chiao Tung University
Abstract
For over half a century, there was no direct air transportation between Mainland China and Taiwan due to some political issues. However, the need for communication, trade exchange and globalization demand direct flight between the Taiwan Strait. After many years of negotiation, both sides of the Taiwan Strait have agreed to sign a series of cross strait agreements that help to facilitate the contact and develop the economics of both sides. In a general way, transportation system improvement can spread reductions in cost and gains in productivity through all the economic sectors that produce or distribute good. Improvement in transportation policy and/or planning can be expected to have important economic effects on carrier’s performance, shipper’s performance and the whole region economy.
The purpose of this study was to investigate the behavior of the relationship among stakeholders. Another aim was to find out the effect that can provoke signing an Air Policy between Mainland China and Taiwan. Finally, establish factors in which Air Policy effect would be assesses. By this way determine which factor is more desire for each stakeholder was examined in the study. The research study used survey questionnaire to examine the opinion and desire of aviation industries with respect to the Cross Strait Air Policy effect that could have on their industries. Questionnaires were sent out to airlines companies, high tech industries and governments. All stakeholders asked to carry out the questionnaire have trade and economic activities between Mainland China and Taiwan.
The results of the study were that government could contribute in the enhancement of freight transportation system. Policies released could help not only in the improvement of
ii
freight transportation systems, also, enhancing services quality within the freight transportation system. Additionally, it was found that the introduction of air policy could change industries performance. As air policy is introduced, airlines would have the freedom to decide if they want to serve or not a market. When airlines industry served a new market, they could experiment growth in many aspect of their industry activities such as new services, more traffic, more jobs and economic growth. On the other hand, new and better air services could attract and influence in some decision and performance of other industries such as manufacturing and high tech industries. Further, it was discovered that there are many weakness in Taiwanese transportation system which Taiwan government needed to care more about.
Moreover, some suggestion for aviation industries would be provided. As government plays a very important role in the freight transportation supply chain, they should develop better mode of planning and forecasting of capacity demand. Besides, as the implementation of the Cross Strait Air Policy is still recent, shippers can meet and test carrier's services quality. After ensured that carrier meet their necessity, shipper could strength their relationships. In addition, suggestion for carrier is also provided. The Cross Strait Air Policy only allows Mainland China and Taiwan airlines to have direct flight between both sides. However, only several airport at Mainland where opened for Taiwanese airlines to call at them. Asides, Mainland China has domestic air regulation in which the markets are served by specific Chinese airlines. As suggestion for Taiwanese carriers is to make alliance and partnership with Mainland China airlines, by this way, Taiwanese airlines can provide better services and complete freight flight connection for their customers.
The results revealed that each aviation industry stakeholder had different concern and desire with respect to the effects that Cross Strait Air Policy could bring to their companies. In short, policies could make freight transportation become faster and reliable. Therefore, the flow of goods could be managed with more efficiency. As a result, firms could maximize their benefit and welfare by enhancing their company’s performance.
KEYWORDS: Cross Strait Air Policy, Cross Strait Direct Flight, Aviation Industries, Freight
iii
Acknowledgement
It would not have been possible to write this thesis without the help and support of kind people around me, to only some of whom it is possible to give particular mention here.
I owe my deepest gratitude to my advisor, professor Jiuh-Biing Sheu, whose encouragement; guidance and support from the initial to the final level enabled me to develop an understanding of the subject. Besides, I would like to thank professor Mu-Chen Chen, who’s always, has patience and be available to guide any student that asked for help.
I would like to show my gratitude to my senior’s classmates, Ms Suru Lin and Lin-Chih Lin, whose constantly guidance, support and providing all kind of help for the development of my thesis research.
I am grateful to have so wonderful parent, Mom and Daddy, whose support me financially and for their patience at all time. Besides, I would like to thank Alex Zuniga for constantly been by my side and encourage me to complete my thesis project on time. He has made available his support in a number of ways.
Also, I would like to thank my friends for all the support provided during my thesis research. Specially, some of my ITT’s classmates such as Summer, Wendy, Suyun, Mg, who’s continuously provided their help with English-Chinese translation, guidance, and searching for someone to answer my survey. Thank you for all the help provided.
In addition, I would like to thank all those people that take a little bit of their time filling my survey questionnaire. Last but not less important, I would like to acknowledgement CSUCA for the opportunity they gave me and for the financial support they provided me.
This thesis would not have been possible unless for all the assistance my professors, senior’s classmates and classmates. I am indebted to all those people whose support me and believe in me. Thank to those who made this thesis possible. Lastly, I offer my regards and blessings to all of those who supported me in any respect during the completion of the project. Thank to those who made this thesis possible.
Susana L. Tsang July 2012
iv Table of Contents Page English Abstract……….. i Acknowledge………... iii Table of Contexts………...……….. iv List of Tables………..………. vi List of Figures………..……… ix I. Introduction………..…….………..…….. 1 1.1. Research Background……….……….………... 1 1.2. Research Motivations………...………... 8 1.3. Research Objectives……….…...…... 10
1.4. Research Scope and Flow……..………..………...…. 10
II. Literature Review………...………….…. 12
2.1. Aviation Industries Development………..…. 12
2.2. Asia Pacific Operational Center…...………..…… 33
2.3. Cross Strait Air Transportation Policy………...…………...………. 39
2.4. Cross Strait Current Problem………..……….……..…… 50
2.5. Methodology Literature Review……….…….…….. 63
2.5.1. Survey……….…………..……….…. 63
2.5.2. Analytic Hierarchy Process……….………..………. 64
III. Research Methodology………...……….……….… 68
3.1. Research Conceptual Framework….…...………...………… 68
3.2. Research Criteria………...………...……….. 69
3.3. Sampling Design………...………...……….. 73
3.4. Survey Questionnaires………..………. 75
v
IV. Data Analysis………..………....………….. 84
4.1. Data Collection………...……… 84
4.2. Test and Weighting Computation ………...……….………. 85
4.3. Analysis of all AHP’s level………...………...……….. 86
4.4. Overall level of Impact of Criteria Assessment………..………….. 106
V. Conclusions and Recommendation……….………..……… 111
5.1. Discussion……….…………..………...………… 111
5.2. Managerial Implication……….……….………… 113
5.3. Limitation of Study………....………… 114
5.4. Suggestions on Future Research……...……….………… 115
References.………...……….…………..… 116
Appendix I-Research Criteria……….……….……… 120
Appendix II-Survey Questionnaire (English version)………. 125
vi
List of Tables
Page
Table 1. Trade between Taiwan and China 6
Table 2. Change in travel time during the different period time 14
Table 3. Major airlines regions of China 16
Table 4. Air cargo concentration in Mainland China 17 Table 5. Airlines Codeshare and Alliance Groups I 18 Table 6. Airlines Codeshare and Alliance Groups II 19 Table 7. High Tech trade by Technologies in Mainland China 25 Table 8. Fact of Taiwanese owned IT Companies at Mainland China 26 Table 9. Shares of major IT products between Taiwan and Mainland China 26
Table 10. Taiwan Trade Free Zone 29
Table 11. Why choose Taiwan Free Zone 34
Table 12. Taiwan investment in Mainland China by Area 35 Table 13. Taiwan investment in Mainland China by Industries 36 Table 14. Cross Strait Air Transportation Agreement Stage 41 Table 15. Cross Strait Cargo Traffic by Airlines 42 Table 16. Cross Strait market share between Taiwanese national airlines 43 Table 17. Cross Strait Direct Flight Routes and Airlines-Taiwan airlines 44 Table 18. Cross Strait Direct Flight and Airlines-Mainland China airlines 45
Table 19. Cross Strait Cargo Flight 46
Table 20. Cargo movement at Taiwan airports I 48
Table 21. Cargo movement at Taiwan airports II 49
Table 22. Cargo Traffic by Airlines 51
Table 23. Cargo volume (percentage) by Airlines 51
Table 24. Numbers of Aircraft registered 52
Table 25. Taiwanese and China Airlines operational performances I 53 Table 26. Taiwanese and China Airlines operational performances II 55 Table 27. Airport performance influence logistics trends 60
Table 28. What are an Airport’s Impact? 61
vii
Table 30. Thesis research target sampling population 74
Table 31. Goal and objectives 78
Table 32. The AHP verbal scale ranges 1 to 9 (Saaty scale) 80
Table 33. Consistency Table 82
Table 34. Data collection-Stakeholder request 84
Table 35. Questionnaire’s criteria CI and CR 85
Table 36. Airlines Industry - Major Criteria’s Weighting 86 Table 37. High Tech Industry – Major Criteria’s Weighting 87 Table 38. Government – Major Criteria’s Weighting 87 Table 39. Overall Assessment- Major Criteria’s Weighting 88 Table 40. Airlines Industry – Mobility Weighting 88 Table 41. High Tech Industry – Mobility Weighting 90
Table 42. Government - Mobility Weighting 90
Table 43. Overall Assessment- Mobility Weighting 91 Table 44. Airlines Industry – Finance Weighting 92 Table 45. High Tech Industry – Finance Weighting 92
Table 46. Government – Finance Weighting 93
Table 47. Overall Assessment – Finance Weighting 93 Table 48. Airlines Industry – Growth Management Weighting 94 Table 49. High Tech Industry – Growth Management Weighting 94 Table 50. Government – Growth Management Weighting 95 Table 51. Overall Assessment – Growth Management Weighting 95 Table 52. Airlines Industry – Economic Prosperity Weighting 96 Table 53. High Tech Industry – Economic Prosperity Weighting 96 Table 54. Government – Economic Prosperity Weighting 97 Table 55. Overall Assessment – Economic Prosperity Weighting 98 Table 56. Airlines Industry – Environmental Stewardship Weighting 99 Table 57. High Tech Industry – Environmental Stewardship Weighting 100 Table 58. Government – Environmental Stewardship Weighting 100 Table 59. Overall Assessment – Environmental Stewardship Weighting 101 Table 60. Airlines Industry – Quality of Life Weighting 101 Table 61. High Tech Industry – Quality of Life Weighting 102
viii
Table 62. Government – Quality of Life Weighting 102 Table 63. Overall Assessment – Quality of Life Weighting 103 Table 64. Airlines Industry – Equity Weighting 104 Table 65. High Tech Industry – Equity Weighting 104
Table 66. Government – Equity Weighting 105
Table 67. Overall Assessment – Equity Weighting 105 Table 68. Airlines Industries - Overall Assessment 107 Table 69. High Tech Industries - Overall Assessment 108
Table 70. Government - Overall Assessment 109
ix
List of Figures
Page
Figure 1. Components in the Economic System 1
Figure 2. Relationship among stakeholders 2
Figure 3. Transportation and Economy 3
Figure 4. Cross Strait Air Transportation Policy history 5 Figure 5. Relationship between Air Liberalization and Economic Growth 8 Figure 6. Air Service Liberalization and its impacts 8 Figure 7. Effect of Air Service Liberalization on others Industries 9
Figure 8. Research Flow 11
Figure 9. TransAsia Airway Cross Strait Flight Routes 15
Figure 10. Cost ratio of Logistics 20
Figure 11. Shipper reaction to transportation cost 21 Figure 12. Foreign invested firm’s contribution to China’s high tech export 24
Figure 13. Taiwan Science Park 30
Figure 14. Suburban Logistics 31
Figure 15. Taiwan Science Park Revenue 37
Figure 16. Taiwan Hsinchu, South and Central Science Park employment 38 Figure 17. International and cross-Strait passenger numbers at Taiwanese airports 43 Figure 18. Cross-Strait passenger numbers and load factor 47 Figure 19. China to Taiwan airlines (seats per week, one way) 47 Figure 20. Example of Goods Air Movement from Shipper to Consumer 50 Figure 21. Taiwan fleet breakdown for on-order aircraft 52 Figure 22. Cost per available seat kilometer of major airlines in Mainland China 56 Figure 23. Cost per available ton kilometer of major airlines in Mainland China 56
Figure 24. Songshan Airport 57
Figure 25. Taipei Taoyuan International Airport passenger numbers 59 Figure 26. Taipei-Taoyuan International Airport cargo volume 59
Figure 27. A simple AHP structure 65
Figure 28. Research Framework 68
x
Figure 30. Respondent’s basic information 75
Figure 31. Questionnaire Survey Format 76
Figure 32. Thesis Research AHP Framework 76
Figure 33. Sample of Questionnaire Survey Format for Criteria 77 Figure 34. Sample of Questionnaire Survey Format for Finance sub-criteria 77
Figure 35. Analytic Hierarchy Process framework 79
Figure 36. Pairwise comparison example 79
Figure 37. Mainland China (left side) and Taiwan (right side) airlines expenses 89 Figure 38. Mainland China (left side) and Taiwan (right side) airlines revenue 91
Figure 39. Taiwan unemployment rate 97
1
Analysis of the Impact of Direct Flight Policy on Taiwanese’s Aviation Industries
I. Introduction
This thesis research studies the impact of having Direct Air Transportation Policy signed between Mainland China and Taiwan. The purpose is to determining the effects of Cross Strait air policy have on the different Taiwanese Aviation Industries. In this research study, airlines industries and high technology industries would be the aviation industries studied. In this chapter, research background would be provided for further understanding for the reader. Research motivation and objective would be given for comprehension of the intention of this thesis research. Besides, research flow would be presented.
1.1. Research Background
With the globalization and industrialization, businesses are looking for more spatial expansion of their economy, this provoke the growth of trade and as consequence increase the demand for freight transportation.
Figure 1. Components in the Economic System
Source: The Geography of Transportation System
Jean Paul Rodrigue states that the realization of production and consumption cannot occur without flows of freight within a complex system of distribution that includes, modes, terminals, but also facilities managing freight activities, namely distribution centers.
2
Production and consumption are interrelated through the conventional supply / demand relationship as shown in figure 1, Components in the Economic System.. 1
Regulation can control and/or restrict firm to develop a strong economy which mean that can lower the firm logistic productivity and as consequence can affect their customer logistic activities. Regulation is mostly the role of government. Regulation has different level such as national, state, and cities level. Hence if manufacturing firm wants to export their good to X countries, they could not do it without national public policy that allow the entry of the good to X countries. Airlines also have restriction entry to certain countries; airlines cannot to flight into those countries if there is no public policy. As well as, there are national public policies that restrict entry to others countries, inside the state and cities there are also policies that regulate the production, distribution and consumption activities. As the activities is take place in urban areas, mitigation plan exist to minimize externalities cause by economic activities. Policies restrict trade and transportation growth. Relaxing public policies would allow firms to invest in transportation and infrastructure by this way can help in the competitiveness and productivity of transportation and trade firm; this can bring a good movement growth. Surely, these economic activities would impact the land use, economy, distribution, community, environment and business.
Figure 2. Relationship among stakeholders
Source: The City Logistics paradigm for urban freight transport
The understanding of each stakeholder behavior can help to understand how a public policy would change shippers and carriers logistics system. In the relationship among
1
Jean Paul Rodrigue et al, The Geography of Transportation System, 1998. 2
CAO Report, Freight Transportation National Policy and Strategies can help Improve Freight Mobility, Jan 2008. 3 Wikipedia. February 08, 2012. <http://en.wikipedia.org/wiki/Cross-Strait_relations#Before_1949>.
3
stakeholder, each group has its own objective and tends to behave in different manners. So, if conflict between stakeholders takes place, this cause the change in other stakeholder and may strongly affect the balance of the others.
In a general way, transportation improvement can spread reductions in cost and gains in productivity through all the economic sectors that produce or distribute good. Improvement in transportation policy and/or planning can be expected to have important economic effects on carrier’s performance, shipper’s performance and the whole region economy. In freight transportation system, carriers would be the first in be benefit with public policies. Then, carriers’ improvement would impact shipper performance decision and so on. As part of the freight transportation is developed in the city and/or nearby the cities, other consideration would be taken in consideration due that will affect communities and resident living nearby these economic activities.
Figure 3. Transportation and Economy
Source: Economic Effects of Transportation: The Freight Story
Cargo movement is very important to the performance of the national economy. Many studies suggest that increases in freight volumes have strongly relation with increases in productivity and the gross domestic product. Constant development and efficient management of the nation’s transportation system such as highways, rail lines, maritime, and air are
4
important to sustaining the nation’s competitive position in the global economy. Transportation system helps to connect international gateways and intermodal facilities to retailers, producers, and consumers.2
High technology producers are increasingly reliant on air carriers from around the world. In order to increase their profitability, producers are finding global markets for the sale of their products. Additionally, to control costs, producers often relies on prompt, timely shipments of materials in small batches and have implemented inventory management systems that lower overall costs by relying on prompt shipping of needed goods, instead of more costly warehousing.
An inefficient transportation system can led to a number of adverse effects causing higher direct economic costs for carriers, producers and consumers; and higher indirect costs, such as costs that can affect the quality of life of all transportation users. Growth of transportation demand, geographic barriers, transportation policies, transportation capacities, inefficiencies infrastructure are some factor that can contribute to constrained freight mobility. In the case of Taiwan, not having an air transportation policy with Mainland China harms the efficient flow of the nation’s goods and hence affects air transportation carriers and shippers.
The particular situation of Taiwan and Mainland China dates back to the year 1949. Due to the civil war before 1949, the political relationship between Mainland China and Taiwan had been cut off and therefore their communication, transportation and trade had been affected since then. Since 1949, the relations between mainland China and Taiwan have been characterized by limited contact, tensions, and instability.3 For years, the political tension at Taiwan Strait has blocked any kind of direct air and/or maritime link for communication, transportation, postal and trade. The only ways to get to each territory side are by sea or air transportation mode; there is no road transportation mode link because Taiwan is an island located off the southeastern coast of Mainland China.4
In the absence of a direct air link between Mainland China and Taiwan, passenger flight and trade were usually made through a third parties connection link. The lack of direct air flight was the consequence of the mistrust after the Chinese Civil War. Then after the war, no direct flights were permitted between Taiwan Strait because of security concerns and to protect the sovereign of the Taiwan’s government.
2 CAO Report, Freight Transportation National Policy and Strategies can help Improve Freight Mobility, Jan 2008. 3
Wikipedia. February 08, 2012. <http://en.wikipedia.org/wiki/Cross-Strait_relations#Before_1949>. 4
5
The link between the two sides of the Taiwan Strait was routed through intermediate destinations. Passenger and cargo flight had been required to stopover in at least one transit airport before reaching to Taiwan or Mainland China. On those times, airline companies that flight Mainland China and Taiwan destination usually used Hong Kong, Macau, South Korea, Japan, or Southeast Asia countries as their intermediate destination. 5
According to Cheng Chang Lin and et al., on 2003, airlines companies that served the Taiwan-Mainland China link had their own exclusive and preferential transit airport to do a stopover before fly into Mainland China or Taiwan, as can mention:
FedEx used Subic Bay located at Philippine as its transit airport.
UPS, China Air, Cathay, and Dragon used Hong Kong as their transit at airport.
Eva Airway used Hong Kong or Macau as its transit at airport.
Figure 4. Cross Strait Air Transportation Policy history
Source: Eva Air(2012)
The economic development and the trend of global trade would make businessmen and aviation industries to claim for air transportation cross the Taiwan Strait.6 According to Mr. Chong An-Jian, airlines usually provide routes where a demand market exist otherwise they will not risk their business. On 2008, air transportation began to open progressively according to the demand market and flight restrictions were removed allowing any citizenship to take
5
Cheng-Chang Lin, The integration of Taiwanese and Chinese air networks for direct air cargo services (Elsevier Science Ltd), 633.
6
Wang Lu, Liu Yumei, Li Hongtao Zhu Yaowen, The impact of direct air transportation link cross Taiwan Strait on air passengers transportation of China mainland, Taiwan, Hong Kong and Macao (CAAC), 1.
1949- 2002 No Flight 2003 Chinese Festival Charter Fligth 2004 No flight 2005-2006 Chinese Festival Charter Fligth 2006.7.7 Passenger &Cargo Charter Fligth 2008.7.4 Weekend Charter Fligth 2008.12.15 Daily Passenger& Cargo Charter Flight 2009.8.31 Regular Passenger& Cargo Flight
6
Cross Strait flight (Wikipedia). In July 2008, Cross Strait charter flights expanded to weekends. Few months later, charter flights became daily. Then, weekly flights were established and the planes no longer had to travel through Hong Kong airspace, saving in travel times and operational cost.
Even though both of the Taiwan Strait sides have political problem, the Cross Strait trade exchange between Mainland China and Taiwan grew rapidly. There were many authors like Cheng-Chang Lin that stated that the two sides of the Taiwan Strait perform mutually dependent but complementary activities in the global manufacturing supply-chain. With the need to ease the mobility across the strait and with the growing economic ties, direct air links are inevitable.
Even before the direct air transportation agreement been signed between Mainland China and Taiwan, they were depending from each other in order to supply themselves with the different kind of commodities located at Mainland China or Taiwan market. Based on the table 1, Taiwan join more benefit with the exchange trade they have with its counterpart. This is due to the size of the market at Mainland China.
Table 1. Trade between Taiwan and China
Year Export from Taiwan to China Import to Taiwan from China Surplus
Amount Percentage Growth rate (%)
Amount Percentage Growth rate (%) 1991 6928 9.09 66.1 1126 1.79 47.1 5802 1992 9697 11.9 39.96 1119 1.55 -0.61 8578 1993 12,728 14.96 31.26 1016 1.32 -9.25 11,712 1994 14,653 15.75 15.13 1859 2.18 83.03 12,794 1995 17,898 16.03 22.15 3091 2.99 66.32 14,807 1996 19,148 16.52 6.98 3060 2.99 -1.02 16,088 1997 20,518 16.81 7.15 3915 3.42 27.96 16,603 1998 18,380 16.62 -10.42 4110 3.93 4.99 14,270 1999 21,221 17.5 15.5 4526 4.1 10.1 16,695 2000 26,162 17.6 23.3 6223 4.4 37.49 19,939
7
C.C.Lin has analyzed the supply chain between China and Taiwan, and he stated that China is a procurement market for products manufactured in Taiwan. Other reason stated by him is that China is Taiwan’s outdated machinery market. And third, he stated that Taiwan provides high technology parts for the Chinese domestic market.
Another cause that makes society claimed for direct flight, according to Chong An-Jian because of the lower labor and operational cost at Mainland China, many Taiwanese move their factories there. Usually their factories and industries center are located are located close to Jinhai area but recently because the salaries in those areas are becoming higher then industries began to move their business to the western part of china. As the western part of China only can be operated by China airlines, the Cross Strait air policy play an important role allowing airlines to form alliance and code share some route (Chong An-Jian).
In April 2009, a new agreement was created to permit cross-strait flights to become regular scheduled flights. After air liberalization and with the help of the ECFA that promote the liberation of trade between Mainland China and Taiwan, the Cross Strait Air Transportation Agreement seem to continue adding more destination point and flight frequency would increase across the Taiwan Strait.
The first step for improving air freight transportation system begins with the signing of the Cross Strait Direct Air Transportation Agreement. Immediate transportation cost reduction and travel time saving are gained by carriers and shippers. However, others effect would bring with the enhancing of transportation system.
But the enhancing of transportation system can affect positively others industries that relied on transportation for their logistics activities. Improvement in freight carriage can be expected to have important economic effect (ICF Consulting). In short, freight transportation improvement can spread reduction in cost and gains in productivity through all the economic sectors that produce or distribute good. So relaxing policies can be truly valuable contribution to the efficiency of the whole economy.
This thesis research would study the consequence that Cross Strait Air Transportation Policy has on air freight transportation system, high tech industries logistics and economy; and investigate which factors is more importance for each freight transportation stakeholders.
8
1.1. Research Motivations
China and Taiwan had no air transportation agreements mainly caused by political problems. The problem of not having air transportation policies to connect Mainland China and Taiwan affect freight transportation system and the whole economy. The constant pressure of aviation Industries has contributed with the signing of Cross Strait Air Transportation Agreement. Many literature and IATA studies state that relaxing restriction can allows airlines industries reorganize their industries and therefore let them provide better service quality to their customers.
Figure 5. Relationship between Air Service Liberalization and Economic Growth
Source: The Economic Impact of Air Service Liberalization- InterVISTAS-ga2
Figure 6. Air Service Liberalization and its impacts
Source: The Economic Impact of Air Service Liberalization- InterVISTAS-ga2 Airlines
Liberalization
Direct Impact aviation sector
Indirect Impact business and tourism
Catalytic Impact
role of air transportationin facilitating growth and productivity by increased trade,
business activity, and greater personal productivity
9
Subsequently to air carrier improvement, many literatures suggest that improvements in freight carriage can be expected to have important economic effects and that improvement in freight transportation system would bring welfare also to carrier user such as manufacturing, distribution center, wholesaler, retailer and others. Since freight transportation facilities and activities usually are located nearby the cities or in the cities, others effect will influence the society in a direct or indirect way.
Figure 7. Effect of Air Service Liberalization on other Industries
Source: Economic Effects of Transportation: The Freight Story
The motivation of studying this topic is to know how an efficient and reliable freight transportation system helps to generate improvements in economic productivity. And improvement in carrier’s services can influence in the shipper industry performance and behaviors. My personal motivation for studying this topic is with the objective of gaining more knowledge about transportation management.
Manufacturing High-Tech Industries
logistics performance
location
market demand and supply
population and employment
10
1.2. Research Objectives
The objectives of this thesis research are listed as follows:
1. Identify the problem that carrier, shipper and society have to confront in the freight transportation system. The objective is to identify how the change in behavior of one stakeholder can influence in the economic activities of the other stakeholder.
2. Investigate the effect that can provoke Direct Air Transportation Policy on carrier, shipper and society. The study would try to investigate how airlines can maximize their profit benefit when no restrictions restrict them from improving their industry logistic performance. On the other hand, by improving logistic in airlines industry how transportation would influence on manufacturing and distribution productivity and logistics.
3. Establish criteria of the effect of Direct Air Transportation Policy for carrier, shipper and society. After reviewing literature about deregulation and freight distribution system, I would try to determine if in the Cross Strait any change have been produced. 4. Determine which criteria are more important for each aviation industries stakeholder. 5. Analyze each criteria and sub-criteria degree of importance of judgment.
1.3. Research Scope and Flow
Following, the research framework is presented in order to give lectors a view about the flow of this study.
Firstly, the air Cross Strait problem and literature review would go to be review for further understanding about the Cross Strait Air Transportation situation and stakeholder desire. Then, proceed with the content analysis where the determinant point is to establish within the area of interest what are the main reason, conflict and criteria that should be taken in consideration in the study of this research about having a Cross Strait Direct Air Transportation Policy.
After depth analysis, questionnaires would be formulated for the development of survey. After gathering of data, the analysis of the effect on Taiwanese Aviation Industries would be done using the AHP approach where methodology would be described on follow chapters. Finally, the result and conclusion would be given according to the data collected by the survey.
11
Figure 8. Research Flow
Problem
Literature Review
Content Analysis
Survey
Assessment
Data Analysis
12
II. Literature Review
The literature review chapter would provide review about problem and behavior of carriers and shippers are facing. Besides, methodology literature and impact of having direct air transportation policy on aviation industries would be reviewed. This research study seeks to figure out the benefits generated by opening Cross Strait direct air transportation. Improvement in airspace-freight carriage is one of the ways that government can make a truly valuable contribution to the efficiency of national economy.
2.1. Aviation Industries Development
This research study investigate the many ways that government policy decisions have affected (or could affect) the freight system. Potential effects include shifts in freight mode as well as changes in the following: costs to freight carriers, revenues to freight carrier, costs to freight shippers, freight volumes, freight service quality, freight operations, freight system safety and freight fuel use or emissions. Public Policies can relax or restrict freight transportation of having a good logistics and therefore would impact on their services quality.
As freight transportation become faster and more reliable, hence more predictable, the flow of good and the stocking of good can be managed more efficiently. In other words, policies allow firms to reorganize their logistic and consequently can help firms to maximize profit benefits. Nadiri (1996) uses a cost function approach to estimate the relationship between capital investment and productivity in US. After reviewing some literature, many studies found that the improvement in freight transportation logistics can help increase the productivity of manufacturing, and distribution in many ways.
As mentioned in the research background, in order to be able to enter country airspace air agreement is needed between both territories. Air cargo, of course, does not operate in a vacuum. Its economic impact can be contingent on numerous factors, including the country’s overall logistics infrastructure as well as the country’s broader commercial and policy environment in which the air cargo industry operates (Doganis, 2001). John Kasarda(2005) state that three factors that enhance air cargo’s positive impact are air service liberalization, improving customs quality, and reducing corruption.
Such implementation of Airline deregulation can result in stopping government controlling fare and determining which carriers can serve which market and among other restriction depending on each country public policies. Therefore, deregulation inevitable
13
brings significant economic effects. The effect of deregulation cannot be assessed simply by comparing welfare before and after deregulation because change in key variables such as fares and profits from regulation to deregulation reflect input price changes as well as the regulatory change.
One must compare the welfare levels achieved under an actual regulatory regime with the welfare levels that would have been achieved had an alternative regulatory regime been in effect at that same time.
Steven Morrison and Clifford Winston(1986) state that users and carriers would clearly benefit from an expansion in carriers operations, although the cost, in term of potentially higher fares, would be largely borne by users.
Steven Morrison et al concluded that aviation industries is tied to capital structure created under government regulation and when it has not fully adjusted to deregulation the benefit achieved thus far should be still greater in the long term. Consequently, they advise continued vigorous pursuit of policies that promote competition in deregulation airline market.
2.1.1. Efficiency Effect on Carriers
To estimate the effect of deregulation on carrier welfare the most accurate prediction is by finance performance. Steven Morrison et al suggested a measure of carrier finance performance.
There are some benefits that airlines can gain with the implementation of public policies however is wrong to said that only with the deregulation, airlines can gain it. The deregulation roles in airlines help them to maximize the benefit. Policies would provide carriers freedom and accessibility to larger market. George William (1993) stated that some immediate welfare benefit carriers would gain are in travel time saving and operational cost saving. In response to economic freedom, airlines would react to competition. 7 Carrier can take full advantage deregulation by improvement in network by code sharing, alliance, computer reservation with other airlines, frequency flyer program, hub and spoke network, investment in advanced logistics, and their whole industries reorganization.
7
George William, The Airlines Industry and the Impact of Deregulation, 1993-1994. In response to economic freedom, airlines would react to competition.
14
Deregulation allows carriers to change the way passenger booked and acquired their ticket. On the other hand, cargo carriers would concern about the flow of information between customers, forwarder, cargo terminal and custom officer. As a result of improvement of computer reservation system and/or cargo information system, carriers could save cost and serve more market by the use of agents.
Case of Taiwan Cross Strait
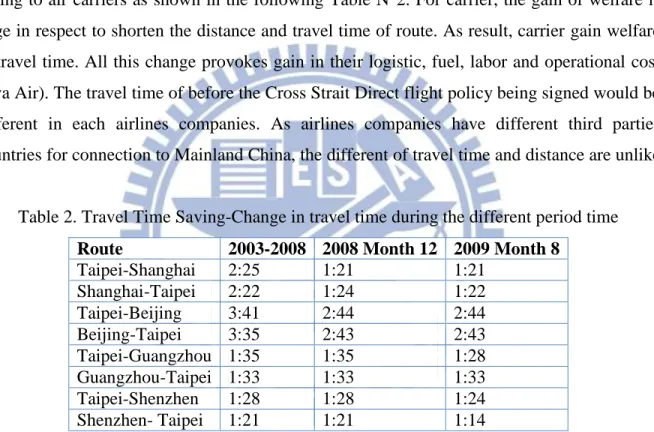
Cross Strait direct flight policy provoke immediate cost reductions and travel time saving to air carriers as shown in the following Table N°2. For carrier, the gain of welfare is huge in respect to shorten the distance and travel time of route. As result, carrier gain welfare in travel time. All this change provokes gain in their logistic, fuel, labor and operational cost (Eva Air). The travel time of before the Cross Strait Direct flight policy being signed would be different in each airlines companies. As airlines companies have different third parties countries for connection to Mainland China, the different of travel time and distance are unlike.
Table 2. Travel Time Saving-Change in travel time during the different period time
Route 2003-2008 2008 Month 12 2009 Month 8
Taipei-Shanghai 2:25 1:21 1:21 Shanghai-Taipei 2:22 1:24 1:22 Taipei-Beijing 3:41 2:44 2:44 Beijing-Taipei 3:35 2:43 2:43 Taipei-Guangzhou 1:35 1:35 1:28 Guangzhou-Taipei 1:33 1:33 1:33 Taipei-Shenzhen 1:28 1:28 1:24 Shenzhen- Taipei 1:21 1:21 1:14
Source: Eva Air (2009)
Hub and Spoke Network
Aviation industries is a very huge topic but In order to understand better about the criteria taken in consideration on the direct air agreement it is necessary to comprehend about the Airlines Network (Chang, 2003) and basic thing about this industry.
The structure of an airlines network is a result of airline route planning, which is aimed at maximizing network revenue8. As Richard Wu stated that the driving force of airline route
8
15
planning is deeply rooted in corporate revenue maximization. Therefore, the airlines network development will be an important attribute in determining the competitiveness of airlines (Lau et al.2012) by choosing good airport for airlines network, airlines can minimize operational cost and generate more profit to their corporation.
In the aviation industries, airlines can develop different kind of services offer according to their business strategies (Airport Competition, page 138). The different services that airlines can give are only passenger services, only cargo services and the combination services. The combination service is when an airline uses the belly cargo space of a passenger flight to allocate extra cargo services.
Airlines cost can be calculated by the seat load factor and weigh load factor (Lau et al.2012). There is a different between seat load factor and weigh load factor. Seat load factor is a measure of the amount of utilization of the total available capacity of a transport vehicle. It is useful for calculating the average occupancy on airlines.9 On the other hand, weigh load factor is the measure of passenger seat capacity plus the cargo capacity in the same vehicle, aircraft.
Figure 9. TransAsia Airway Cross Strait Flight Routes
Source: TransAsia Airway Website (2012)
Another interesting data about Mainland China air transportation is that the country protects their countries flag carriers and has their airport classified into national, regional and
9
16
local airport based on their connectivity to others airports (C.C. Lin). The Civil Aviation Administration of China (CAAC) decentralized the airline industry into six aviation bureaus and six corresponding airlines that serve those regions. The regions are north China (Huabei), east China (Huadong), central and south China (Huazhong and Huanan), northeast (Dongbei), southwest (Xinan) and northwest (Xibei). For each of the six regions, there is commonly more than one main airport.
In the north region, the driver of air cargo growth is due to high tech industry in Beijing and Tiajin areas. In the eastern side, air cargo growth is due to economic strength of it catchment area, the Yangtze River Delta. In the central and south region, the air cargo growth is due to the strength of industries base in Pearl River Delta, construction of new airport in Guangzhou and other logistics services facilities in the area. In the southwest region, since this region relies heavily on natural resources, faster growth is likely to boost cargo throughput. In the northwest and northeast region, the impact of air cargo is minimal due that air cargo traffic sent from the Northwest or Northeast still has to pass through Beijing.
Table 3. Major airlines regions of China
Source: Air Cargo in Mainland China and Hong Kong
After the signing of direct air policy, Taiwanese airlines and carriers are only able to touch Mainland China international airport but airport that is opened for Cross Strait activities. Otherwise, airlines and carriers need to find some Chinese airlines or carriers to help them
17
connect with others regions inside Mainland China. Thus, it is common to observed cooperation agreement as alliance and code sharing between some Mainland China and Taiwan airlines. This kind of cooperation agreements helps airlines to find more opportunities, route connection, more market share and productivity to their business.
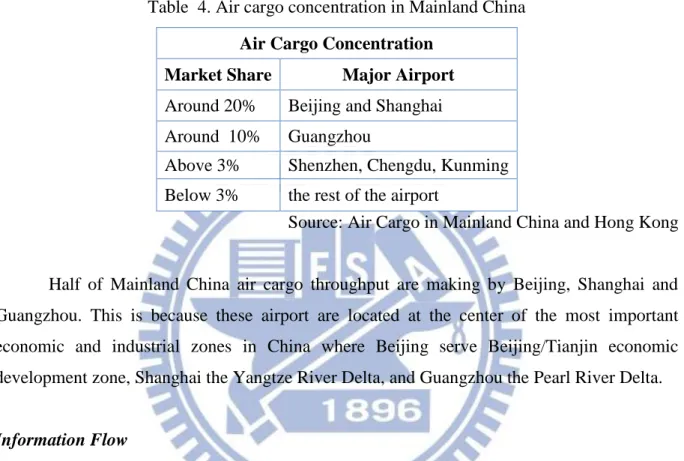
Table 4. Air cargo concentration in Mainland China
Air Cargo Concentration Market Share Major Airport
Around 20% Beijing and Shanghai Around 10% Guangzhou
Above 3% Shenzhen, Chengdu, Kunming Below 3% the rest of the airport
Source: Air Cargo in Mainland China and Hong Kong
Half of Mainland China air cargo throughput are making by Beijing, Shanghai and Guangzhou. This is because these airport are located at the center of the most important economic and industrial zones in China where Beijing serve Beijing/Tianjin economic development zone, Shanghai the Yangtze River Delta, and Guangzhou the Pearl River Delta.
Information Flow
On Mainland China, electronic customs pre-declaration using EDI is required by the Customs Bureau in major airport cities. Air cargo usually uses EPORT and RosettaNet in their cargo trading process. The Eport is an information system jointly developed by Customs General Administration of China, Ministry of Communication, Ministry of Public Security, Ministry of Foreign Trade and Economic Cooperation, and others. The Eport aims is to achieve a paperless custom declaration and clearance and for future applications are intended to cover a full range of customs services as well as electronic payment for tariffs and fees (Anming Zhang et al, 2004).
On Mainland China, there is a limited use of internet based information system services provided by agents of the air cargo for their customer. The use of electronic trading system for procurement is not yet common practice in China. The communication between airlines and forwarders are typically done through fax and phone calls. For the cargo
18
management, many airlines in Beijing and Shanghai subscribe to IT services from SITA’s Super cargo system. Through the SITA system, airline can receive master waybills and manifest from its overseas sales offices prior to flight arrival. Then, the information sent to customs through EDI for pre-declaration. In contrast, forwarder internal management is commonly computerized and inter-connected. Their related department and operation worldwide are globally connected for coordination. Most of them provide shipment tracking and tracing capabilities through internet.
Alliance and Code Sharing
Airlines alliance is a cooperation team between airlines. Cross Strait direct flight policy allows airlines from both sides to find partner who can help them with some route and business market.
Table 5. Airlines Codeshare and Alliance Groups I
Airline Codeshare Route
China Airlines Mandarin Airlines China Airlines,
Mandarin Airlines
China Eastern Airlines, China Southern Airlines, Xiamen Airlines, China Eastern Airlines
Eva Airway Uni Airlines, Air China, Shenzhen Airlines
Uni Airlines Air China, Eva Air, Hainan Airlines, Shandong Airlines, Shenzhen Airlines, Xiamen Airlines
TransAsia Airlines
Shenzhen Airline Wuxi-Taipei
TransAsia Airlines
Xiamen Airlines Kaohsiung-Fuzhou
Kaohsiung-Xiamen Taichung-Xiamen SongShan-Fuzhou
Source: Alliance Groups-Wikipedia
For example, China Airlines and China Eastern cooperate in order to enter Mainland China and Taiwan market. Ways airlines cooperate are as follow:
1. The cooperation between China and Taiwan airlines is to help the connection of flight in the domestic market inside Mainland China. For example, China airlines flight to an
19
international airport at China, but due to Mainland China domestic flight regulation that only their national carrier can serve it. Then, the cooperation allows China Eastern Airlines to make the domestic and other international flight inside Mainland China or vice versa.
2. Cooperation can help airlines make connection to others destination.
3. Another innovation in the cooperation it is the issues of their ticket. A very important step in airlines cooperation is that they can issue one ticket of different company. By this way, they are improving their services quality.
4. Cooperation can help airlines reduce cost due to that airlines can share check desk stand and VIP room at airport. By this way, airlines can minimize some cost.
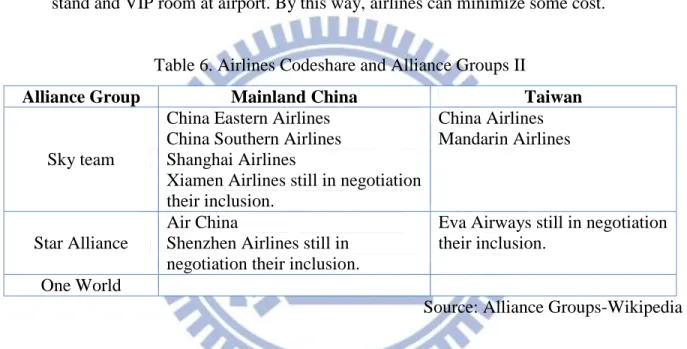
Table 6. Airlines Codeshare and Alliance Groups II
Alliance Group Mainland China Taiwan
Sky team
China Eastern Airlines China Southern Airlines Shanghai Airlines
Xiamen Airlines still in negotiation their inclusion.
China Airlines Mandarin Airlines
Star Alliance
Air China
Shenzhen Airlines still in negotiation their inclusion.
Eva Airways still in negotiation their inclusion.
One World
Source: Alliance Groups-Wikipedia
In short, the planning of airlines network is a very sensitive issues that each airlines companies need to elaborate according to their business goal, objective and strategy they want to target. There are many factors that airlines and carriers take in consideration when planning the aircraft utilization, schedules, strategies and routes. The decision for carriers of choosing their air network it is essential for all their future economic and strategic development. Emphasizing again that carriers would serves only route when a market demand is there or for strategy reason.
2.1.2. Efficiency Effect on Transportation’s User
Transportation is required in the whole production procedures, from manufacturing to delivery to the final consumers and returns. Only a good coordination between each
20
component would bring the benefits to a maximum (Yung-yu Tseng, 2005). The operation of transportation determines the efficiency of moving products. Improving in techniques and management principle can enhances the moving load, delivery speed, services quality, operation cost, usage of facilities and energy saving.
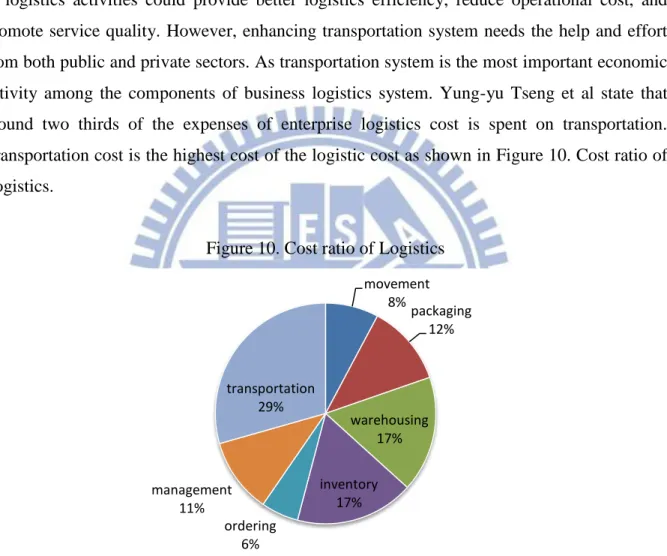
Yung-yu Tseng et al state that without well developed transportation system, logistics could not bring its advantages into full play. And besides, having a good transportation system in logistics activities could provide better logistics efficiency, reduce operational cost, and promote service quality. However, enhancing transportation system needs the help and effort from both public and private sectors. As transportation system is the most important economic activity among the components of business logistics system. Yung-yu Tseng et al state that around two thirds of the expenses of enterprise logistics cost is spent on transportation. Transportation cost is the highest cost of the logistic cost as shown in Figure 10. Cost ratio of Logistics.
Figure 10. Cost ratio of Logistics
Source: The Role of Transportation in Logistic Chain
ICF Consulting states that enhancing in freight carriage can be expected to have important economic effect on manufacturing and goods distribution. As transportation policy allows freight transportation to reorganize their industries, carrier can get lower their operational cost and/or can offer better services and/or both. This situation can bring positive
movement 8% packaging 12% warehousing 17% inventory 17% ordering 6% management 11% transportation 29%
21
effect to transportation industries by engaging more manufacture and good distribution industries.
By reducing the cost of good carriage, manufacturing, factories, and distribution point can serve a wider market. On the other hand, by reducing cost of freight transportation can change factory draw supplies from a wider area market. This reduction on freight transportation cost cans potential gain in cost and quality material and part supplying factories. Another benefit gained by transportation system, reduction in transit time and increased in their schedule reliability can attract manufacturing due that their goods can spend less time moving from origin to destination, this would help extends the reach of factory and warehouse.
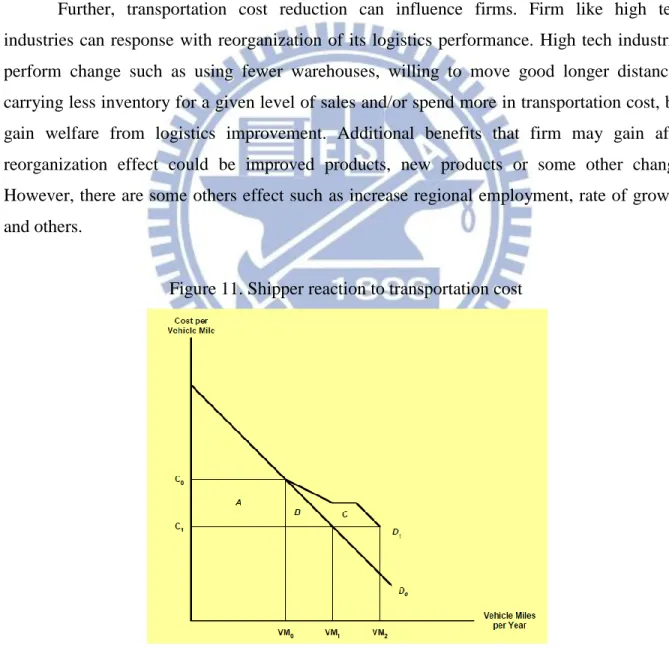
Further, transportation cost reduction can influence firms. Firm like high tech industries can response with reorganization of its logistics performance. High tech industries perform change such as using fewer warehouses, willing to move good longer distances, carrying less inventory for a given level of sales and/or spend more in transportation cost, but gain welfare from logistics improvement. Additional benefits that firm may gain after reorganization effect could be improved products, new products or some other change. However, there are some others effect such as increase regional employment, rate of growth, and others.
Figure 11. Shipper reaction to transportation cost
22
Studies of the Freight Management and Operation (USA) have determined that enhancing freight transportation system can spread reduction in cost and gains in productivity through all the economic sectors that produce or distribute goods. In short, improvement in freight carriage can be truly valuable contribution to the efficiency of the whole economy. ICF Consulting has developed study about how an improvement in transportation system influence of shipper demand for freight transportation by suing benefit and cost analysis. They state that the shipper’s demand curve for freight transportation can takes two forms, D0 and D1. In the demand curve, D0 shows a shipper’s demand for freight transportation before an improvement to the freight system. Then, D1 shows the change in demand that follows the improvement.
In their study, they suggested that the shipper’s reaction to the cost reduction can be thought of as occurring in three phases.
1. In the very short run, the shipper makes no response and continues to buy the same number of vehicle miles of freight, VM0. The benefit to the shipper is the area A, the cost reduction with the existing volume of freight.
2. In the next phase of response, the shipper takes advantage of the lower cost and buys more freight movement, VM1. This adds the area B to the benefit. But this still reflects the shipper’s original demand curve, D0. The shipper has not made any changes in the firm’s basic logistics.
3. When managers consider the cost reduction and believe that freight movement is worth to the firm then would make changes in their logistics. This is when the shipper’s demand for transportation would change, and there would be the new freight transportation demand curve, D1. The additional benefit from the reorganization is area C, the area between the old and new demand curves.
ICF Consulting states that the full benefit of freight improvement is the sum of areas A, B, and C as shown in Figure N°11. Shipper reaction to transportation cost.
Case of Taiwan Cross Strait
The flexibility of connecting Mainland China and Taiwan has brought many economic benefits to airlines, carrier, shippers and others industries that in one ways or another they have been affected with the trade and economy growth in the region. Another benefit of reducing air restriction is that Taiwanese industries take advantage of Mainland China market.
23
As market size of its counterpart is the world's most-populous country where its population of over 1.3 billion and it is the world's second-largest country by land area.10 Hence, the magnitude of the market size makes it more attractive for air carrier companies that want to join more market. The Cross Strait direct flight policy gave carrier the possibility to enter the market and compete for it. The direct air policy allows the mobility of Mainland China and Taiwan people between the Taiwan Strait. Certainly, the accessibility has increased the tourism and sightseeing destination between both sides. However, Taiwan carriers are looking farther than only have access to Mainland China. Carriers are looking forward for destination like Europe route and America route.
Besides the market size and population, there are many other benefits that Taiwanese business and others foreigner business can gain by targeting Mainland China. Benefits that foreigner business are looking in Mainland China are their lower labor cost, raw material, low price supplier and many others that can help their industries increase higher profitability. These factors contribute foreign investment firm in Mainland China. A lot of manufacturing relocated their firm to China. The labor contribution of Mainland China is more related to assemble activity than providing technology advantage. Subsequently, assembled high-tech products made an important contribution to Mainland China high tech exports.
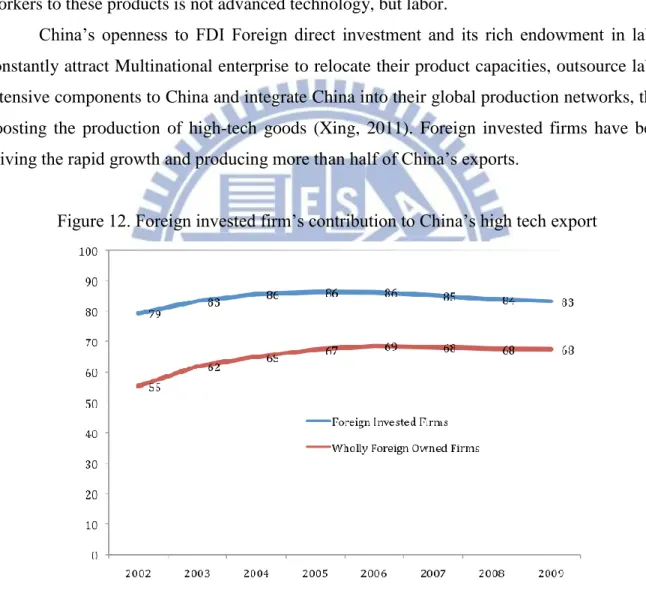
China was not a major player in the global market of high-tech products because their contribution is on resource and labor intensive products. Based on statistic, the 83% of China’s high-tech exports were attributed to foreign invested firms, in particular Taiwanese owned companies. Taiwan-IT companies have relocated 95 % of their production/assembly capacity into and transferred mainland China. This is the reason that Mainland China has so high export percentage in high tech products.
Therefore, the statistics presented by the Chinese government said that China has turned into a high-tech export giant and its high-tech exports reached US$377 billion, about 31% of China’s total exports in 2009 (Xing, 2011). There are literatures that suggest that Mainland China high tech export has little to do with technologies advancement. And suggest that Mainland China only provide assembly labor for IT products.
Studies state that 82% was processed/assembled high-tech products, mainly made of imported parts and components from industrialized economies, such as Germany, Japan, Korea, Taiwan and the US. Then, China contribute with the assembled of high-tech products
10
24
therefore their intellectual properties contribution is very small. More and more foreign firms took advantage of China’s cheap labor by relocating labor intensive segments of production chains to China and utilizing China as an export platform.
Studies stated that Mainland China’s high-tech exports actually became more labor intensive rather than capital /technology intensive. Since key parts and components in assembled high-tech products are imported and screwing these intermediate inputs into finished products requires only low skill workers. Accordingly, the contribution of Chinese workers to these products is not advanced technology, but labor.
China’s openness to FDI Foreign direct investment and its rich endowment in labor constantly attract Multinational enterprise to relocate their product capacities, outsource labor intensive components to China and integrate China into their global production networks, thus boosting the production of high-tech goods (Xing, 2011). Foreign invested firms have been driving the rapid growth and producing more than half of China’s exports.
Figure 12. Foreign invested firm’s contribution to China’s high tech export
Source: China’s High tech Export: Myth or Reality
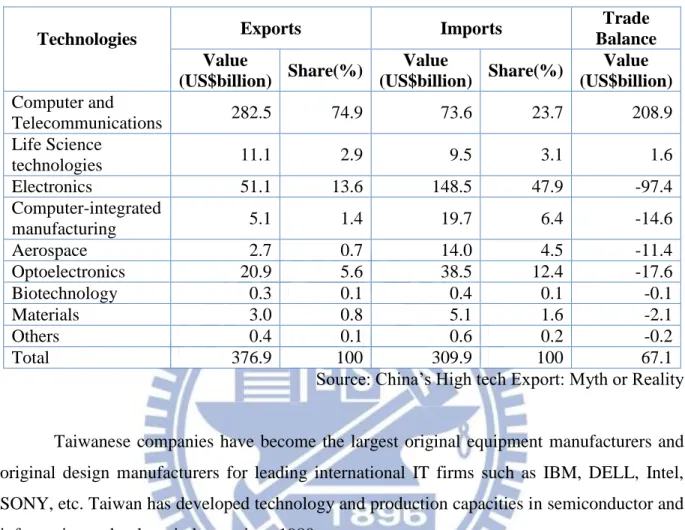
In Mainland China, most of the manufacturing investment manipulates the following high-tech products categories: computers and telecommunications, life science technologies, electronics, computer-integrated manufacturing, aerospace, optical-electronics, biotechnology, materials, and others.
25
Table 7. High Tech trade by Technologies in Mainland China
Technologies Exports Imports
Trade Balance Value (US$billion) Share(%) Value (US$billion) Share(%) Value (US$billion) Computer and Telecommunications 282.5 74.9 73.6 23.7 208.9 Life Science technologies 11.1 2.9 9.5 3.1 1.6 Electronics 51.1 13.6 148.5 47.9 -97.4 Computer-integrated manufacturing 5.1 1.4 19.7 6.4 -14.6 Aerospace 2.7 0.7 14.0 4.5 -11.4 Optoelectronics 20.9 5.6 38.5 12.4 -17.6 Biotechnology 0.3 0.1 0.4 0.1 -0.1 Materials 3.0 0.8 5.1 1.6 -2.1 Others 0.4 0.1 0.6 0.2 -0.2 Total 376.9 100 309.9 100 67.1
Source: China’s High tech Export: Myth or Reality
Taiwanese companies have become the largest original equipment manufacturers and original design manufacturers for leading international IT firms such as IBM, DELL, Intel, SONY, etc. Taiwan has developed technology and production capacities in semiconductor and information technology industry since 1980.
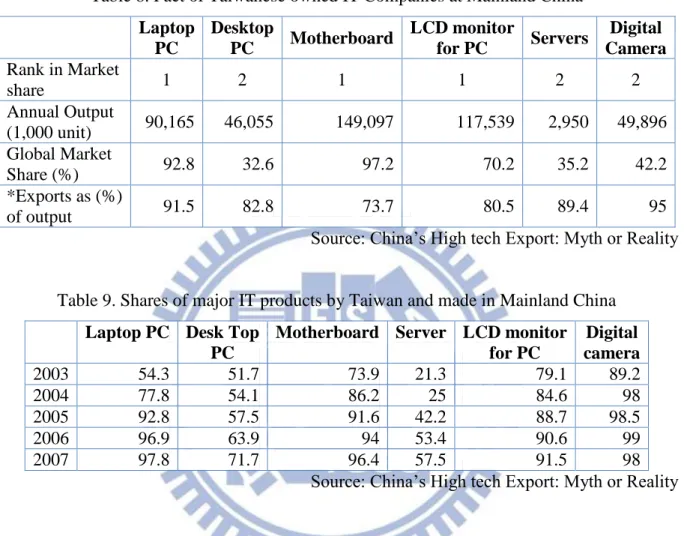
As shown in table 8. Fact of Taiwanese owned IT Companies at Mainland China, most of the high tech products are sold in markets outside of Taiwan and mainland China. Such as, 95% of digital cameras, 92% of laptops, 83% of desktop, 74% of motherboard, 80% LCD monitor and 89% of servers are exported to overseas market.
Many foreigner businesses established their manufactory and factories center at Jinhai area. Jinhai area is all the territory located near the Mainland China coast which mean that is located in the eastern side of Mainland China. The Jinhai area is serving by some airport like Shanghai, Guangzhou, Shenzhen and among others. However, because of the development and concentration of industries at the eastern side of China, the labor cost at the Jinhai area is higher than before. Consequently, manufacturer and factories strategic is moving their center to the western side of China where the cost is still low. As result of manufacturer and factories location, airlines and carriers would expand their services in order to get the new market
26
demand. As foreign investment relocating the production of their products into mainland China immediately increased the China’s output in IT products.
Table 8. Fact of Taiwanese owned IT Companies at Mainland China
Laptop PC Desktop PC Motherboard LCD monitor for PC Servers Digital Camera Rank in Market share 1 2 1 1 2 2 Annual Output (1,000 unit) 90,165 46,055 149,097 117,539 2,950 49,896 Global Market Share (%) 92.8 32.6 97.2 70.2 35.2 42.2 *Exports as (%) of output 91.5 82.8 73.7 80.5 89.4 95
Source: China’s High tech Export: Myth or Reality
Table 9. Shares of major IT products by Taiwan and made in Mainland China
Laptop PC Desk Top PC
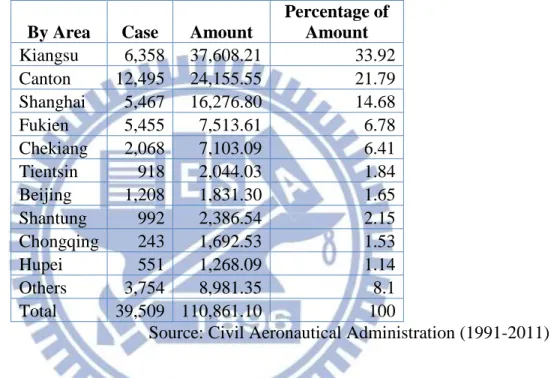
Motherboard Server LCD monitor for PC Digital camera 2003 54.3 51.7 73.9 21.3 79.1 89.2 2004 77.8 54.1 86.2 25 84.6 98 2005 92.8 57.5 91.6 42.2 88.7 98.5 2006 96.9 63.9 94 53.4 90.6 99 2007 97.8 71.7 96.4 57.5 91.5 98
Source: China’s High tech Export: Myth or Reality
At the table 9. Shares of major IT products by Taiwan and made in Mainland China represent the percentage of high tech products made by Taiwan but produced in Mainland China. As shown in the table N°1, on 2007, 98% of digital cameras were made by Taiwan were produced in its mainland China factories; 97.8% of laptop computers, 72% desktop, 96% motherboard, 57% of servers and close to 92% of LCD monitors for PC were made by Taiwan were produced in its mainland China factories.
According to Oliver Richard, the price and flight frequency can influence in customer decisions. Therefore, consumers would value the convenience of a flight schedule with multiple departure times, because they are more able to find a flight that is closer to their desired departure time. Qualities that shippers and passengers appreciate are travel time, waiting time, reliability, schedule frequency, connectivity and saving cost. The airline
27
consumer significantly values the convenience of a flight schedule with multiple departure times (Oliver Richard, 2002). Allow airlines to compete strategically and improve their services quality (Y.2 Y. Lau et al. 2012).Subsequently, carriers that can supply what customer want and need gain more market.
2.1.3. Efficiency Effect on Government Administrative cost and subsidies
A clear benefit from airlines deregulation is the reduction of administrative cost to the federal government for salaries and office space incurred under regulation.
Also, there has substantial decline in the cost of federal subsidized air services. Under regulation the government provided and continues to provide under deregulation, subsidies for essential air services, primarily to small communities.
Case of Taiwan Cross Strait
However, the political issues between Mainland China and Taiwan don’t allow minimizing some administrative expenditure. 11 Taiwan government increased their administrative cost by the creation of office for special Cross Strait relation, the Association for Relations across the Taiwan Strait (ARATS). On the other hand, Mainland China government increased creates a special office for Cross Strait relation purpose, the Straits Exchange Foundation (SEF).
And regarding subsidies, several carriers’ state that Taiwan government doesn’t provided for airlines industries.
2.1.4. Impact Studies: Generative and Distributional Effect
When government decided to release a public policy, make investment in transportation or infrastructure or allow improvement in transportation, one of the conditions mentioned or all of them can affect both economic and non economic factor in the areas proximate to the economic activities and even to those at more distant. The improvements of transportation system that influence society are complex and often indirect. The impact can be differentiating from short, medium and long run.
Preview studies suggested that any improvement in transportation system can cause productivity and national income growth. Therefore, the economic development is the result of
11