Profitability of Several
Investing Strategies
in South Korea’s
Stock Market
May 8, 2014
Sponsored by:Value Partners Center for
3 | 9 P a g e s
Profitability of Several Investing Strategies
in South Korea’s Stock Market
Introduction
This newsletter reports the performance of several investing strategies based on a stock’s quantitative measures in the South Korean stock market and how they compare with the aggregate stock market. We find that the strategy based on a stock’s book-to-market ratio provided investors with significant returns in the period from March 1984 to September 2013. The portfolio consisting of stocks with the highest book-to-market ratio outperformed the aggregate stock market in South Korea in the past 30 years.
Data
Our source of data on the daily total return index of each stock and of the South Korean equity market, and the monthly prices, total return index and market value of each stock is Datastream. We exclude exchange-traded funds (ETFs) and warrants and delete the bottom one-third of stocks in terms of market value in order to eliminate stocks that filed for bankruptcy. Our sample spans the 30-year period from March 1984 to September 2013. We consider five quantitative measures of a stock: the market capitalization (size), book-to-market ratio, idiosyncratic volatility, past one-month returns (short-term reversal) and past six-month cumulative returns (momentum).
The performance of various investing strategies
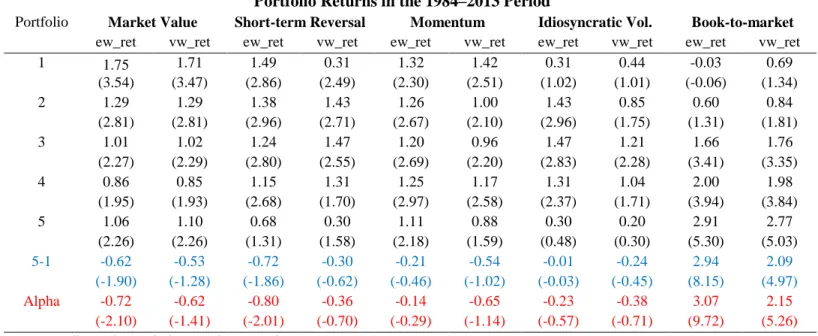
We sort stocks into five portfolios based on the above five measures at the end of each month. We calculate both the equal- and value-weighted one-month returns of each portfolio. The former is obtained by taking the simple average of the returns of all stocks in the portfolio. The latter is derived by weighting each stock’s returns based on its market capitalization. We then subtract the equal- and value-weighted returns of each portfolio from the aggregate stock market returns to obtain the outperformance of each portfolio against the South Korean stock market, namely the excess returns. We report the performance of portfolios sorted by the five measures in Table 1.
We find that the equal-weighted portfolios with low past-one-month returns and low market value significantly outperformed stocks with high past-one-month returns and high market value. The stocks with a high market ratio significantly outperformed those with a low book-to-market ratio. The zero-cost portfolios that long the stocks with the lowest past one-month returns and short the stocks with the highest past one-month returns generated returns of 0.72% and market-adjusted excess returns (alpha) of 0.80% in CAPM per month over the 1984–2013 period. Over the same period, the zero-cost portfolios that long the stocks with the smallest market value and short the stocks with the biggest market value generated returns of 0.62% and market-adjusted
4 | 9 P a g e s
excess returns (alpha) of 0.72% in CAPM per month. The zero-cost portfolios that long the stocks with the highest book-to-market ratio and short the stocks with the lowest book-to-market ratio generated returns of 2.09% and 2.94% and market-adjusted excess returns (alpha) of 2.15% and 3.07% in CAPM per month for the value- and equal-weighted portfolios over the same 30-year period.
Table 1: Returns of Various Investing Strategies for the Period from March 1984 to August 2013
Portfolio Returns in the 1984–2013 Period
Portfolio Market Value Short-term Reversal Momentum Idiosyncratic Vol. Book-to-market
ew_ret vw_ret ew_ret vw_ret ew_ret vw_ret ew_ret vw_ret ew_ret vw_ret 1 1.75 1.71 1.49 0.31 1.32 1.42 0.31 0.44 -0.03 0.69 (3.54) (3.47) (2.86) (2.49) (2.30) (2.51) (1.02) (1.01) (-0.06) (1.34) 2 1.29 1.29 1.38 1.43 1.26 1.00 1.43 0.85 0.60 0.84 (2.81) (2.81) (2.96) (2.71) (2.67) (2.10) (2.96) (1.75) (1.31) (1.81) 3 1.01 1.02 1.24 1.47 1.20 0.96 1.47 1.21 1.66 1.76 (2.27) (2.29) (2.80) (2.55) (2.69) (2.20) (2.83) (2.28) (3.41) (3.35) 4 0.86 0.85 1.15 1.31 1.25 1.17 1.31 1.04 2.00 1.98 (1.95) (1.93) (2.68) (1.70) (2.97) (2.58) (2.37) (1.71) (3.94) (3.84) 5 1.06 1.10 0.68 0.30 1.11 0.88 0.30 0.20 2.91 2.77 (2.26) (2.26) (1.31) (1.58) (2.18) (1.59) (0.48) (0.30) (5.30) (5.03) 5-1 -0.62 -0.53 -0.72 -0.30 -0.21 -0.54 -0.01 -0.24 2.94 2.09 (-1.90) (-1.28) (-1.86) (-0.62) (-0.46) (-1.02) (-0.03) (-0.45) (8.15) (4.97) Alpha -0.72 -0.62 -0.80 -0.36 -0.14 -0.65 -0.23 -0.38 3.07 2.15 (-2.10) (-1.41) (-2.01) (-0.70) (-0.29) (-1.14) (-0.57) (-0.71) (9.72) (5.26)
Note: Adjusted t-statistics are in parentheses
Performance against the aggregate stock market
We also investigate the performance of these investing strategies against the aggregate South Korean stock market. The investment started in January 1987 when the total market return index became available in Datastream. As shown in Table 2, we find that the equal-weighted portfolio with the highest book-to-market ratio significantly outperformed the aggregate stock market by 1.45% per month in the 1987–2013 period while the other investing strategies did not. The value-weighted portfolio with the highest book-to-market ratio also significantly outperformed the aggregate stock market by 2.04% per month on average over the same period.
5 | 9 P a g e s Table 2: Excess Returns of Various Investing Strategies for the Period from October 1987 to August 2013
Excess Returns in the 1987–2013 Period
Portfolio Market Value Short-term Reversal Momentum Idiosyncratic Vol. Book-to-market
ew_ret vw_ret ew_ret vw_ret ew_ret vw_ret ew_ret vw_ret ew_ret vw_ret
1 0.43 0.39 0.20 -0.04 -0.06 0.09 -0.75 -0.62 -1.47 -0.71 (0.96) (0.88) (0.49) (-0.13) (-0.14) (0.23) (-2.28) (-2.71) (-4.37) (-3.64) 2 0.09 0.09 0.13 0.07 -0.04 -0.30 0.37 -0.21 -0.54 -0.26 (0.23) (0.23) (0.39) (0.26) (-0.12) (-1.09) (1.19) (-0.99) (-1.71) (-1.25) 3 -0.33 -0.33 0.03 0.00 -0.08 -0.30 0.41 0.15 0.40 0.52 (-0.95) (-0.96) (0.08) (0.01) (-0.24) (-1.24) (1.20) (0.56) (1.25) (2.28) 4 -0.42 -0.43 -0.10 -0.51 0.10 -0.02 0.25 -0.02 0.79 0.65 (-1.39) (-1.44) (-0.29) (-1.61) (0.29) (-0.10) (0.65) (-0.04) (2.29) (2.30) 5 -0.21 -0.14 -0.62 -0.37 -0.28 -0.59 -0.76 -0.86 1.63 1.45 (-1.09) (-0.68) (-1.55) (-1.05) (-0.70) (-1.68) (-1.68) (-1.85) (4.26) (4.53) 5-1 0.42 0.53 0.24 0.73 0.84 0.38 1.05 0.82 2.04 1.10 (0.60) (0.69) (0.38) (1.00) (1.31) (0.51) (1.30) (1.01) (3.53) (1.69) Note: Adjusted t-statistics are in parentheses
The $1 investment cumulative payoff of five investing strategies
In Figure 1, we examine the cumulative payoff in dollar terms of investing $1 in the portfolios having the lowest values of past-one-month returns (short-term reversal), market capitalization, and idiosyncratic volatility and the highest values of book-to-market ratio and past-six-month returns (momentum) with monthly portfolio rebalancing. We also compare this payoff with the cumulative payoff from a $1 investment in the aggregate stock market. We find that the investing strategies based on a stock’s short-term reversal, momentum, market capitalization, idiosyncratic volatility and book-to-market ratio grew a $1 dollar investment into $11.34, $3.28, $27.28, $1.69, and $891.60 respectively in the 1987–2013 period, while the aggregate stock market turned $1 into $8.20 in the same period. This demonstrates that the investing strategy based on the book-to-market ratio dramatically outperformed the South Korean stock book-to-market. The effective monthly average returns of these investing strategies are 1.26%, 0.78%, 1.49%, 0.31% and 2.69% while the aggregate stock market managed 1.06%. These figures show that small stocks are also capable of outperforming the market, although not significantly so as shown in Table 2. The investing strategy based on the book-to-market ratio, which is a value measure, outperformed the aggregate market considerably both economically and statistically in this period.
6 | 9 P a g e s Figure 1. Cumulative Payoff of $1 Invested in South Korea’s Total Market Index and in Portfolios with the Lowest
Values of Past-one-month returns (Short-term Reversal), Market capitalization, and Idiosyncratic Volatility and the Highest Values of Book-to-Market ratio and Past-six-month returns (Momentum) with Monthly Portfolio Rebalancing in South Korea’s Stock Market.
Conclusion
The investing strategy based on the book-to-market ratio generated exceptional returns for investors in South Korea’s stock market in the 1984–2013 period. This value investing strategy also outperformed the aggregate stock market appreciably in that period. In the next newsletter, we will investigate whether other value investing strategies can also outperform the aggregate stock market and reward investors with attractive returns.
7 | 9 P a g e s
About Value Partners Center for Investing (http://vpcenter.ust.hk/)
The Value Partners Center for Investing of the Hong Kong University of Science and Technology Business School is an academic and intellectual center supporting research and training on investing with an
emphasis on China and Hong Kong financial markets. It aims to promote Hong Kong's role as the regional asset management center. The center is sponsored by Value Partners Group Limited.
About Value Partners Group Limited (http://www.valuepartners.com.hk/en/home.html)
Value Partners is one of Asia’s largest asset management firms. Since its establishment in 1993, Value Partners has been a dedicated value investor with a focus on the Greater China region. The Group manages absolute return long-biased funds, long-short hedge funds, exchange-traded funds, quantitative funds, and private equity funds for institutional and individual clients in Asia Pacific, Europe and the United States.
Author Contact Information
Dr. Samuel Xin Liang Associate Director
Value Partners Center for Investing Tel: +852 2358 8204
Mobile: +852 9175 8951 Fax: +852 2358 1749 Email: [email protected]
Supporting Researchers: Ms. Cheuk, Man Yin Ms. Fang, Lei