國立交通大學
材料科學與工程學系
博士論文
層狀二維材料製備-由電漿電化學製備石墨氧化物、
石墨烯及由焠火製備奈米片狀二硫化鉬
Production of two-dimensional layered materials-graphite
oxide and graphene by plasma electrochemistry and MoS
2nanosheets by quenching method
姓 名 :
鄧文成
指導教授 :
韋光華
國立交通大學
National Chiao Tung University
博士論文
Doctoral Dissertation
層狀二維材料製備-由電漿電化學製備石墨氧化物、
石墨烯及由焠火製備奈米片狀二硫化鉬
Production of two-dimensional layeredmaterials-
graphite oxide and grapheneby plasma electrochemistry
and MoS
2nanosheets by quenching method
系 所 :
Department of Materials Science and Engineering
學 號 :
9818843
姓 名 :
DANG VAN THANH
指導教授 :
Prof. KUNG-HWA WEI
層狀二維材料製備-由電漿電化學製備石墨氧化物、
石墨烯及由焠火製備奈米片狀二硫化鉬
Production of two-dimensional layered materials-graphite
oxide and graphene by plasma electrochemistry and MoS
2nanosheets by quenching method
研究生: Dang Van Thanh Student: Dang Van Thanh
指導教授: 韋光華 Advisor: Prof. Kung-Hwa Wei
國立交通大學 材料科學與工程學系
博士論文 A thesis
Submitted to Department of Materials Science and Engineering College of Engineering
National Chiao Tung University in partial Fulfillment of Requirements for the Degree of Doctor of Philosophy
in
Materials Science and Engineering
April 2014
Hsinchu, Taiwan, Republic of China
Abbreviations
HOPG: highly ordered pyrolytic graphite GE: recycled graphite
HG: high purity graphite CP: cathodic plasma process VPE: vapor plasma envelope EG: expandable graphite
PEGO: plasma-expanded graphite oxide
PEEG: Plasma electrochemically exfoliated graphene DI: deionized water
EPEGO: exfoliated PEGO NMP: N-methyl-2-pyrrolidone MB: Methylene Blue
GSs: Graphene sheets
MoS2-DI: Exfoliation of solution of MoS2 in DI water, without quenching.
MoS2-DIQ: Exfoliation of solution of MoS2 in DI water, with quenching.
MoS2-KOH: Exfoliation of solution of MoS2 in aqueous KOH, without quenching.
i
Table of Contents
Abstract ... III Acknowledgment ... VI Figure List ... VII Table List ... XI
Chapter 1: Introduction ... 1
Chapter 2: Overview of electrochemical exfoliation and plasma electrolysis 4 2-1 Introduction to graphene ... 4
2-2 Electrochemical approaches to produce graphene ... 5
2-3 Cathodic plasma electrolysis (CPE) to produce nano-materials ... 10
2-4. Solution-based exfoliation approach to produce MoS2 ... 12
Chapter 3: Plasma electrolysis allows the facile and efficient production of graphite oxide from recycled graphite ... 14
3.1 Introduction ... 14
3.2 Experimental ... 17
3.2.1 Preparation of PEGO and PEHGO ... 17
3.2.2 Preparation of EPEGO ... 20
3.2.3 Adsorption of MB on PEGO ... 20
3.2.4 Measurements and Characterization ... 21
3-3. Results and discussions ... 21
3-4 Conclusions ... 35
Chapter 4: Plasma-assisted electrochemical exfoliation of graphite for rapid production of graphene sheets ... 37
4-1 Introduction ... 37
4-2 Experimental ... 38
4-2.1Preparation of plasma- electrochemically exfoliated graphene (PEEG) ... 40
ii
4.2.3 Measurements and Characterization ... 40
4-3 Results and discussions ... 41
4-4 Conclusions ... 53
Chapter 5: The influence of electrolytic concentration on morphological and structural properties of plasma-electrochemically exfoliated graphene ... 54
5-1 Introduction ... 54
5-2 Experimental ... 55
5.2.1 Preparation of plasma- electrochemically exfoliated graphene (PEEG) ... 56
5-2-2 Preparation of PEEG dispersion ... 56
5.2.2 Measurements and Characterization ... 56
5-3 Results and discussions ... 57
5-4 Conclusions ... 64
Chapter 6: Production of few-layer MoS2 nanosheets through exfoliation of liquid N2–quenched bulk MoS2 ... 65
6-1 Introduction ... 65
6-2 Experimental ... 67
6.2.1 Preparation of exfoliated MoS2nanosheets ... 67
6-2-2 Preparation of MoS2 dispersion ... 67
6.2.3 Measurements and Characterization ... 68
6-3 Results and discussions ... 68
6-4 Conclusions ... 79
Chapter 7: Conclusion and outlook for future ... 80
References ... 84
iii
Abstract
The purpose of this work is to find out new approaches for one-pot synthesis of graphite oxide and graphene by plasma electrochemical exfoliation of graphite in a basic electrolyte solution in a short-reaction time with regards of environmental friendliness, energy/time saving, and low cost. First of all, we adopted a highly efficient cathodic plasma (CP) process in which the vapor plasma envelope calorific effect provides instant oxidation and expansion of graphite for producing plasma-expanded graphite oxides (PEGOs) from recycled graphite electrodes (GEs) or high purity graphite (HG), within a reaction time of 10 min without the need for strong oxidants or concentrated acids. X-ray diffraction, X-ray photoelectron spectroscopy and Raman spectroscopy confirmed the dramatic structural change from GEs or HG to graphite oxides after the CP process. Furthermore, scanning electron microscopy and transmission electron microscopy revealed that the graphite oxide possessed a spheroidal morphology, with dimensions of 1–3 µm, as a result of melting and subsequent quenching during the plasma electrolysis process. We obtained a stable, homogeneous dispersion of PEGOs in N-methyl-2-pyrrolidone after sonication and filtering of the centrifuged PEGOs. We used these spheroidal graphite oxide particles as effective adsorbents for the removal of pollutants (e.g., Methylene Blue) from aqueous solutions. These PEGOs also served as good precursors for the preparation of graphite nanopletets.
iv
Sequently, we have demonstrated a new and highly efficient plasma-assisted electrochemical exfoliation method, involving a plasma-generated graphite cathode and a graphite anode, for the production of graphene sheets from electrodes in a basic electrolyte solution in a short reaction time. The AFM images revealed a lateral dimension of approximately 0.5–2.5 µm and a thickness of approximately 2.5 nm, corresponding to approximately seven layers of graphene, based on an interlayer spacing of 0.34 nm. Additively, the influence of electrolytic concentration on morphological and structural properties of plasma-electrochemically exfoliated graphene is investigated and presented. Finally, we developed an efficient solution-based method for the production of few-layer MoS2
nanosheets through exfoliation of bulk MoS2 compounds that were subject to
quenching in liquid N2 and subsequent ultrasonication. AFM images of individual
nanosheets revealed that the thickness varied from 1.5 to 3.5 nm and the lateral dimensions from 0.5 to 3.5 µm.
v 摘要: 此實驗的目的是要找出在相對基本的電解液中,能夠快速用電漿電化學剝離法製 造出石墨氧化物及石墨烯並且達到對環境友善、節省能源及時間與低成本的效果。首先, 我們在回收的石墨電極或高純度石墨採用高效率陽極電漿法以蒸汽熱電漿反應對石磨 產生即時氧化及擴張隨後產出展開電漿石墨氧化物,而此法可在不需要強氧化劑或高濃 酸的條件下,十分鐘的反應時間內完成。X-RAY 繞射分析、X-RAY 光電子圖譜或拉曼 圖譜可檢測出在經過陽極電漿法後,從石墨電極或高純度石墨到石磨氧化物的劇烈結構 改變。此外,掃描式電子顯微鏡與穿透式電子顯微鏡更可顯示出石墨氧化物擁有類似圓 球狀的型態,範圍尺度在 1-3μm 間,這是在電漿電解法中融化並隨後冷卻的結果。聲裂 法及離心過濾石墨氧化物後,我們得到在 N-甲基吡咯烷酮中有穩定且同質均勻分布的 展開石墨氧化物。應用上可將類圓球狀的石墨氧化物當作強吸收劑用來去除水溶液中的 髒汙(例如:亞甲基藍)。他也是個好的製造石墨奈米小板之前驅物。隨後,我們也說明如 何由石墨陰陽極電漿電解剝離法在短時間內與簡單電解液的條件下產出石墨烯。原子力 顯微鏡影像顯示出,橫向尺度大約 0.5-2.5μm 及厚度約 2.5nm,相當於七層石墨烯(每層 約 0.34nm)的厚度。最後,我們研究電解液的濃度如何影響電漿電化學剝離石墨烯的表 面形態及結構最後我們發展出一個高效率液相製法使用 N2將塊狀 MoS2製備成MoS2
nanosheets,由 AFM 的圖可以看出分開的 MoS2 nanosheets 的厚度由 1.5 nm ~3.5 nm 且
vi
Acknowledgment
First and foremost, I gladly acknowledge my debt to Prof.Kung-Hwa Wei. Without his constant friendship, generous encouragement and concise advice, this thesis would never have been completed. Additionally, I am grateful to Prof. Chih-Wei Chu, Prof. Lain-Jong Li, and Prof. Yao-Jane Hsu because they kindly gave me much comments and suggestions relating to my research direction. I would also especially like to recognize Prof. Chih-Wei Chu for permitting me to use his facilities and equipment.
I would also like to thank Dr. Jian-Ming Jiang, Mr. Hsiu-Cheng Chen, and Mr. Chien-Chung Pan. They kindly taught me all of equipment in my lab and helped order facilities, and chemicals equipment for my research setup. Four years ago, when I started Ph.D. program, my life in the Taiwan was complicated by language and cultural differences. Many people have helped me in the course of my research, and any merit on its behalf is in large measure due to them.
Finally, special thanks go to my parents, my wife, and my son. Your love always made it possible for me to go through tough trails. Thank you for being there, smiling at me with love, good days or bad days
Dang Van Thanh Hsinchu, Taiwan March 2014
vii
Figure List
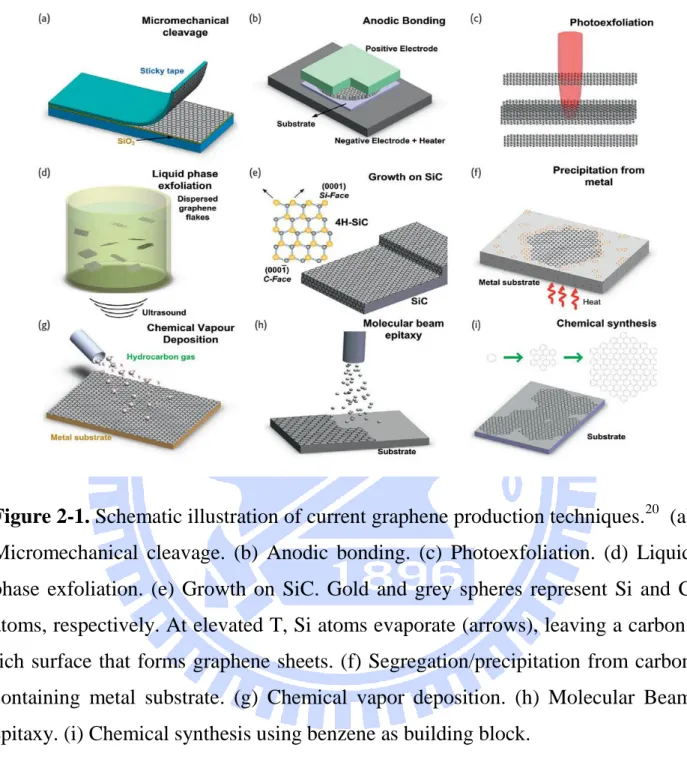
Chapter 1: Introduction ... 1 Chapter 2: Overview of electrochemical exfoliation and plasma electrolysis ... 4 Figure 2-1. Schematic illustration of the main graphene production techniques. (a)
Micromechanical cleavage. (b) Anodic bonding. (c) Photoexfoliation. (d) Liquid phase exfoliation.(e) Growth on SiC. Gold and grey spheres represent Si and C atoms, respectively. At elevated T, Si atoms evaporate (arrows), leaving a carbon-rich surface that forms graphene sheets. (f) Segregation/precipitation from carbon containing metal substrate. (g) Chemical vapor deposition. (h) Molecular Beam epitaxy. (i) Chemical synthesis using benzene as building block. ... 5
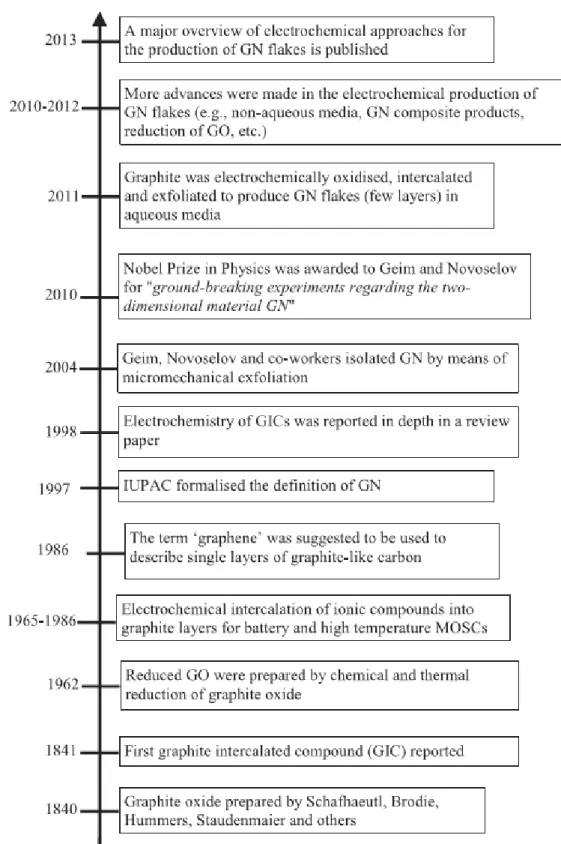
Figure 2-2. Timeline for the development of GN using electrochemical technique.
... 7
Figure 2-3. Schematic of the apparatus for synthesis of GN via electrolytic
exfoliation . ... 9
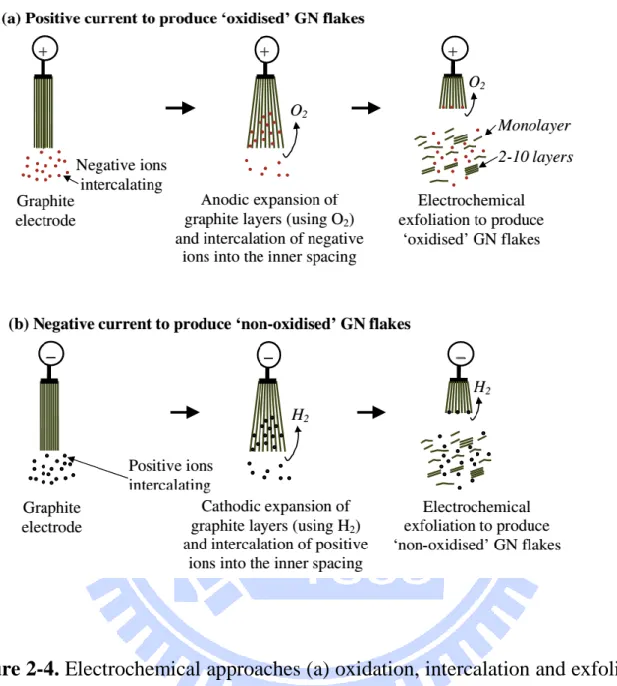
Figure 2-4. Electrochemical approaches (a) oxidation, intercalation and exfoliation
(negative ions are shown in red colour) and (b) reduction, intercalation and exfoliation to produce single and multilayer GN flakes. ... 10
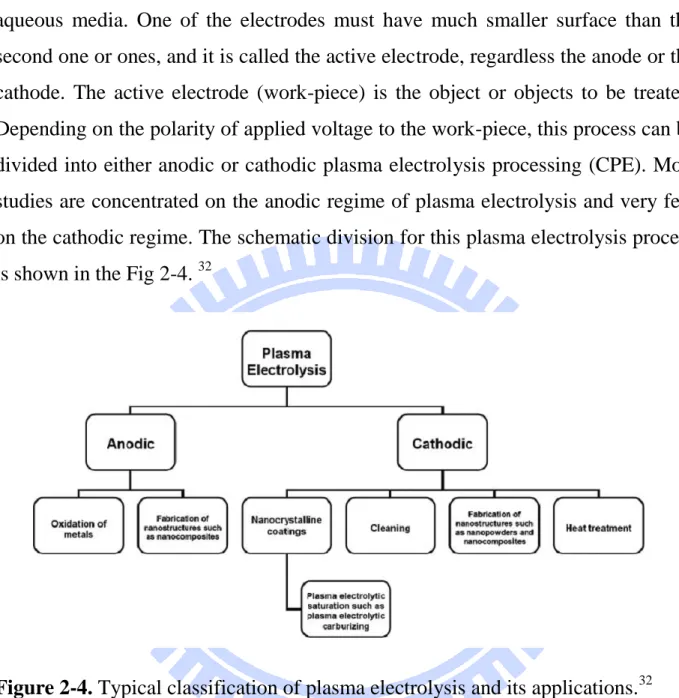
Figure 2-5. Typical classification of plasma electrolysis and its applications. ... 11 Chapter 3: Plasma electrolysis allows the facile and efficient production of graphite oxide from recycled graphite. ... 14 Figure 3-1. Schematic representation of the equipment used for the CP process
combined with ultrasonic vibration. ... 19
Figure 3-2. (a) X-ray diffraction patterns of the GE, PEGO, and EPEGO samples,
(b)X-ray photoelectron spectroscopy of C1s signal of PEGO, (c) XRD patterns of the HGO, HPEGO samples, and (d) X-ray photoelectron spectroscopy of C1s signal of HPEGO. ... 22
viii
Figure 3-3. SEM images of the (a) GE, (b) PEGO, and (c) EPEGO samples; insets:
high-magnification images. ... 25
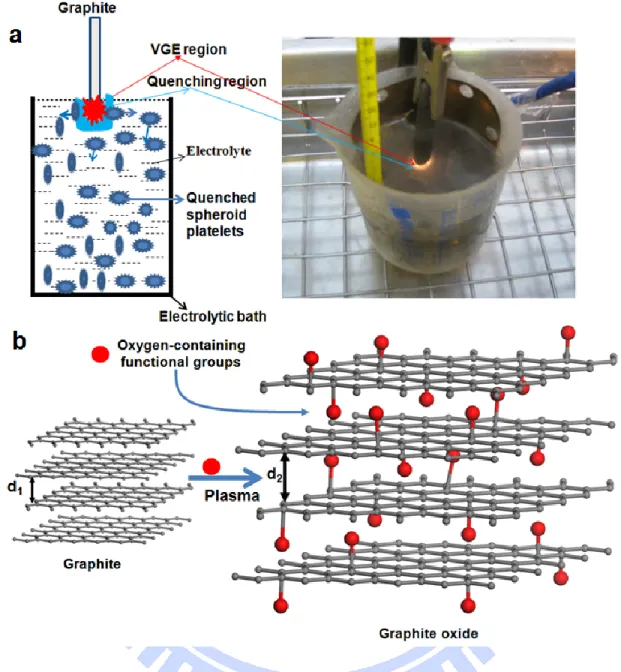
Figure 3-4. (a) Mechanism of formation of PEGO and digital image of VPE. ... 27
(b) Mechanism of plasma-mediated expansion of GE. ... 27
Figure 3-5. TEM images of (a) GE, (b) HG, (c) PEGO, and (d) HPEGO; ... 29
insets: corresponding SAED pattern. ... 29
Figure 3-6. (a) AFM image of a nanoplatelet of EPEGO deposited on a Si/SiO2 substrate. (b) Line scan height profile of the sample in (a). (c) HRTEM image of an EPEGO nanoplatelet; inset: corresponding SAED pattern. ... 30
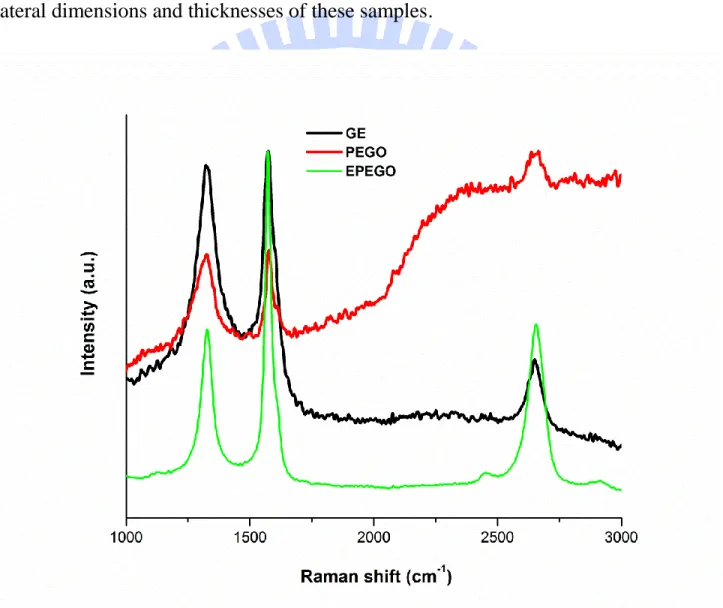
Figure 3-7. Raman spectra of the GE, PEGO, and EPEGO samples. ... 31
Figure 3-8. Photograph of (a) the dispersion of PEGO in the electrolytic solution, (b) the sample obtained after filtering the sample in (a) through PVDF (pore size: 0.2 µm) and re-dispersion in NMP, (c) the sample obtained after ultrasonication of the sample in (b), and (d) the centrifuged dispersion of PEGO in NMP. ... 33
Figure 3-9. UV–Vis spectra of MB solutions in the (red) presence and (black) absence of PEGO; inset: photograph of the (left) original MB solution and (right) MB-adsorbed PEGO solution. ... 34
Chapter 4: Plasma-assisted electrochemical exfoliation of graphite for rapid production of graphene sheets. ... 37
Figure 4-1. (a) Schematic representation of the equipment used for PEEG. (b–e) Photographs of (b, c) the electrolytic solution (b) before and (c) after plasma-assisted electrochemical exfoliation process; (d) the PEEG-based graphene film prepared through vacuum filtering of the electrolyte after plasma-assisted electrochemical exfoliation process; and (e) a dispersion of PEEG in an NMP solution. ... 41
Figure 4-2. (a) XRD patterns and (b) Raman spectra of HG and PEEG and (c, d) XPS spectra (C 1s signal) of (c) HG and (d) PEEG. ... 42
ix
Figure 4-3. (a, c) SEM and (b, d) TEM images of (a, b) HG and (c, d) PEEG. ... 45 Figure. 4-4. (a) SEM images of flattened or scrolled PEEG (b, c, d)
high-magnification images; Two arrows pointing in opposite directions indicate the thickness of PEEG that was on the surface of the Si/SiO2 substrate. ... 46
Figure. 4-5. TEM images of flattened or scrolled PEEG, inset: corresponding
SAED pattern. Two arrows pointing in opposite directions indicate the thickness of PEEG that was on the top of the copper grid... 47
Figure 4-6. AFM images and height profile of a PEEG sample deposited on a
Si/SiO2 substrate. ... 48
Figure 4-7. (a) SEM high-magnification and (b) TEM images of electrochemically
exfoliated graphene sheets (EEG), (c) Raman spectra of EEG, and (d) AFM image and height profile of a EEG sample deposited on a Si/SiO2 substrate. ... 49
Figure 4-8. Proposed mechanisms for the formation of PEEG. ... 51 Chapter 5: The influence of electrolytic concentration on morphological and structural properties of plasma-electrochemically exfoliated graphene. ... 52 Figure 5-1. Raman spectra of HG and PEEG at various concentrations ... 57 Figure 5-2. SEM images of the (a) PEEG5, (b) PEEG 10, (c) PEEG 15, and (d)
PEEG 20 ... 59
Fig. 5-3. TEM images of the (a) PEEG5, (b) PEEG 10, (c) PEEG 15, and (d)
PEEG 20 ... 60
Figure 5-4. AFM images of the (a) PEEG5, (b) PEEG 10, (c) PEEG 15, and (d)
PEEG 20 ... 61
Figure 5-5. XPS spectra C 1s signal of (a) HG, (b) PEEG5, (c) PEEG 10, (d)
x
Chapter 6: Production of few-layer MoS2 nanosheets through exfoliation of
liquid N2–quenched bulk MoS2 ...68
Figure 6-1. Raman spectra of bulk MoS2 and exfoliated MoS2 nanosheets processed using the liquid N2–exfoliation process ... 72
Figure 6-2. AFM image and height profile of MoS2 samples processed from a dispersion of exfoliated MoS2. ... 73
Figure 6-3. TEM image of a MoS2 sample processed from a dispersion of exfoliated MoS2; inset: SAED pattern and EDS spectrum of the in situ–recorded area. The Cu signal arose from the TEM support grid ... 74
Figure 6-4. Suggested mechanism for the formation of exfoliated MoS2 through quenching and exfoliation processes. ... 75
Figure 6-5. Raman spectra of raw MoS2 (bulk MoS2) and exfoliated MoS2 samples processed from solutions of MoS2 in DI water and aqueous KOH. ... 78
Figure 6-6a. AFM images and height profiles of MoS2-DI. ... 79
Figure 6- 6b. AFM images and height profiles of MoS2-KOH. ... 80
Figure 6-6c. AFM images and height profiles of MoS2-DIQ. ... 81
xi
Table List
Chapter 3: Plasma electrolysis allows the facile and efficient production of graphite oxide from recycled graphite. ... 14 Table 3-1. The relative atomic percentage of various functional groups in PEGO
and HPEGO estimated based on the area under the C 1s peaks. ... 24
Chapter 4: Plasma-assisted electrochemical exfoliation of graphite for rapid production of graphene sheets. ... 37 Table 4-1. Relative atomic percentages of carbon atoms in various functional
groups in HG and PEEG, estimated based on the areas under the C 1s peaks. ... 44
Table 4-2. Comparison between graphene sheets produced with plasma-assisted
and conventional electrochemical exfoliation methods. ... 50
Chapter 5: The influence of electrolytic concentration on morphological and structural properties of plasma-electrochemically exfoliated graphene. ... 54 Chapter 6: Production of few-layer MoS2 nanosheets through exfoliation of
liquid N2–quenched bulk MoS2 ... 65
1
Chapter 1: Introduction
Graphene (GNs), a single layer of carbon atoms bound together in a hexagonal lattice (i.e., a two-dimensional form of graphite),1 has many potential applications in, for example, energy-storage materials,2-6 polymer composites,7-9 transparent conductive electrodes,10-13 memory devices,14-16 and sensors.17-20 To meet the demand, large-scale production of graphene is required. Several methods have been developed for the preparation of GNs, such as: electrochemical exfoliation,21,22 arc discharging,23,24 mechanical milling 25,26, expanded graphite-based exfoliation 8,27-30 and chemical reduction of exfoliated graphite oxide (GO).31-34 Among these methods, chemical oxidation of graphite, conversion of the resulting graphite oxide to graphene oxide, and the subsequent reduction of graphene oxide is widely considered as one of most commonly approach for the large-scale production of GNs. Unfortunately, the mixtures of strong oxidants and concentrated acids, which is used to prepare GOs, are highly toxic and dangerously unstable, so extra safety precautions are required.35,36 In addition, the GO production via oxidation of graphite usually consumes long time. Therefore, an alternative approach for producing GO or graphene from available graphite-based sources with simple, low cost equipments and rapid throughput processing are highly desirable. The key for such a process is the exfoliation of graphite via fast and controlled electrochemical exfoliation of graphite. In fact, electrochemical exfoliation of graphite has been reported to be a green and cost-effective approach for producing graphite oxides and high-quality few-layer graphene flakes in high yield using simple equipment. Cui et al.37 reported the preparation of graphite oxide nanoparticles and graphene by electrochemical oxidation of graphite anode in deionized water at galvanostatic mode. These facts suggest that it is possible to
2
disaggregate graphite into graphite oxide or individual graphene sheets using controlled electrochemical exfoliation approach.
In this dissertation, a new and highly efficient plasma electrochemical exfoliation method will be described consisting of a plasma-generated graphite cathode and a stainless steel anode or graphite anode for the production of graphite oxide or graphene sheets. The purpose of this work is to find out new approaches for one-pot synthesis of graphite oxide and graphene by the plasma electrochemical exfoliation of graphite in a basic electrolyte solution in a short-reaction time with regards of environmental friendliness, energy/time saving, and low cost. In addition, we also demonstrate a new and simple solution-based method for the production of few-layer MoS2 nanosheets through exfoliation of
bulk MoS2 compounds through quenching in liquid N2.
After the introduction, a brief overview of methods for preparation of graphene, particularly the electrochemical method and plasma electrolysis processing, is presented in chapter 2. Chapter 3 describes our proposed method to synthesize graphite oxide using plasma electrolysis. The oxidized mechanism of graphite into graphite oxide will be discussed. The as-synthesized graphite oxide produced through this process is demonstrated as an effective adsorbent for a removal of Methylene Blue from aqueous solutions and can serve as a suitable precursor for the preparation of graphite nanoplatelets. Chapter 4 contains a highly efficient and green method for the production of graphene sheets from both graphite electrodes in a basic electrolyte solution through an electrochemical process involving a plasma-generated graphite cathode. The influence of electrolytic concentration on morphological and structural properties of plasma-electrochemically exfoliated graphene is investigated and presented in chapter 5. Chapter 6 develops and applies further the exfoliated mechanism in chapter 3-4 for
3
the production of few-layer MoS2 nanosheets through exfoliation of bulk MoS2
compounds through quenching in liquid N2. Finally, the features of this
4
Chapter 2: Overview of electrochemical exfoliation and plasma electrolysis 2-1. Introduction to graphene
Graphene (GNs), a single layer of carbon atoms bonded together in a hexagonal lattice or two-dimensional graphite, has recently emerged as a rising star in materials science. The excellent properties of graphene were reported by high values of its Young’s modulus (~ 1100 GPa), fracture strength (125 GPa) [1],1
thermal conductivity (~ 5000 W m-1 K-1),2 mobility of charge carriers (200 000 cm2 V-1 s-1) [3]3 and specific surface area (2630 m2 g-1) [4].3,4 Several methods have been developed for preparing graphene sheet since it was firstly isolated by Novoselov and Geim using Scotch tape in 2004, such as: electrochemical exfoliation,5,6 arc discharging,7,8 mechanical milling 9,10, expanded graphite-based exfoliation 11-15 and chemical reduction of exfoliated graphite oxide.16-19. A summary of different preparing processes of GN is shown in Fig.2-1.20 More detail of preparation methods, properties of graphene and its application can be found in previous literatures [16-20].
5
Figure 2-1. Schematic illustration of current graphene production techniques.20 (a) Micromechanical cleavage. (b) Anodic bonding. (c) Photoexfoliation. (d) Liquid phase exfoliation. (e) Growth on SiC. Gold and grey spheres represent Si and C atoms, respectively. At elevated T, Si atoms evaporate (arrows), leaving a carbon-rich surface that forms graphene sheets. (f) Segregation/precipitation from carbon containing metal substrate. (g) Chemical vapor deposition. (h) Molecular Beam epitaxy. (i) Chemical synthesis using benzene as building block.
2-2. Electrochemical approach to produce graphene
6
intercalation compounds (GICs) in the past decades.21 A recent review indicates that this technique was employed as early as 1840.22 The consequent efforts, successes and developments of this method for production of graphite oxide and graphene is presented in Fig.2-2.22
7
Figure 2-2. Timeline for the development of GN using electrochemical
8
Basically, electrochemical exfoliation employs an ionically conductive solution (electrolyte) and a direct current (DC) power source to prompt the structural changes within the graphitic precursor (e.g. rod, plate, or wire) used as the electrode. The schematic of a conventional parallel two-electrode electrochemical cell used for the batch production of GN flakes is displayed in Fig.2-3.23 The principle of preparing GN flakes by electrochemical method (Fig. 2-4) involves the intercalation processes where guest anions X-, such as BF4
and SO4
(anodic exfoliation)24,25, or cations M+, such as Li+ and TBA+, EA+ (cathodic exfoliation)5,26-28, penetrate into the Van der Waals gaps between the carbon layers and enlarge the interlayer distance of the host graphite working electrode (WE) resulting in the intercalation of a cation or anion from the electrolyte.22 A post-treatment step is then required to effectively exfoliate the graphite intercalation compounds/expanded graphite either by ultrasonication or electrochemical and thermal decomposition of the intercalants at elevated voltage (5–20V) and temperatures.27-31 By using various electrolytes, likes: HBr, HCl, HNO3, and
H2SO4, a high-quality graphene thin films from electrochemical exfoliation of
highly oriented pyrolytic graphite can be achieved.25 The exfoliated graphene sheets exhibit lateral size up to 30μm, and more than 65% of the sheets have the thickness less than 2 nm. Over 60% of the sheets are bilayers with AB stacking, and though oxidized, they have significantly higher electron mobility than most of reduced graphene oxide.25 The detail process of electrochemical synthesis of GNs was described in Ref. 22-28.
9
Figure 2-3. Diagram of the apparatus for synthesis of graphene via electrolytic
10
Figure 2-4. Electrochemical approaches (a) oxidation, intercalation and exfoliation
(negative ions are shown in red color) and (b) reduction, intercalation and exfoliation to produce single and multilayer GN flakes. 22
2-3. Cathodic plasma electrolysis to produce nanomaterials
Plasma electrolysis is a hybrid of conventional electrolysis and atmospheric plasma processes. In principle, it employs a voltage that is much higher than it is used at the traditional electrochemical method between two electrodes in an
11
aqueous media. One of the electrodes must have much smaller surface than the second one or ones, and it is called the active electrode, regardless the anode or the cathode. The active electrode (work-piece) is the object or objects to be treated. Depending on the polarity of applied voltage to the work-piece, this process can be divided into either anodic or cathodic plasma electrolysis processing (CPE). Most studies are concentrated on the anodic regime of plasma electrolysis and very few on the cathodic regime. The schematic division for this plasma electrolysis process is shown in the Fig 2-4. 32
Figure 2-4. Typical classification of plasma electrolysis and its applications.32
The mechanism of CPE is based on the evaporation or reaction of electrolyte and then electrical break down of the gaseous envelope around the active electrode resulting in the formation of sparks around the processed electrode.33 The main factors, that influence the formation of the continuous plasma envelope, include: applied potential, temperature of the electrolyte, electrode geometry, nature and
12
properties of the electrolyte, and flow dynamics. 34,35 Good reviews of detail mechanism for plasma electrolysis and its application could be found in Ref 33-35.
In cathodic configuration, this processing used for producing of nitride, carbon, titanium, molybdenum, zinc and zinc-aluminium based coatings on metal substrate.33,34,36,37 The nano-crystalline graphite films on titanium substrate prepared from a predominantly ethanol liquid phase have been deposited by the cathodic plasma electrolysis.38 39 It has been observed that the properties of obtained layers depend on the characteristics of achieved nanostructures, such as: average size, distribution and average coordination number of nanocrystallites. Furthermore, the properties of the processed surface can be tailored by tailoring the nanostructure characteristics. 38 39 In fact, each layer of graphene in the bulk graphite is sandwiched between two layers of hexagonally close-packed C atoms, with the adjacent layers, bound by weak van der Waals interactions, readily exfoliating into individual graphene nanosheets upon the impacting on the surface, such as ultrasonication or thermal extension; as a result, we suspected that the plasma electrolysis phenomenon on the surface of graphitic electrode might be involved in breaking van der Waals force bondedgraphene layers in the bulk state to controlled produce GO or graphene flakes. To address the above-mentioned issues, we have utilized cathodic plasma electrolysis as a part of the graphite oxide or graphene controlled fabrication process. The detail motivation and experimental of this assumption will be presented in next chapter.
2-4. Solution-based exfoliation approach to produce MoS2
Siminar to graphene, the transition metal dichalcogenides that consist of hexagonal layers of metal atoms (M) sandwiched between two layers of chalcogen atoms (X) with a MX2 stoichiometry, such as MoS2 also involve van der Waals
13
interactions between adjacent sheets with strong covalent bonding within each sheet. 40-42 Thus, they can be synthesized by methods commonly employed in the production of graphene.43,44 The excellent review on synthesis, properties, and its applications could be found reference 40-44.
14
Chapter 3: Plasma electrolysis allows the facile and efficient production of graphite oxide from recycled graphite
Graphene, a single layer of carbon atoms bound together in a hexagonal lattice, has many potential applications in energy-storage devices such as super capacitors and batteries. Among several methods for preparing graphene, the chemical reduction of graphene oxide that are obtained from oxidation of graphite and subsequent exfoliation is widely considered to be the most promising approach for the large-scale production of graphene. The oxidation of graphite to graphite oxide involves concentrated mineral acids that are highly toxic and poses an environmental risk when they are discharged after use. In this chapter, we adopted a highly efficient cathodic plasma process in which the vapor plasma envelope calorific effect provides instant oxidation and expansion of graphite for producing plasma-expanded graphite oxides from recycled graphite electrodes or high purity graphite, providing a first green step toward the mass production of graphene.
3-1.Introduction
Graphene, a single layer of carbon atoms bound together in a hexagonal lattice (i.e., a two-dimensional form of graphite), 45 has many potential applications in, for example, energy-storage materials, 4,46-49polymer composites,
12,50,51
transparent conductive electrodes, 52-55 memory devices, 56-58and sensors. 59-62 Several methods are available for preparing graphene: chemical vapor deposition (CVD), 63-65 epitaxial,22, 23 unzipping of carbon nanotubes,24, 25 electrochemical exfoliation, 23,25,30,66 liquid-phase exfoliation of graphite, 67,68 and chemical reduction of graphite oxide (GO).69,70 Among these methods, the chemical reduction of GO is one of the most promising approaches for the large-scale production of graphene; it involves (i) oxidation of graphite to GO using the
15
methods developed by Staudenmeier, 71 U. Hofmann, 72 or Hummers, 73 (ii) exfoliation of GO through ultrasonication or thermal treatment to yield graphene oxide; and (iii) chemical reduction of graphene oxide to a graphene or graphitic network of sp2-hybridized carbon atoms. The mixtures of strong oxidants and concentrated acids used to prepare GO are, however, highly toxic and dangerously unstable, requiring additional safety precautions. 74,75 Moreover, the discharge of large quantities of acidic waste poses an environmental risk. Thus, new methods for the preparation of GO, without the need for toxic chemical agents or the harsh oxidation of graphite, would be of great interest from the perspectives of science, technology, and environmental protection. Hudson et al. 76 reported the preparation of GO from graphite using an electrochemical method with a reaction time on the order of several weeks; it would require further improvements if it were to become as effective as the chemical methods described above. Several other studies based on the electrochemical activation of glassy carbon (GC) or highly ordered pyrolytic graphite (HOPG) have also been reported for the successful formation of GO. 77,78 For each of these methods, however, graphite of relatively high purity (e.g. purified natural graphite, glassy carbon, or HOPG) is used as the starting material. To date, the preparation of GO using low-purity graphite such as graphite electrodes (GEs) that have been recycled from used batteries as the starting material has not yet been reported. Herein, we demonstrate a highly efficient, green, and facile approach—involving cathodic plasma (CP) processing and subsequent ultrasonication—for the synthesis of GO from GEs recycled from batteries.
A classic electrolysis reaction involves either an anode oxidation or a cathode reduction process in an electrolyte bath. In an electrolytic process, the onset of plasma can be triggered around the working electrode—so-called plasma
16
electrolysis—when the applied voltage is larger than the threshold voltage, with a strong electric field generated near the working electrode (either the anode or cathode). 34,35,38 The plasma near the working electrode induces strong Joule heating in the vicinity of the submerged part of this electrode, resulting in the formation of a vapor plasma envelope (VPE) with a surrounding temperature exceeding 2000 °C. 34 Plasma electrolysis can, therefore, be used to enhance chemical or physical processes occurring on the electrodes. For example, plasma electrolytic oxidation in an electrolyte bath, where the working electrode is an anode having a surface area much smaller than that of the cathode, is widely used industrially for oxidizing metal surfaces to form metal oxide coatings.
In the present study, however, we applied a highly negative voltage (–60 V) from a DC power supply to a graphite working electrode, which we used as the cathode; when this graphite cathode approached, but barely reached, the surface of the electrolyte, plasma was generated instantly on the cathode (see the demonstration movies in the Supporting Information). If the graphite working cathode were submerged into the electrolyte at shallow depths (e.g., 1 cm), no plasma was generated. We, therefore, term this plasma electrolysis process as a cathodic plasma (CP) process. Figure 1 presents schematic representations of the equipment set-up that we used for the CP process in conjunction with an ultrasonication bath. Surprisingly, the surface of the graphite electrode tip that was covered by the generated plasma could be oxidized and exfoliated into the electrolyte in a controllable manner. One possible explanation for the mechanism in this CP process is that the enormous amount of heat generated from the VPE calorific effect supplied the thermal energy required for the local oxidation of the surface of the GE. Hence, this process could be used for oxidation of the GE or HG to produce graphite oxide without the need for a mixture of strong oxidants and
17
concentrated acids; we term the material produced as plasma-expanded graphite oxide (PEGO). The entire experiment could be performed within 10 min at a temperature below 80 °C when using KOH and (NH4)2SO4 in deionized (DI) water
as the electrolytic solution. The detailed experimental conditions are described in the experimental section.
With further ultrasonication of a solution of PEGO in NMP, we obtained exfoliated PEGO (EPEGO). In addition, during ultrasonication, a local hot spot of the VPE (spark) could induce instant exfoliation reactions, producing a small portion of graphene sheets or graphene-like materials. The major advantages of this CP approach for producing graphite oxide from graphite are a simple setup, low cost (GO can be derived from a plentiful resource: recycled GEs), rapid processing, and environmental friendliness.
3-2. Experimental
3-2.1. Preparation of PEGO and PEHGO
The electrolytic solution, comprising KOH (10%, 180 mL) and (NH4)2SO4
(5%, 20 mL) at a pH of approximately 14, was preheated to an initial temperature of 70 °C. A cylindrical graphite rod (GE) or high purity graphite (HG) was used as the cathode connected to a voltage supply unit (negative voltage output); the cathode diameter and length were 6 and 40 mm, respectively. A stainless-steel grid acted as the anode in the electrochemical system for the plasma expansion process (PEP). The top end of the cathode was placed about 1 mm above the surface of the electrolytic solution, while the anode was submerged in the electrolytic solution. The surface area of the cathode was much smaller than that of the anode as illustrated in Figure 1a. Both electrodes were connected to a regulated DC power supply (TES-6220) with an applied maximum fixed voltage of 60 V and a
18
maximum current intensity of 3 A, resulting in a discharging plasma in the area adjacent to the GE and the electrolytic solution. As the exfoliation of GE progressed, the tip position of the GE was lowered to maintain a current of approximately 1.75 A. The temperature of the solution within the beaker was measured during the process using a conventional mercury thermometer; it was maintained at approximately 70–80 °C. To enhance exfoliation and the homogeneity of the reaction, the beaker containing the electrolytic bath was submerged partially in an ultrasonication bath maintained at 20 kHz under a power of 150 W. The length of time in which the samples experienced simultaneous treatment was 10 min. Fig.3-1 provides schematic representations of the equipment set-up used in the CP process (also see the demonstration movies in the Supporting Information).
19
Figure 3-1. Schematic representation of the equipment used for the
CP process combined with ultrasonic vibration.
After CP treatment, the products were collected through vacuum filtration of the solution through PVDF membranes (average pore size: 0.2 µm) supported on a fritted glass holder. The resulting mixture was washed sequentially with DI water and 1% HCl and then repeatedly with DI water until the pH reached 8. After drying at room temperature under vacuum for 24 h, the PEGO was obtained. The prepared samples were stored in a drying box at 50 °C until required for use. For comparing to the processing of recycled graphite electrode, we also applied the CP process to high purity graphite (HPG) for demonstrating the generality of the CP process, regardless of the starting graphite materials. The graphite oxides produced from the recycled graphite electrode (GE) and high purity graphite (HPG) are termed PEGO and PEHGO, respectively.
3-2.2. Preparation of EPEGO
The obtained PEGO (10 mg) was added to N-methyl-2-pyrrolidone (NMP, 100 mL) to create PEGO dispersion (0.1 mg/mL), which was subjected to exfoliation for 30 min using a tip ultrasonication apparatus (SONICS, 700 W, 75% amplitude). To remove unwanted large graphite particles produced during the exfoliation process, the resultant mixture was centrifuged for 5 min at 4000 rpm and then for 25 min at 1500 rpm. After centrifugation, the top 10 mL of the dispersion was decanted by pipette; herein, this sample is referred to as CGOD. The other resultant mixture was filtered through an AAO membrane (Anodisc;
20
diameter: 47 mm, nominal pore size: 0.02 µm); the solids were then dipped in EtOH to remove residual NMP. The flakes that floated on the surface of the EtOH were collected on a Si substrate. After drying under vacuum at 50 °C for 24 h, a powdery product remained on the surface of the Si substrate; herein, it is named EPEGO.
3-2.3. Adsorption of MB on PEGO
The obtained PEGO powder (20 mg) was added to DI water (4 mL) to create a PEGO dispersion (5 mg/mL), which was added to MB solution (10 mg/L, 10 mL) and gently stirred before being left to equilibrate for 3 h. All experiments were performed at room temperature and a pH of approximately 7. After 3 h, a sample of the supernatant (2 mL) was removed by pipette to evaluate the residual MB concentration in the resultant solution. The amount of MB adsorbed was calculated using Beer’s law, based on the absorption peak at 665 nm of the sample in a 1-cm quartz cell, as measured using a UV–Vis spectrophotometer.
3-2.4. Measurements and Characterization
The structures of the GE, PEGO, PEHGO and EPEGO were examined using a D2 X-ray diffractometer equipped with a Cu K tube and a Ni filter ( = 0.1542
nm). Surface chemical compositions of PEGO and PEHGO were determined by XPS (Phi V6000). Raman spectra of these samples were recorded using a high-resolution confocal Raman microscope (HOROBA, Lab RAM HR) and a 632.8.5-nm HeNe laser source. UV–Vis spectra were recorded using a Hitachi U-4100 spectrophotometer. SAED patterns and HRTEM images were recorded using a JEOL 2100 apparatus operated at 200 kV; for HRTEM measurement, a few drops of the GE, HG, PEGO, HPEG and EPEGO solution were placed on a Cu grid presenting an ultrathin holey C film. SEM was performed using a JEOL
JSM-21
6500F scanning electron microscope operated at 15 kV. Prior to SEM measurement, PEGO and HPEGO samples were coated with a thin (ca. 3 nm) layer of Pt. AFM images were obtained using a Digital Instruments Nanoscope III apparatus equipped with a NANOSENSORS Si tip, operated in the tapping mode with a resonance frequency of 130 kHz. AFM samples were prepared by drop-casting CGOD solutions onto the surfaces of Si/SiO2 substrates and then drying in
air.
4-3.Results and discussions
Figure 3-2. (a) X-ray diffraction patterns of the GE, PEGO, and EPEGO samples,
(b) X-ray photoelectron spectroscopy of C1s signal of PEGO, (c) XRD patterns of the HGO, HPEGO samples, and (d) X-ray photoelectron spectroscopy of C1s signal of HPEGO.
22
Fig. 3-2a presents X-ray diffraction (XRD) patterns of the GE, PEGO, and EPEGO samples. The diffraction curve of the GE displays a sharp, high-intensity peak near a value of 2 of 26.6° that can be assigned to the characteristic peak (002) of graphite; this signal indicates a rather highly ordered crystal structure with a value of d002, which is the spacing between two neighboring atomic planes in
graphite, of 0.334 nm. In addition, weak peaks appear at values of 2 of 21.5 and 23.5°, possibly resulting from some additives or impurities in the GE. After the GE had experienced the CP process, the characteristic (002) peak at a value of 2 of 26.6° for PEGO almost disappeared completely, whereas the intensity of the diffraction peak at a value of 2 of 9.8° (corresponding to a value of d001 of 0.896
nm), the characteristic (001) peak of GO, increased significantly, implying an increase in the interplanar distance: from 0.334 nm for GE to 0.896 nm for PEGO. This finding indicates that the original graphene layers in GE had lost their periodic arrangement in the z-direction after they had transformed into PEGO, an intercalated graphite compound,46-48 through this CP process. For the EPEGO, the intensity of the characteristic (001) peak at a value of 2 of 9.8° (d001 = 0.896 nm)
decreased significantly, with a large peak appearing at a value of 2 of approximately 26° (d002 = 0.341 nm). This d002 spacing for the EPEGO is close to
the spacing of the characteristic (002) peak of GE (0.334 nm), indicating that the EPEGO contained exfoliated graphite sheets or graphite nanoplatelets. The presence of a peak for the EPEGO at a value of 2 of 9.8° indicates, however, that a significant portion of PEGO had not been exfoliated.
Figure 3-2b demonstrates the C 1s XPS spectrum of PEGO, where the peak at ~ 284.4 eV is attributed to the C=C (sp2-hybridized carbon atoms,) and the large and broad peak at ~ 286.4 eV is caused by C-O (hydroxyl and epoxy,) groups along with two de-convoluted minor components at~ 287.9 eV and at ~ 289.0 eV
23
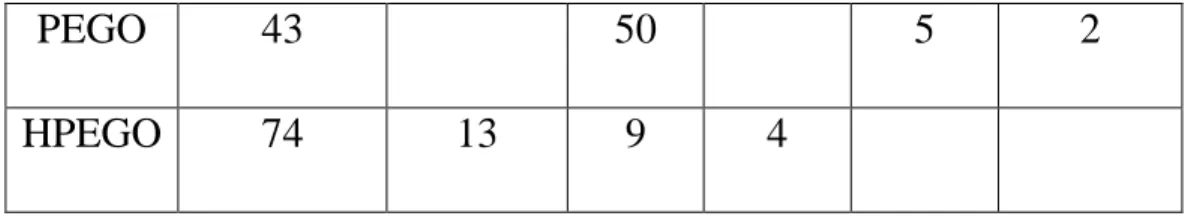
that resulted from C=O (carbonyl,) and O-C=O (carboxylate carbon,) groups, respectively, confirming the presence of graphite oxide and being consistent with the results of XRD. 16,79,80 Fig. 2c and 2d presented the XRD pattern and C 1s XPS spectrum of HPEGO, respectively. The peak at 2 =26.6° in the XRD curve of HPEGO sample confirms the presence of a substantial amount of the graphite phase, suggesting a lower conversion of high purity graphite (HG) into graphite oxide with the CP process than in the case of GE. In addition, the shoulder next to the C 1s XPS peak at 286 eV for the HPEGO samples can also be de-convoluted into four minor peaks at 284.6, 285.5, 286.1and 286.9 eV that were attributed to C=C (sp2-hybridized carbon atoms), C-C (sp3-hybridized carbon atoms,), C-O (hydroxyl group) and COOH (alcohol/ether groups), respectively, indicating graphite oxide-like structure. 79 Table 1A lists a quantitative comparison on the amounts of various oxygen containing groups in PEGO and HPEGO bases on the area under the XPS peaks. The atomic percentage of carbon in HPEGO (87%) is higher than that (43%) of PEGO, which translated to a carbon to the oxygen bonded carbon (C/O) ratio of 1.75 and 7.0, respectively, indicating that the CP process is more effective of generating GO from GE than from HG. This can be attributed to the more uniform packing of graphene layers in HG than in GE, as reflected in the much sharper (002) peak, at a value of 2 of 26.6°, for the HG than that of the GE in the XRD curves.
Table 3-1. The relative atomic percentage of various functional groups in PEGO
and HPEGO estimated based on the area under the C 1s peaks
C=C (%) C-C (%) C-O (%) C-OH (%) C=O (%) O-C=O (%)
24
PEGO 43 50 5 2
HPEGO 74 13 9 4
Figure 3-3. SEM images of the (a) GE, (b) PEGO, and (c) EPEGO samples; insets: high-magnification images.
25
Fig.3-3 presents scanning electron microscopy (SEM) images of the GE, PEGO, and EPEGO samples, revealing their significantly different structures. Fig. 3a indicates that the GE in powder form consisted largely of multilayered graphite clusters. Fig. 3b reveals that the PEGO (see Figure S2 in the supporting information for HPEGO), produced after the GE had been subjected to the CP process, featured crumpled structures and a heterogeneous surface, due to fast quenching; a high-magnification image of the PEGO ( inset to Fig. 3b) indicates that it possessed spheroidal features having dimensions of 1–3 µm. The crumpled PEGO comprised many thin graphite oxide sheets, with the interactions among them being rather weak; thus, we expected it to undergo further exfoliation into thinner graphite oxide sheets. Fig.3-3c reveals that the graphite oxide sheets, with lateral width from several hundreds of nanometers to 3 µm, could be produced after subjecting the PEGO to ultrasonication; the inset displays a magnified view of one such exfoliated sheet having a thickness (ca. 10–50 nm) close to the size of a nanoplatelet. 16 Image analysis calculations based on 20–50 EPEGO nanosheets revealed that the average sheet diameter was approximately 1.5 µm with a thickness of approximately 10–30 nm, based on cross-sectional imaging of the folded edges of EPEGO after tilting the sample from 0 to 25°. Notably, the EPEGO could be imaged clearly through SEM without the charging effects that occurred for PEGO. 16
Fig.3-4 provides a schematic representation of our proposed mechanism for the formation of the PEGO. We considered that its shape was formed through the “melting/quenching” process displayed in Fig. 4a. During the CP process, the high-temperature plasma that existed in the regions close to the interfaces between the GE and the electrolyte supplied thermal energy for the oxidation of the GE. These regions of high-temperature plasma, however, were surrounded by
26
the near room-temperature (70 °C) electrolyte; therefore, the temperature dropped rapidly across the interfaces, causing freezing of the oxidized features on the surface. The oxidized graphite clusters were then plucked from the surface of the GE and quenched in the electrolyte to form spherical and crumpled platelets that minimized the surface energy. Furthermore, the ultrasonic vibration enhanced the exfoliation of the outer shell of the oxidized GE. To verify this proposed mechanism, we would need to accurately measure the temperature in the plasma region and perform a quantitative investigation of the prepared PEGO samples using various other characterization tools—experiments that are beyond the scope of this manuscript.
27
Figure 3-4. (a) Mechanism of formation of PEGO and digital image of VPE.
(b) Mechanism of plasma-mediated expansion of GE.
Fig.3-4 displays a schematic representation of the detailed mechanism for the formation of graphite oxide from graphite when using this CP process. The plasma in the discharge channel can usually reach a very high temperature and pressure within a short period of time time (e.g., <10–6 s);43 therefore, it is quite
28
possible that when the surface of the GE cathode tip is surrounded by the VPE, which is generated in the interfacial areas between the electrolyte and the GE tip-surface, the GE tip-surface is rapidly heated to a high temperature (see the demonstration movies in the Supporting Information). As a result, the electrolyte in the vicinity of the GE tip-surface that was encompassed by the VPE in the plasma environment would be vaporized instantly, producing a number of active species, such as hydrogen or nitrogen radicals, 35,81,82 or oxygen-containing groups that could penetrate into the spaces between the graphene sheets in the VPE-encompassed GE tip. These radicals then attack the C–C bonds in the graphite to produce GO, resulting in their oxidation and expansion. This simultaneous oxidation and expansion in GE not only produces PEGO but also results in a 30-fold expansion in the spacing between two neighboring atomic planes in PEGO relative to that in the original GE.
29
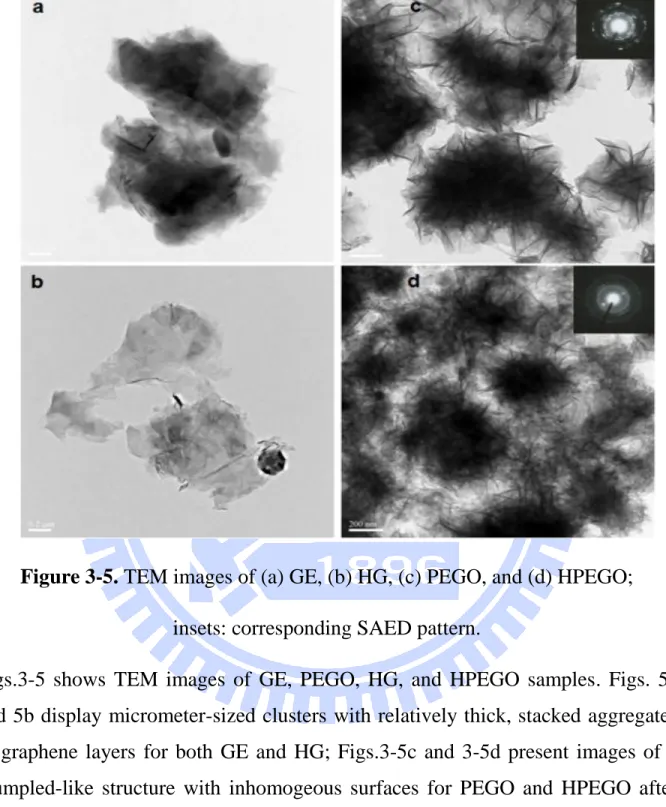
Figure 3-5. TEM images of (a) GE, (b) HG, (c) PEGO, and (d) HPEGO;
insets: corresponding SAED pattern.
Figs.3-5 shows TEM images of GE, PEGO, HG, and HPEGO samples. Figs. 5a and 5b display micrometer-sized clusters with relatively thick, stacked aggregates of graphene layers for both GE and HG; Figs.3-5c and 3-5d present images of a crumpled-like structure with inhomogeous surfaces for PEGO and HPEGO after the GE and HG had experienced the CP process, being consistent with the SEM results.
30
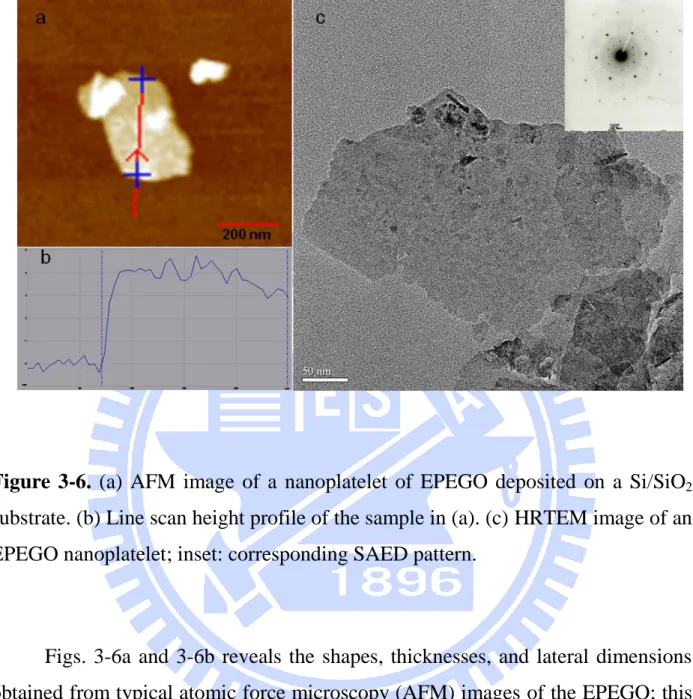
Figure 3-6. (a) AFM image of a nanoplatelet of EPEGO deposited on a Si/SiO2
substrate. (b) Line scan height profile of the sample in (a). (c) HRTEM image of an EPEGO nanoplatelet; inset: corresponding SAED pattern.
Figs. 3-6a and 3-6b reveals the shapes, thicknesses, and lateral dimensions obtained from typical atomic force microscopy (AFM) images of the EPEGO; this EPEGO sample had a lateral dimension of approximately 250 nm and a thickness of approximately 4 nm, corresponding to approximately four layers of graphene, based on an interlayer spacing of 1 nm. Furthermore, the exfoliated EPEGO could be clearly identified in a high-resolution transmission electron microscopy (HRTEM) image, appearing translucent, with a selected-area-electron-diffraction (SAED) pattern that reveals a typical hexagonally arranged lattice of carbon atoms. Two hexagonal patterns were overlapping each other, suggesting that the EPEGO
31
samples comprised multi-layered graphene sheets, being consistent with Fig.3-6c The sizes and thicknesses of the nanoplatelets visualized in the HRTEM and AFM images were smaller than those in the SEM images, because the EPEGO samples had been diluted in NMP. These results suggest that PEGO can serve as a potential precursor for the preparation of graphite nanoplatelets. We suspect that optimizing the plasma power and ultrasonication conditions would allow us to control the lateral dimensions and thicknesses of these samples.
32
Fig.3-7 displays Raman spectra of the GE, PEGO, and EPEGO samples, revealing their D (defect), G (graphite), and 2D (doubly generated G) bands at 1325, 1570, and 2658 cm–1, respectively. 83,84 The D band of the GE has relatively high intensity, suggesting that the GE sample featured some defect structures, such as disordered carbon structures or impurities,85 consistent with the XRD data. The peak positions of the D and G bands of the EPEGO sample are similar to those of the GE and PEGO samples, but the ID/IG intensity ratio for the EPEGO (0.53) was
significantly lower than those (0.97) for both the GE and PEGO. Moreover, the intensity and sharpness of the G band of the EPEGO both increased significantly relative to those of the GE and PEGO samples, suggesting that disordered C structures, such as sp3-hybridized C atoms, had been removed partially and that graphitic domains had been restored in the EPEGO sample during the ultrasonication process. In addition, the 2D band for EPEGO consisted of a single-Lorentzian 2D peak; its FWHM of approximately 70 cm–1 was, however, almost double that (ca. 35 cm–1) of the 2D peak of graphene, consistent with the multilayer features of turbostratic graphene.86 These results are consistent with the data from previous SEM and HRTEM studies.
The XRD, SEM, AFM, TEM and Raman data suggested that the PEGO served as a good precursor for the preparation of graphite nanoplatelets. Notably, when using VPE we could oxidize graphite without prior purification to remove additives or impurities, into GO within approximately 10 min, in contrast to the typically long treatment times (ca. 100 h) required when using concentrated acid and strong oxidizing agents. Taking into consideration the aspects of user-friendliness and recyclability, this VPE calorific process appears to be a very efficient means of synthesizing GO.
33
Figure 3-8. Photograph of (a) the dispersion of PEGO in the electrolytic solution,
(b) the sample obtained after filtering the sample in (a) through PVDF (pore size: 0.2 µm) and re-dispersion in NMP, (c) the sample obtained after ultrasonication of the sample in (b), and (d) the centrifuged dispersion of PEGO in NMP.
Fig.3-8 displays photographs of dispersions of the PEGO in various solvents after performing the CP process. Fig.3-8a reveals that some of the PEGO obtained from the CP process in the electrolyte solution precipitated to the bottom of the glass vial; Fig.3-8b displays the PEGO sample obtained after filtering and re-dispersing in NMP without ultrasonication; Fig. 3-8c indicates that ultrasonication enabled the dispersion of PEGO in the NMP; and Fig. 8d reveals the clear PEGO/NMP solution obtained after centrifugation. Figs. 8c and 8d indicate that the PEGO solutions were rather homogeneous; they remained stable for long periods of time (12 weeks) with almost no precipitation.
34
Figure 3-9. UV–Vis spectra of MB solutions in the (red) presence and (black)
absence of PEGO; inset: photograph of the (left) original MB solution and (right) MB-adsorbed PEGO solution.
To demonstrate the potential applications of PEGO materials, we applied the PEGO for the removal of Methylene Blue (MB) from aqueous solutions. Because the PEGO had a spheroidal structure, it could form 3D agglomerates with a large surface area,57 making it a potentially useful absorbent. The inset to Fig.3-9 reveals that an MB solution (10 mg/L, 10 mL), initially displaying a typical blue color, became a pale blue solution 3 h after addition of the PEGO solution (5 mg/mL, 4 mL), revealing that PEGO could remove MB efficiently with most of the
MB-35
adsorbed PEGO having precipitated to the bottom of the glass container. After decanting the supernatant solution via pipette, we collected the aggregate and dried it at room temperature for 24 h. Notably, we applied the initial PEGO sample without any pretreatment. Fig.3-9 displays UV–Vis spectra of the MB solution in the presence and absence of PEGO. We used the absorbance in each case to calculate the percentage adsorption of MB on the PEGO:
[%] (1)
where Ai and Af are the initial and the final absorbances, respectively. The
intensity of the characteristic peak at 665 nm for the MB solution that had been treated with the PEGO was dramatically lower than that of the pristine MB solution, indicating a significant drop in the concentration of MB in the solution; the removal efficiency, determined using equation (1), was 97%. Therefore, our PEGO material appears to be a promising adsorbent for the removal of dyes or pigments, such as MB, from aqueous solutions.
3-4. Conclusions
Our characterization data reveal that swelled graphite oxide can be obtained from recycled graphite electrodes or even high purity graphite through a combination of cathodic plasma processing and ultrasonication at relatively low temperature, under atmospheric pressure, within a very short period of time, without the need for concentrated acids or strong oxidizing agents. The cathodic plasma process is a very efficient means of producing graphite oxide because it takes advantage of the vapor plasma envelope calorific effect that provides instant
36
oxidation and expansion of graphite and appears to have great promise because it can be performed using various starting materials (e.g., recycled graphites), at low cost, in a simple setup, and with high efficiency and environmental friendliness. The graphite oxide produced through this process can be used as an effective adsorbent for a removal of Methylene Blue from aqueous solutions and can serve as a suitable precursor for the preparation of graphite nanoplatelets.
37
Chapter 4: Plasma-assisted electrochemical exfoliation of graphite for rapid production of graphene sheets
Plasma electrolysis can be used to enhance the chemical or physical processes occurring at the electrodes. In this chapter, we describe a new plasma-assisted electrochemical exfoliation method, involving a plasma-generated graphite cathode and a graphite anode, for the production of graphene sheets from graphite electrodes in a basic electrolyte solution in a short reaction time. This method provides a green and fast step toward the mass production of two dimension materials such as graphene.
4-1. Introduction
Graphene sheets (GSs), including graphite nanoplatelets (GNPs), graphite nanosheets (GNs), exfoliated graphite (EG), and multiple-layer graphene, are nanometer-scale platelets that comprise of a few layers of planar graphene with platelet thicknesses ranging from 0.34 to 100 nm.16,18,87 Recently, GSs have attracted great interest because of their extraordinary properties and their potential applications in energy storage,4,46-49 composites materials,12,50,51,55,88 and polymer/GNP nanocomposites.59,89-91 The methods through which GSs are synthesized determine their structures and, therefore, can influence their practical applications.12,88,92-94 Several methods have been developed for the preparation of GSs, including chemical vapor deposition,62 discharging,7,8 mechanical milling,9,10 liquid-phase exfoliation of graphite,68,95 chemical reduction of exfoliated graphite oxide (GO),69,96 and electrochemical exfoliation.5,6,22,30,97-101 Among them, the electrochemical exfoliation of graphite is one of the simplest and most convenient methods for the large-scale production of GSs.
38
Plasma electrolysis, when the applied voltage is greater than the threshold voltage in electrochemical reactions, a strong electric field was generated near the working electrode, can be used to enhance the chemical or physical processes occurring at the electrodes. Herein, we describe a highly efficient plasma-assisted electrochemical exfoliation method, involving a plasma-generated graphite cathode and a graphite anode, for the production of graphene sheets from electrodes in a basic electrolyte solution in a short reaction time. This method provides a greener step toward the mass production of graphene. Up to now, we are unaware of any previous reports of the preparation of graphene sheets through electrochemical exfoliation involving plasma.
In the present study, a much larger potential, 60V, as compared to 5-10V in the case of conventional electrochemical method, is applied to the high-purity graphite (HG) cathode that maintain its tip barely above the basic electrolyte, a solution containing a mixture of KOH and (NH4)2SO4, different from conventional
electrochemical cells,6,22,25 while the rod-HG anode is submerged in the electrolyte. Discharge can be initiated by lowering the cathode to touch the surface of the electrolyte. Because the surface contact area of cathode in the electrolyte is much smaller than that of the anode, an extremely high electric field is generated near the cathode surface that is in contact with the electrolyte. Simultaneously, hydrogen gas bubbles evolved from the hydrolysis of the water in the electrolyte near the surface contact area of the cathode tip. As a result of an instant ionization of hydrogen gas bubbles by the presence the high electric field near the cathode tip, the onset of plasma around the cathode tip takes place (see experimental section).
4-2. Experimental
39
The electrolytic solution, comprising KOH (5%, 200 mL) and (NH4)2SO4
(2.5%, 40 mL) at a pH of approximately 12, was preheated to an initial temperature of 70 °C. A cylindrical high-purity graphite rod (HG) was used as the cathode connected to a voltage supply unit (negative voltage output); the cathode diameter and length were 6 and 100 mm, respectively. Another HG rod (diameter: 6 mm; length: 150 mm) was used as the anode in the electrochemical system for the plasma-assisted electrochemical exfoliation process (PEEP). The HG tip surface cathode was placed about 1 mm above the surface of the electrolytic solution, while the anode was submerged in the electrolytic solution. Both electrodes were connected to a regulated DC power supply (TES-6220) with the bias voltage increased gradually to 60 V, resulting in discharging plasma in the area adjacent to the HG tip surface cathode and the electrolytic solution. The temperature of the solution within the beaker was measured during the process using a conventional mercury thermometer; it was maintained at approximately 70–80 °C. To enhance exfoliation and the homogeneity of the reaction, a magnetic stirrer was placed in the beaker with its rate of spinning maintained at 200 rpm. When a sufficiently high potential of 60 V was applied across the two electrodes, electrochemical oxidation reactions were triggered with the simultaneous release of gases on the surface of anode and the generation of plasma on the HG tip surface cathode (see movie in SI); as a result, the surface of the graphite electrodes slowly disintegrated into micrometer-sized sheets and dispersed into the electrolyte. The tip position of the cathode was lowered to maintain an approximate current range from 0.6 to 1.2 A. The length of time in which the samples experienced simultaneous treatment was 5 min. Fig.4-1a provides a schematic representation of the equipment setup. After cooling to room temperature, the resulting exfoliated graphite flakes were collected through vacuum filtration of the solution through PVDF membranes (average pore size: 0.2 µm) supported on a fritted glass holder. The prepared
40
products were washed with DI water and dried at 50 °C under vacuum for 24 h. After peeling off the PVDF membrane, the powder prepared from PEEP, described herein as plasma- electrochemically exfoliated graphene (PEEG) was stored in a drying box at 50 °C until required for use. For conventional electrochemical method, two HG rod is dipped into electrolyte, one electrode is biased positively, and other electrode is biased negatively. The graphene sheets produced from this mode named EEG.
4-2.2. Preparation of PEEG dispersion
The obtained PEEG (15 mg) was added to N-methyl-2-pyrrolidone (NMP, 15 mL) to create PEEG dispersion (1 mg/mL) when treated with an ultrasonic cleaning bath, operated at 20 kHz and a power of 130 W for 10 min.
4-2.3. Measurements and Characterization
The structures of the HG and the PEEG powders were examined using a D2 X-ray diffractometer equipped with a Cu K tube and a Ni filter ( = 0.1542 nm).
Raman spectra of these samples were recorded using a high-resolution confocal Raman microscope (HOROBA, Lab RAM HR) and a 514.5 nm Ar laser source. High-resolution transmission electron microscopy (HRTEM) images were recorded using a JEOL 2100F apparatus operated at 200 kV; for HRTEM measurement, a few drops of the HG or PEEG dispersion were placed on a Cu grid presenting an ultrathin holey C film. Scanning electron microscopy (SEM) was performed using a JEOL JSM-6500F scanning electron microscope operated at 15 kV. For preparation of the SEM sample, a PEEG dispersion was filtered through an AAO membrane (Anodisc; diameter: 47 mm; nominal pore size: 0.02 µm); the solids were then dipped in EtOH to remove residual NMP; the flakes that floated on the surface of the EtOH were collected on a Si substrate for SEM measurement.