Open Access
Research article
Antihypertensive medication prescription patterns and time trends
for newly-diagnosed uncomplicated hypertension patients in
Taiwan
Pang-Hsiang Liu
1,2and Jung-Der Wang*
1,2,3Address: 1Institute of Occupational Medicine and Industrial Hygiene, College of Public Health, National Taiwan University, Taipei, Taiwan, 2National Center of Excellence for Clinical Trial and Research, National Taiwan University Hospital, Taipei, Taiwan and 3Departments of Internal
Medicine and Environmental and Occupational Medicine, National Taiwan University Hospital, Taipei, Taiwan Email: Pang-Hsiang Liu - d94841004@ntu.edu.tw; Jung-Der Wang* - jdwang@ntu.edu.tw
* Corresponding author
Abstract
Background: Knowledge of existing prescription patterns in the treatment of newly-diagnosed
hypertension can provide useful information for improving clinical practice in this field. The aims of this study are to determine the prescription patterns and time trends for antihypertensive medication in newly-diagnosed cases of uncomplicated hypertension in Taiwan and to compare these with current clinical guidelines.
Methods: A total of 6,536 newly-diagnosed patients with uncomplicated hypertension, aged ≥30
years, were identified from the representative 200,000-person sample in the computerized reimbursement database of the National Health Insurance in Taiwan. These patients were followed from 1998 to 2004 with all diagnoses, prescription data and medication charges being retrieved for subsequent analysis.
Results: Prescription patterns varied by age, gender and clinical facilities, with mono-therapies
being found to be dominant in the first year, albeit declining over time. Calcium channel blockers and beta-blockers were the most frequently prescribed antihypertensive drugs, either alone or in combinations. Although least expensive, the prescription rates of diuretics were low, at 8.3% for mono-therapies and 19.9% overall. The prescription rate for angiotensin receptor blockers (ARBs) was elevated considerably over time. After controlling for other related factors by multiple logistic regression analysis, ARBs were found to be prescribed mainly by medical centers or regional hospitals.
Conclusion: These findings indicate the existence of a gap between current clinical practice and
the desired goal of cost-effectiveness in antihypertensive treatment in Taiwan, which should be corrected.
Background
Hypertension, a leading contributor to the global burden of causes of disease, continues its upward growth trend
[1-4]. Poor control of this highly prevalent disease can lead to the development of ischemic heart disease, heart fail-ure, stroke and chronic renal insufficiency [3-7]. Along
Published: 18 June 2008
BMC Health Services Research 2008, 8:133 doi:10.1186/1472-6963-8-133
Received: 25 July 2007 Accepted: 18 June 2008 This article is available from: http://www.biomedcentral.com/1472-6963/8/133
© 2008 Liu and Wang; licensee BioMed Central Ltd.
This is an Open Access article distributed under the terms of the Creative Commons Attribution License (http://creativecommons.org/licenses/by/2.0), which permits unrestricted use, distribution, and reproduction in any medium, provided the original work is properly cited.
BMC Health Services Research 2008, 8:133 http://www.biomedcentral.com/1472-6963/8/133
Page 2 of 11 (page number not for citation purposes)
with its comorbidities, hypertensive related conditions have accounted for almost a third of the total causes of death in Taiwan in recent years [8]; in 2003 the total phar-maceutical expenditure on antihypertensive medication was US$0.32 billion, accounting for approximately 27% of the overall annual outpatient pharmaceutical expendi-ture on western-style medicines [9].
As a result of various clinical trials and studies, a range of clinical guidelines on antihypertensive treatment have been published over the past decade [10-15]. Based on clinical evidence and cost-effectiveness [16-18], guide-lines developed by the Joint National Committee (JNC) in the United States [11] and the National Institute for Health and Clinical Excellence (NICE) in the United King-dom [13] recommended that diuretics (particularly thi-azide-type diuretics) should be the drug of first choice for patients with no compelling indications. However, the results of various studies have shown that adherence to such clinical guidelines and recommendations are not at all uniform; indeed, they have been found to vary by time period and country, and by the characteristics of patients and physicians [19-23].
Taiwan's National Health Insurance (NHI) has not yet established a definite guideline for antihypertensive drug therapy. Given the enormous growth in healthcare expenditure within the NHI (from US$13.9 billion in 1997 to US$20.5 billion in 2005) [24] and the limited resources for healthcare, there is a clear need to explore physician practices, including prescription trends, in anti-hypertensive and other therapies [25,26].
The computerized reimbursement database of the NHI in Taiwan provides us with a valuable opportunity to assess the real practice patterns of antihypertensive pharmaceu-tical therapies. The NHI program, which is a mandatory nationwide health insurance system, was implemented in Taiwan in March 1995. Overall coverage continues to rise, from 96.2% in 2000 to 98.3% in 2006, and almost the entire population of Taiwan is now covered by the system [27]. Furthermore, in contrast to the NHI systems of many Western nations, patients in Taiwan are free to choose care providers in a competitive healthcare market.
The objectives of this study are to determine antihyperten-sive medication prescription patterns and time trends among newly-diagnosed cases of uncomplicated hyper-tension in Taiwan, to attempt to identify the determinants of the choice of first-line drug therapy, and to investigate the pharmaceutical costs associated with different antihy-pertensive agents.
Methods
Study population
This study uses a 200,000-person representative random sample from the computerized reimbursement database of the NHI, between January 1997 and December 2004. Details on the gender and date of birth of the patients, the date of prescription, commercial names of drugs, drug dosages/duration and costs for each prescription are recorded in the reimbursement files.
Patients initially identified were newly-diagnosed with essential hypertension on at least three occasions, were being treated for this condition, and had received their first antihypertensive medication between 1 January 1998 and 31 December 2004. In order to verify that a case was a new one, a period of at least one year was required (Jan-uary to December of 1997) without any treatment and/or diagnosis relating to hypertension.
To prevent potential confounding by comorbidities in the prescription patterns of antihypertensive agents at differ-ent clinical facilities, patidiffer-ents diagnosed with suspected diabetes mellitus, ischemic heart disease, diseases of pul-monary circulation, other forms of heart diseases (includ-ing dysrhythmia and heart failure), stroke or renal diseases were excluded from the sample. In order to ensure adherence to these criteria, any of the above diag-noses may not have appeared in any hospitalization file prior to the patient having been diagnosed as hyperten-sive, and the diagnoses may not have appeared more than three times in ambulatory outpatient files. We discarded those diagnoses appeared only once or twice in ambula-tory outpatient files to exclude suspected or uncertain cases where claims were filed to allow for further diagnos-tic examination.
Prescription patterns of new cases of hypertension All antihypertensive drug prescription records from ambulatory care claims and prescriptions dispensed at contracted pharmacies were retrieved and analyzed for our sample of newly-diagnosed patients aged ≥30 years. Patients were stratified by gender and age, with age being split into two sub-groups: the younger group (30–54 years of age) and the older group (≥55 years). The clinical facil-ities were classified into four types, medical centers, regional hospitals, local hospitals and primary care clin-ics, based upon the level of medical care provided and the size of the institution as recognized by the NHI.
Antihypertensive drugs were categorized according to the 1999 World Health Organization-International Society Hypertension Guidelines for the Management of Hyper-tension (WHO/ISH, 1999) and the Seventh Report of the Joint National Committee on Prevention, Detection, Eval-uation and Treatment of High Blood Pressure (JNC 7)
[10,11]. Six major categories of antihypertensive drugs generally are available, including angiotensin-converting enzyme (ACE) inhibitors, angiotensin receptor blockers (ARBs), beta-blockers, calcium channel blockers (CCBs), diuretics, and others (all other antihypertensive classes including alpha-blockers).
Prescriptions for a chronic disease in Taiwan, such as hypertension, most frequently involved the prescribing of drugs for 28- to 90-day periods, which would allow the patient visit a doctor every one to three months. Since each prescription may have contained different combina-tions of drugs and duracombina-tions of medication, analysis of the data was undertaken using the prescription rate as calcu-lated as the number of prescriptions containing a specific antihypertensive agent divided by the total number of pre-scriptions. A comparison of the prescription time trend was undertaken for each year, beginning with the first antihypertensive prescription. Daily drug costs, excluding all pharmacy service fees or other peripheral costs, were also calculated for each prescription. The drug costs are set by the Bureau of NHI and universally applied to clinical facilities regardless of their sizes.
Statistical analysis
After being weighted by duration of medication, daily drug costs are expressed as time-weighted means, while other results are expressed as means ± standard deviation (SD). The Chi-square test was carried out to determine the statistical significance of the differences between the pre-scription rates, with the Cochran-Armitage test also per-formed to assess the linear time trends over the sample period from the time of the initial treatment. Means of daily drug costs were compared using the Student t-test. Finally, multiple logistic regression analysis was per-formed to identify possible influential factors as a result of the prescribing of a single class of antihypertensive medi-cation as a mono-therapy. SAS version 9.1 for Windows was used for the analysis of all of the data in this study. All tests were two-sided, and a p-value of <0.05 was consid-ered statistically significant. Whenever multiple compari-sons were performed, Bonferroni adjustments were made accordingly.
Results
The dataset contained a total of 15,835 patients over the age of 30 years who had received their initial dose of anti-hypertensive drugs for essential hypertension between 1 January 1998 and 31 December 2004. Of this total, 9,299 were excluded on the basis that one or more earlier comorbidities had been recorded. We were therefore left with a total of 6,536 patients and 178,754 prescriptions for antihypertensive agents for subsequent analysis.
Of the total sample of 6,536 patients, 3,268 (50.0%) were women and 49.3% were ≥55 years old, with a mean of 55.9 and SD of 12.3 years. The mean follow-up duration after the first prescription of antihypertensive medication was 42.8 ± 27.2 months, while the average number of overall prescriptions was 27.3 ± 26.0. Each prescription included 1.64 ± 0.84 antihypertensive drugs prescribed for an average period of 22.3 ± 10.5 days. The mean number of actual medical visits over the entire period of study was 25.1 ± 24.5.
Antihypertensive prescriptions among newly-diagnosed patients
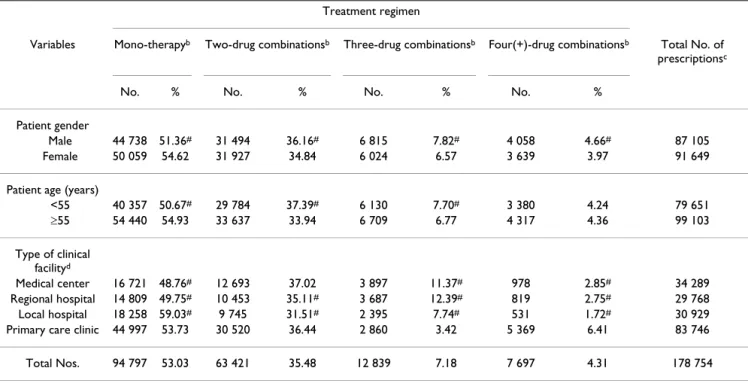
Over half of the prescriptions for newly-diagnosed cases of uncomplicated hypertension involved single antihy-pertensive drug therapy (n = 94,797; 53.0%), with women and older patients receiving more mono-therapies. Medi-cal centers and regional hospitals prescribed more combi-nation therapies, as compared with primary care clinics (Table 1). The percentage of mono-therapy treatments declined over time from the initial diagnosis, whereas there was a gradual increase in the percentage of combina-tion therapies (Figure 1). The 10 most frequently pre-scribed antihypertensive regimens, ranked in order of prescribing frequency, were as follows: CCBs (17.7%), beta-blockers (14.5%), ACEIs (8.2%), CCBs + beta-block-ers (7.7%), othbeta-block-ers (5.3%), diuretics (4.4%), CCBs + ACEIs (4.0%), ARBs (3.0%), CCBs + ARBs (2.6%), beta-blockers + diuretics (2.4%).
A summary of the total number of prescriptions for the different categories of antihypertensive drugs is provided in Table 2, where it is shown that the most frequently pre-scribed antihypertensive agents were CCBs (n = 92,574; 51.8%), with beta-blockers as the second most frequently prescribed, followed by ACE inhibitors, diuretics, others and ARBs.
The prescription rate for ARBs, which was the highest in medical centers (22.6%), was almost five times the rate for primary care clinics, and was also higher than the prescrip-tion rate for ACE inhibitors and diuretics. There was an increase with time in the number of prescriptions for ARBs, CCBs and diuretics, whereas the number of pre-scriptions for ACE inhibitors remained stable (Figure 2).
Mono-therapies for new cases of uncomplicated hypertension
Among all of the mono-therapy prescriptions, the most frequently prescribed antihypertensive agents were CCBs (n = 31,711; 33.5%) and beta-blockers (n = 25,835; 27.3%). Older patients (aged over 55 years) were treated with CCBs more often than younger patients, with beta-blockers being more frequently prescribed among the lat-ter group.
BMC Health Services Research 2008, 8:133 http://www.biomedcentral.com/1472-6963/8/133
Page 4 of 11 (page number not for citation purposes)
The prescription rates for beta-blockers were higher among women and younger patients (p < 0.0001), while the prescription rates for diuretics were higher among women and older patients (p < 0.0001). In contrast, ACE inhibitors and ARBs were more frequently prescribed for younger patients. Medical centers and regional hospitals were found to have prescribed ARBs much more often than primary care clinics (p < 0.0001), where the prescrib-ing of ACE inhibitors was found to be much more com-mon (p < 0.0001) (Table 3).
With the passage of time from the date of the initial ther-apy, there was a significant increase in the prescription rate for ARBs, from 3.8% in the first year to 10.3% in the seventh year (p < 0.0001). There was also an increase over time in mono-therapies comprising diuretics; however, there was a reduction over time in the trends for mono-therapies involving beta-blockers or ACE inhibitors (p < 0.0001). The time trends for mono-therapies are summa-rized in Figure 3.
Daily drug costs for different antihypertensive mono-therapies
The daily costs for mono-therapy medication, in order from low to high, are as follows. Diuretics were the
cheap-est with a mean of US$0.17, followed by beta-blockers (US$0.27) and others (US$0.28). The costs for CCBs and ACE inhibitors were almost the same (US$0.56), while the costs for ARBs, at a daily average of US$0.85, were about five times those of diuretics. With the exception of the class of 'other' drugs, the means of the daily drug costs did not vary significantly by gender, age or clinical facility.
Factors associated with initial ARB mono-therapy prescriptions
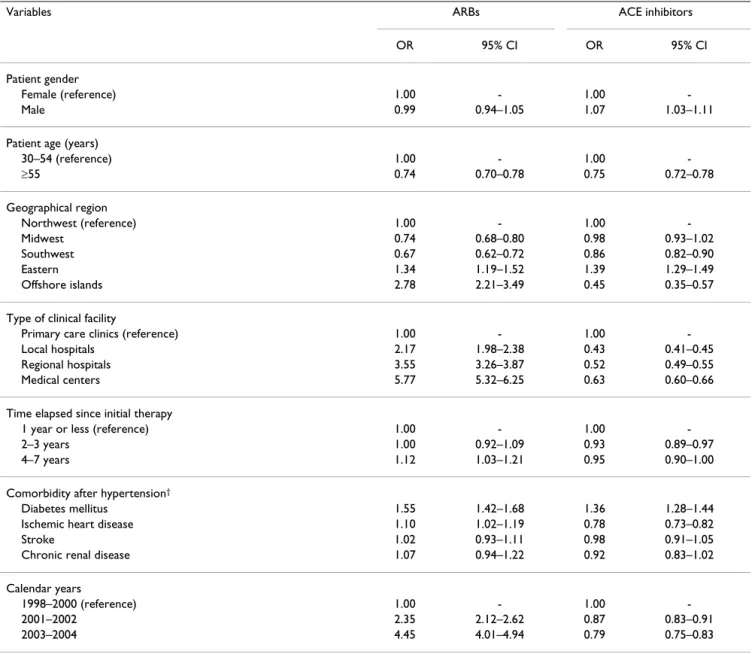
As Table 4 shows, following adjustment by multiple logis-tic regression analysis, those prescriptions involving ARBs as an antihypertensive mono-therapy were found to be associated with subsequent diagnoses of diabetes mellitus (odds ratio (OR) = 1.5; 95% CI: 1.4–1.7), regional hospi-tals (OR = 3.6, 95% CI: 3.3–3.9), medical centers (OR = 5.8, 95% CI: 5.3–6.2), and the period after the year 2001 (OR = 2.4 for 2001–2, and 4.5 for 2003–2004).
Discussion
This is one of the first studies of its kind to undertake an assessment of the national prescription patterns and time trends in Taiwan for antihypertensive medication for uncomplicated hypertension. We found that whether in mono-therapies or overall treatment, CCBs were the most
Prescription pattern time trends for combinations of mono-, two-, three- and four(+)-drug treatment therapies
Figure 1
Prescription pattern time trends for combinations of mono-, two-, three- and four(+)-drug treatment thera-pies. Note: * indicates p-value <0.0125 under the Cochran-Armitage trend test, being significant with Bonferroni adjustment
commonly prescribed drugs, followed by beta-blockers. Amongst all of the mono-therapies, the lowest average daily medication costs were for diuretics, at less than one third of the costs for CCBs or ACE inhibitors, and about one fifth of the costs for ARBs. The prescription rate for diuretics was, however, surprisingly low, accounting for only 8.3% of all mono-therapies, and indeed the diuretic prescription rate was the second lowest of all, only after ARBs (5.7%).
Beginning in 2006–7, the National Health Research Insti-tutes of Taiwan has begun to draft clinical guidelines for various health conditions, including the treatment of hypertension. However, most physicians seemed to accept the recommendation of the US JNC or the WHO/ISH guideline during the time of this study. The evidence-based clinical guidelines for antihypertensive treatment published by both the JNC in 2003 [11] and the NICE in 2004 [13] contained recommendations for low dosages of thiazide diuretics as the first-line drug for essential hyper-tension with no compelling indications. Such a recom-mendation also appeared in the 2003 statement published by the WHO/ISH [28]; and indeed, diuretics have been found to be the mainly prescribed class of
anti-hypertensive drugs in the United Kingdom, Denmark and the United States [20,29,30].
Researchers have indicated a substantial potential for cost savings if thiazides are prescribed rather than other more expensive drugs for treatment of hypertension [31,32]. Given that the prescription pattern in Taiwan appears to utilize more non-thiazide medications that are generally more expensive, this issue would be worthy of further study with the aim of comparing the cost-effectiveness of antihypertensive treatment in Taiwan with those of other countries.
Considerable variation in antihypertensive prescribing patterns exists internationally. Fretheim and colleagues compared the sale figures of antihypertensive drugs for six countries, reporting that thiazide diuretics accounted for 25% of consumption in the UK, while the corresponding figure for Norway was only 6% [30]. According to our assessment, thiazide diuretics accounted for 7.2% of over-all antihypertensive drugs prescribed for uncomplicated hypertension in Taiwan. The relatively low prescription rate of thiazides for antihypertensive treatment appears
Table 1: Prescription patterns of antihypertensive therapies for newly-diagnosed uncomplicated hypertension patients, 1998–2004a
Treatment regimen
Variables Mono-therapyb Two-drug combinationsb Three-drug combinationsb Four(+)-drug combinationsb Total No. of
prescriptionsc
No. % No. % No. % No. %
Patient gender
Male 44 738 51.36# 31 494 36.16# 6 815 7.82# 4 058 4.66# 87 105
Female 50 059 54.62 31 927 34.84 6 024 6.57 3 639 3.97 91 649
Patient age (years)
<55 40 357 50.67# 29 784 37.39# 6 130 7.70# 3 380 4.24 79 651 ≥55 54 440 54.93 33 637 33.94 6 709 6.77 4 317 4.36 99 103 Type of clinical facilityd Medical center 16 721 48.76# 12 693 37.02 3 897 11.37# 978 2.85# 34 289 Regional hospital 14 809 49.75# 10 453 35.11# 3 687 12.39# 819 2.75# 29 768 Local hospital 18 258 59.03# 9 745 31.51# 2 395 7.74# 531 1.72# 30 929
Primary care clinic 44 997 53.73 30 520 36.44 2 860 3.42 5 369 6.41 83 746
Total Nos. 94 797 53.03 63 421 35.48 12 839 7.18 7 697 4.31 178 754
Notes:
a Total sample number = 6 536 patients.
b No. refers to the number of prescriptions under each treatment regimen; % refers to the percentage of the total drugs prescribed under the four
treatment regimens.
c As a result of missing data, the sum of the total number of prescriptions over the four types of clinical facilities is smaller than the overall number
of prescriptions.
d Pairwise group comparisons are performed taking primary care clinics as the reference. # Significant p-value with the Bonferroni-adjusted α-level, p < 0.0025
BMC
He
alth Services Resea
rch 2 008 , 8 :133 http://ww w.b iomed central.com/1 472 -6 963 /8 /13 3 Pa ge 6 of 1 1 (page nu mber not for cit a tion pur poses)
Table 2: Distribution of antihypertensive drugs for newly-diagnosed uncomplicated hypertension patients, by gender, age and clinical facility, 1998–2004a
Class of drugb Total No. of prescriptionsb
Variables Diuretics Beta-blockers CCBsc ACE inhibitorsc ARBsc Others
No. % No. % No. % No. % No. % No. %
Patient gender
Male 15 525 17.82# 34 703 39.84# 46 468 53.35# 22 825 26.20# 10 635 12.21# 15 212 17.46# 87 105
Female 19 981 21.80 40 941 44.67 46 106 50.31 21 306 23.25 10 339 11.28 8 826 9.63 91 649
Patient age (years)
<55 13 556 17.02# 39 445 49.52# 40 270 50.56# 21 282 26.72# 10 421 13.08# 7 578 9.5# 79 651
≥55 21 950 22.15 36 199 36.53 52 304 52.78 22 849 23.06 10 553 10.65 16 460 16.61 99 103
Type of clinical facilityd
Medical center 7 729 22.54# 14 463 42.18# 18 675 54.46# 6 169 17.99# 7 764 22.64# 3 122 9.10# 34 289
Regional hospital 6 025 20.24 12 320 41.39# 17 058 57.30# 6 170 20.73# 5 637 18.94# 2 958 9.94# 29 768
Local hospital 5 005 16.18# 11 303 36.54# 17 849 57.71# 5 464 17.67# 3 594 11.62# 3 905 12.63# 30 929
Primary care clinic 16 745 19.99 37 540 44.83 38 988 46.56 26 322 31.43 3 966 4.74 14 053 16.78 83 746
Total Nos. 35 506 19.86 75 644 42.32 92 574 51.79 44 131 24.69 20 974 11.73 24 038 13.45 178 754
Notes:
a Total sample number = 6 536 patients.
b No. refers to the number of prescriptions for each class of drug; % refers to the percentage of the total prescriptions for the six classes of drugs. As a result of missing data, the sum of the total number
of prescriptions over the four types of clinical facilities is smaller than the overall number of prescriptions. The sum of the prescription rates for all six classes of drugs exceeds 100% because the average prescription contained more than one drug.
c CCBs = calcium channel blockers; ACE = angiotensin-converting enzyme; ARBs = angiotensin receptor blockers. d Pairwise group comparisons are performed taking primary care clinics as the reference.
similar to those of Norway and France, and is very differ-ent from that of the UK or Denmark.
In the absence of any guideline or effective regulations on prescribing behavior for clinicians, the current prescrip-tion pattern in Taiwan is probably a reflecprescrip-tion of the mixed effect of the preferences of physicians, the hypoten-sive efficacies of medications, and the tolerance levels of patients. Under a healthcare system of mixed conven-tional medicine and tradiconven-tional Chinese medicine, Tai-wanese patients appear to dislike diuretics for the treatment of hypertension possibly because of the label 'diuresis', a term generally regarded as treating 'edema' and affecting one's kidney function in traditional Chinese medicine. The mono-therapy prescription rate for diuret-ics, at less than 10%, albeit with a slightly increasing trend with the passage of time (as shown in Figures 2 and 3), also implies that diuretics are currently considered in Tai-wan to be only a second- or third-line medication; thus, there would appear to be considerable room for improve-ment, in terms of greater adherence to the existent clinical guidelines based on evidence as well as cost-effectiveness [16,18].
The trend toward increasing numbers of prescriptions involving ARBs, as summarized in Table 4, is also worthy of some attention. Indeed, the multiple logistic regression analysis indicated that the calendar year and the size of the clinical facility were actually the major determinants, although we deliberately restricted our subjects to those newly-diagnosed with uncomplicated hypertension and mono-therapies to prevent systematic differences in patients' characteristics. We have also found that primary care clinics prescribed diuretics more frequently than the larger medical facilities. We suspect that differences in cost consciousness may be an important contributor to this particular phenomenon, since the current reimbursement policy within the NHI program seems less restrictive on medical centers and regional hospitals, as compared with primary local clinics. Another possibility is that physicians in large medical facility are more frequently exposed to new drugs and tending to readily accept the latest, or most up-to-date, medications [33]. In fact, the number of ARBs on the market increased from 2 to 9 during the period of 1998–2004. Some studies suggest that promotional activ-ities of pharmaceutical industry have a major impact on physicians' prescribing patterns [34,35]. More evidence needs to be collected to corroborate these beliefs.
Prescription distribution time trends for antihypertensive agents
Figure 2
Prescription distribution time trends for antihypertensive agents. Note: * indicates p-value <0.0083 under the
BMC
He
alth Services Resea
rch 2 008 , 8 :133 http://ww w.b iomed central.com/1 472 -6 963 /8 /13 3 Pa ge 8 of 1 1 (page nu mber not for cit a tion pur poses)
Table 3: Distribution of mono-therapy antihypertensive drug prescriptions for newly-diagnosed uncomplicated hypertension patientsa
Class of drugb Total No. of prescriptionsb
Variables Diuretics Beta-blockers CCBsc ACE inhibitorsc ARBsc Others
No. % No. % No. % No. % No. % No. %
Patient gender
Male 2 974 6.65# 11 602 25.93# 14 881 33.26 7 004 15.66 2 561 5.72 5 716 12.78# 44 738
Female 4 849 9.69 14 233 28.43 16 830 33.62 7 619 15.22 2 822 5.64 3 706 7.40 50 059
Patient age (years)
<55 2 366 5.86# 13 627 33.77# 12 083 29.94# 7 134 17.68# 2 677 6.63# 2 470 6.12# 40 357
≥55 5 457 10.02 12 208 22.42 19 628 36.05 7 489 13.76 2 706 4.97 6 952 12.77 54 440
Type of clinical facilityd
Medical center 1 067 6.38# 4 474 26.76# 5 841 34.93# 2 255 13.49# 2 099 12.55# 985 5.89# 16 721
Regional hospital 1 026 6.93# 4 144 27.98 5 690 38.42# 1 710 11.55# 1 272 8.59# 967 6.53# 14 809
Local hospital 1 363 7.47# 4 171 22.84# 8 186 44.84# 1 728 9.46# 920 5.04# 1 890 10.35# 18 258
Primary care clinic 4 367 9.71 13 043 28.99 11 991 26.65 8 927 19.84 1 089 2.42 5 580 12.40 44 997
Total Nos. 7 823 8.25 25 835 27.25 31 711 33.45 14 623 15.43 5 383 5.68 9 422 9.94 94 797
Notes:
a Total sample number of prescriptions = 94 797.
b No. refers to the number of prescriptions for each class of drug; % refers to the percentage of the total prescriptions for the six classes of drugs. As a result of missing data, the sum of the total
number of prescriptions over the four types of clinical facilities is smaller than the overall number of prescriptions.
c CCBs = calcium channel blockers; ACE = angiotensin-converting enzyme; ARBs = angiotensin receptor blockers. d Pairwise group comparisons are performed taking primary care clinics as the reference.
One of the limitations of this study is the potential con-founding by severity of disease for different levels of clin-ical facilities. Because the NHI reimbursement database has no link to details on patients' blood pressure levels or laboratory data, we were unable to directly compare the severity of hypertension among various groups of patients. Nonetheless, we have limited our study subjects to newly diagnosed cases of uncomplicated hypertension with mono-therapies, and for them there is no restriction on selection of doctors under the NHI in Taiwan. In such a way, hypertensive patients initially treated at different clinical facilities might not be so much different in sever-ity. Moreover, Table 4 indicated that medical centers used more ARBs and less ACE inhibitors after adjustment for other determinants. As the efficacy of these two types of antihypertensive medication is similar [15], it seems that ARBs might be prescribed to substitute for some ACE inhibitors in medical centers or regional hospitals and this trend probably was unrelated to the different severity of hypertension.
The NHI database provides a 200,000-person sample rep-resenting almost 1% of the overall population of 22.9 mil-lion people in Taiwan; thus, we estimate that there may
have been up to 0.75 million newly-diagnosed cases of uncomplicated hypertension in Taiwan during the seven-year period of this study. If the daily drug costs for uncom-plicated hypertension could be reduced by an average of US$0.3–0.6, this would result in annual savings of up to US$82–163 million in overall pharmaceutical expendi-ture within Taiwan's NHI. If such action were extended to incorporate all prevalent cases of hypertension through-out Taiwan, the total amount of annual savings on costs for antihypertensive drugs could even run to US$0.2 bil-lion. Under the current limited resources, this could clearly make the NHI much more sustainable [26].
Conclusion
The initial prescription patterns for antihypertensive ther-apies for uncomplicated hypertension in Taiwan seem to be inconsistent with the current international clinical guidelines. Although diuretics are the least expensive class of antihypertensive drugs, they are nevertheless being used as a second- or third-line method of medication, with a notably low prescription rate. There has been a growing trend in the prescribing of ARBs as the initial choice of therapy for uncomplicated hypertension, partic-ularly in medical centers and regional hospitals. These
Time trends for single-drug antihypertensive treatment
Figure 3
Time trends for single-drug antihypertensive treatment. Note: * indicates p-value <0.0083 under the
BMC Health Services Research 2008, 8:133 http://www.biomedcentral.com/1472-6963/8/133
Page 10 of 11 (page number not for citation purposes)
results indicate a need for greater awareness of the evi-dence-based guidelines for antihypertensive drug therapy amongst physicians and the general public.
Given the existence of the national health insurance sys-tem in Taiwan, there is still significant room for improve-ment in the cost-effectiveness of antihypertensive treatment [16,25]. We recommend reaching a consensus on this matter and developing a domestic clinical guide-line taking cost-effectiveness into consideration as soon as possible.
Competing interests
The authors confirm that they have no interests which might be perceived as giving rise to any form of bias or conflict of interest.
Authors' contributions
Both authors formulated the research question and design of the study. P–HL carried out the study and J–DW advised on the analyses. P–HL drafted the manuscript, and both authors critically revised it. Both authors read and approved the final manuscript.
Table 4: Multiple logistic regression estimates of ARB and ACE inhibitor mono-therapy prescription characteristics for newly-diagnosed uncomplicated hypertension patients, 1998–2004*
Variables ARBs ACE inhibitors
OR 95% CI OR 95% CI
Patient gender
Female (reference) 1.00 - 1.00
-Male 0.99 0.94–1.05 1.07 1.03–1.11
Patient age (years)
30–54 (reference) 1.00 - 1.00 -≥55 0.74 0.70–0.78 0.75 0.72–0.78 Geographical region Northwest (reference) 1.00 - 1.00 -Midwest 0.74 0.68–0.80 0.98 0.93–1.02 Southwest 0.67 0.62–0.72 0.86 0.82–0.90 Eastern 1.34 1.19–1.52 1.39 1.29–1.49 Offshore islands 2.78 2.21–3.49 0.45 0.35–0.57
Type of clinical facility
Primary care clinics (reference) 1.00 - 1.00
-Local hospitals 2.17 1.98–2.38 0.43 0.41–0.45
Regional hospitals 3.55 3.26–3.87 0.52 0.49–0.55
Medical centers 5.77 5.32–6.25 0.63 0.60–0.66
Time elapsed since initial therapy
1 year or less (reference) 1.00 - 1.00
-2–3 years 1.00 0.92–1.09 0.93 0.89–0.97
4–7 years 1.12 1.03–1.21 0.95 0.90–1.00
Comorbidity after hypertension†
Diabetes mellitus 1.55 1.42–1.68 1.36 1.28–1.44
Ischemic heart disease 1.10 1.02–1.19 0.78 0.73–0.82
Stroke 1.02 0.93–1.11 0.98 0.91–1.05
Chronic renal disease 1.07 0.94–1.22 0.92 0.83–1.02
Calendar years
1998–2000 (reference) 1.00 - 1.00
-2001–2002 2.35 2.12–2.62 0.87 0.83–0.91
2003–2004 4.45 4.01–4.94 0.79 0.75–0.83
Notes:
* The odds ratio (OR) for each variable was adjusted for all other variables listed in the table.
Acknowledgements
This study was supported by a grant from the Department of Health, Exec-utive Yuan of Taiwan to establish the National Center of Excellence for Clinical Trial and Research at the National Taiwan University Hospital (DOH96-TD-B-111-001). We are grateful to Lynda M. Ewers and Tzu-Hao Ho for important recommendations and Chao-Wan Huang for her assist-ance of editing the tables. We would also like to acknowledge the peer-reviewers, Joel Lexchin, Atle Fretheim, and Ludwig A. Hothorn, for their valuable comments and critiques.
References
1. Ezzati M, Lopez AD, Rodgers A, Hoorn S Vander, Murray CJ: Selected major risk factors and global and regional burden of disease. Lancet 2002, 360:1347-1360.
2. Elliott WJ: The economic impact of hypertension. J Clin
Hyper-tens 2003, 5:3-13.
3. Wolf-Maier K, Cooper RS, Kramer H, Banegas JR, Giampaoli S, Joffres MR, Poulter N, Primatesta P, Stegmayr B, Thamm M: Hypertension treatment and control in five European countries, Canada, and the United States. Hypertension 2004, 43:10-17.
4. Sharma AM, Wittchen HU, Kirch W, Pittrow D, Ritz E, Goke B, Leh-nert H, Tschope D, Krause P, Hofler M, Pfister H, Bramlage P, Unger T: High prevalence and poor control of hypertension in pri-mary care: cross-sectional study. J Hypertens 2004, 22:479-486. 5. Sowers JR, Epstein M, Frohlich ED: Diabetes, hypertension, and cardiovascular disease: an update. Hypertension 2001, 37:1053-1059.
6. Levy D, Larson MG, Vasan RS, Kannel WB, Ho KK: The progres-sion from hypertenprogres-sion to congestive heart failure. JAMA 1996, 275:1557-1562.
7. Singh RB, Suh IL, Singh VP, Chaithiraphan S, Laothavorn P, Sy RG, Babilonia NA, Rahman AR, Sheikh S, Tomlinson B, Sarraf-Zadigan N: Hypertension and stroke in Asia: prevalence, control and strategies in developing countries for prevention. J Hum
Hypertens 2000, 14:749-763.
8. Department of Health (Taiwan): Cause of Death Statistics. [http://www.doh.gov.tw/ufile/doc/causesofdeath.pdf].
9. Bureau of National Health Insurance (Taiwan): Quality of antihy-pertensive drug therapy at outpatient clinics. [http:// www.nhi.gov.tw/webdata/AttachFiles/
Attach_2193_2_hypertension.pdf]. (in Chinese, accessed on 16 April 2007)
10. 1999 World Health Organization-International Society of
Hypertension Guidelines for the Management of Hyperten-sion. J Hypertens 1999, 17:151-183.
11. Chobanian AV, Bakris GL, Black HR, Cushman WC, Green LA, Izzo JL Jr, Jones DW, Materson BJ, Oparil S, Wright JT Jr, Roccella EJ: The Seventh Report of the Joint National Committee on Preven-tion, DetecPreven-tion, EvaluaPreven-tion, and Treatment of High Blood Pressure: the JNC 7 report. JAMA 2003, 289:2560-2572. 12. European Society of Hypertension-European Society of Cardiology
Guidelines Committee: 2003 European Society of Hyperten-sion-European Society of Cardiology guidelines for the man-agement of arterial hypertension. J Hypertens 2003, 21:1011-1053.
13. National Institute for Health and Clinical Excellence: Essential hypertension: managing adult patients in primary care. [http://www.nice.org.uk/nicemedia/pdf/CG18background.pdf]. 14. Williams B, Poulter NR, Brown MJ, Davis M, McInnes GT, Potter JF,
Sever PS, Thom SM: British Hypertension Society guidelines for hypertension management 2004 (BHS-IV): summary. BMJ 2004, 328:634-640.
15. National Institute for Health and Clinical Excellence: Management of hypertension in adults in primary care: partial update. [http://www.nice.org.uk/guidance/CG34/guidance/pdf/English]. 16. Neal WW: Reducing costs and improving compliance. Am J
Cardiol 1989, 63:17B-20B.
17. Psaty BM, Lumley T, Furberg CD, Schellenbaum G, Pahor M, Alder-man MH, Weiss NS: Health outcomes associated with various antihypertensive therapies used as first-line agents: a net-work meta-analysis. JAMA 2003, 289:2534-2544.
18. Mason J, Eccles M, Freemantle N, Drummond M: A framework for incorporating cost-effectiveness in evidence-based clinical practice guidelines. Health Policy 1999, 47:37-52.
19. Bog-Hansen E, Lindblad U, Ranstam J, Melander A, Rastam L: Antihy-pertensive drug treatment in a Swedish community: Skara-borg Hypertension and Diabetes Project. Pharmacoepidemiol
Drug Saf 2002, 11:45-54.
20. Ma J, Lee KV, Stafford RS: Changes in antihypertensive prescrib-ing durprescrib-ing US outpatient visits for uncomplicated hyperten-sion between 1993 and 2004. Hypertenhyperten-sion 2006, 48:846-852. 21. Campbell NR, Tu K, Brant R, Duong-Hua M, McAlister FA: The
impact of the Canadian Hypertension Education Program on antihypertensive prescribing trends. Hypertension 2006, 47:22-28.
22. Siegel D, Lopez J: Trends in antihypertensive drug use in the United States: do the JNC V recommendations affect pre-scribing? Fifth Joint National Commission on the Detection, Evaluation, and Treatment of High Blood Pressure. JAMA 1997, 278:1745-1748.
23. Guo JD, Liu GG, Christensen DB, Fu AZ: How well have practices followed guidelines in prescribing antihypertensive drugs: the role of health insurance. Value Health 2003, 6:18-28. 24. Department of Health (Taiwan): Expenditure for Health, 1991–
2005. [http://www.doh.gov.tw/ufile/doc/9401.xls].
25. Degli Esposti L, Valpiani G: Pharmacoeconomic burden of
undertreating hypertension. Pharmacoeconomics 2004,
22:907-928.
26. Cheng LJ, Wang JD: Is cost-effectiveness analysis necessary for national health insurance? J Formos Med Assoc 2006, 105:1031-1035.
27. Department of Health (Taiwan): Essential Statistical Data of National Health Insurance. [http://www.doh.gov.tw/statistic/ english/5-2/1.xls].
28. Whitworth JA: 2003 World Health Organization (WHO)/ International Society of Hypertension (ISH) statement on management of hypertension. J Hypertens 2003, 21:1983-1992. 29. Walley T, Duggan AK, Haycox AR, Niziol CJ: Treatment for newly
diagnosed hypertension: patterns of prescribing and antihy-pertensive effectiveness in the UK. J R Soc Med 2003, 96:525-531.
30. Fretheim A, Oxman AD: International variation in prescribing antihypertensive drugs: its extent and possible explanations.
BMC Health Serv Res 2005, 5:21.
31. Fretheim A, Aaserud M, Oxman AD: The potential savings of using thiazides as the first choice antihypertensive drug: cost-minimisation analysis. BMC Health Serv Res 2003, 3:18. 32. Xu KT, Moloney M, Phillips S: Economics of suboptimal drug
use: cost-savings of using JNC-recommended medications for management of uncomplicated essential hypertension.
Am J Manag Care 2003, 9:529-536.
33. Manolio TA, Cutler JA, Furberg CD, Psaty BM, Whelton PK, Apple-gate WB: Trends in pharmacologic management of hyperten-sion in the United States. Arch Intern Med 1995, 155:829-837. 34. Wang TJ, Ausiello JC, Stafford RS: Trends in antihypertensive
drug advertising, 1985–1996. Circulation 1999, 99:2055-2057. 35. Goodman B: Do drug company promotions influence
physi-cian behavior? West J Med 2001, 174:232-233.
Pre-publication history
The pre-publication history for this paper can be accessed here:
http://www.biomedcentral.com/1472-6963/8/133/pre pub