國 立 交 通 大 學
電 控 工 程 研 究 所
碩 士 論 文
利用 3D 顯示平台探討視調節微動與視覺疲勞
之研究
Research of Accommodative Microfluctuations Caused by
Visual Fatigue Based on 3D Display Platforms
研 究 生:湯 禹 舜
指導教授:歐 陽 盟
.
利用 3D 顯示平台探討視調節微動與視覺疲勞之研究
Research of Accommodative Microfluctuations
Caused by Visual Fatigue Based on 3D Display Platforms
研 究 生:湯禹舜 Student:Yu-Shun Tang 指導教授:歐陽盟 Advisor:Mang Ou-Yang 國 立 交 通 大 學 電 控 工 程 研 究 所 碩 士 論 文 A Thesis
Submitted to Institute of Electrical Control Engineering College of Electrical Engineering
National Chiao Tung University in partial Fulfillment of the Requirements
for the Degree of Master
in
Electrical Control Engineering
Oct 2012
Hsinchu, Taiwan, Republic of China
利 用 3D顯 示 平 台 探 討 視 調 節 微 動 與 視 覺 疲 勞 之 研 究
研究生:湯禹舜 指導教授:歐陽盟 教授 國立交通大學電控工程研究所
摘要
不同的色彩與影像表現對於人眼造成不同程度的視覺疲勞。本研究主 要利用視調節微動之高頻成分頻譜功率(Spectral Power of High Frequency Component of Accommodative Microfluctuations)為客觀指標來進行視覺疲勞 分析來探討顯示器色彩形成方法、3D顯示技術、光源以及個人差異對於視 覺疲勞的影響,並利用問卷法做為主觀評估。其中顯示器色彩形成方法為 分 時 形 成 法 (Time Sharing Method) 與 空 間 組 成 法 (Spatial Formation Method);3D顯示為快門式眼鏡(Shutter Glasses)與偏光式眼鏡(Polarized Glasses);光源為發光二極體之背光源(LED Backlight)與發光二極體(LED) 與雷射二極體(LD)之混合光源。目前已知分時形成法有可能產生色分裂 (Color Break-Up)使人眼容易產生疲勞。 研究中利用快閃式3D LCD TV、偏光式3D LCD TV與雷射投影機作為 研究之對象。一開始受測者先進行辨色力測驗,觀看3D影片與2D影片進行 人眼刺激於同一視距、不同觀看時間,在觀看顯示器前後均利用睫狀體調 節微動分析儀紀錄受測者視調節微動情形並填寫主觀評量問卷。最後以變 異數分析與t檢定來分析與比較。實驗結論為(1)3D影片給予人眼的負擔大於 2D影片(p<0.001)。(2)快閃式眼鏡造成的負擔大於偏光式眼鏡(p=0.012)。(3) 分時形成法給予的負擔大於空間形成法(p=0.008)。(4)LED背光給予的負擔 與LED與LD混光源無差別(p=0.162)。(5)整體來說,辨色力普通者負擔大於 辨色力較好者(p<0.001),而在觀看2D影片於LCD TV以及使用偏光視眼鏡觀 看3D影片之後,兩者的視覺不適感程度一樣。(6) HFC確實可以客觀地評估 視覺系統運作後生理上的緊繃及壓迫程度,進而評估視覺疲勞。 本研究已初步將不同色彩與影像的表現方法與視覺疲勞之關係建立出 來,未來除了改變實驗中之參數進行更深入的研究,並將以前瞻即時監測 裝置來實現,達成視覺疲勞之即時監測。
Research of Accommodative Microfluctuations Caused by Visual
Fatigue Based on 3D Display Platforms
Student: Yu-Shun Tang Advisor: Mang Ou-Yang
Institute of Electrical and Control Engineering National Chiao Tung University
Abstract
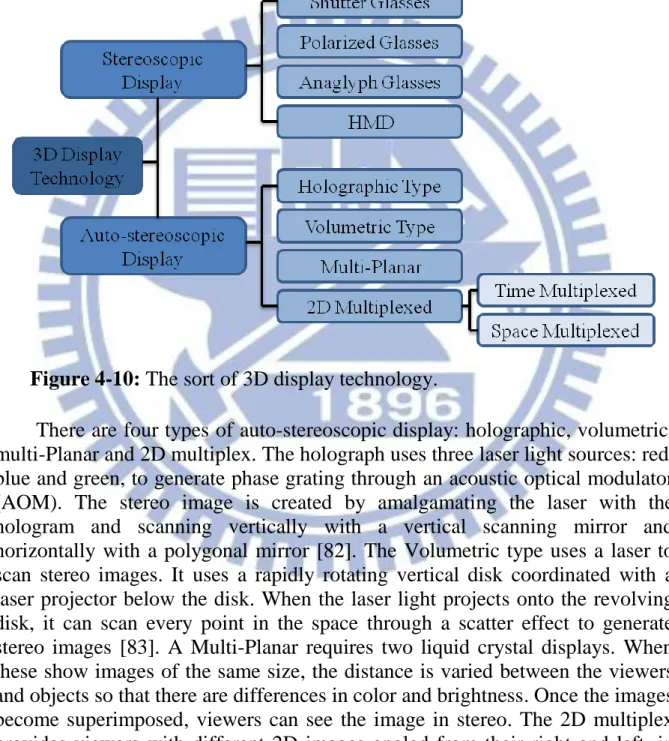
The appearance of different colors and images causes different levels of visual fatigue in the human eye. Research uses the spectral power of high frequency component of accommodative microfluctuations as a major objective indicator for analyzing the effects of visual fatigue through color formation methods, 3D display technologies, light sources and individual differences. A questionnaire is used as a subjective indicator. Color formation methods involved in the research are time sharing and spatial formation method, and the 3D display technologies use shutter and polarized glasses; Light sources are light emitting diode (LED) backlights and mixed LED and laser diode (LD) lights. So far the color break-up from time sharing method has been known to make human eyes tire easily.
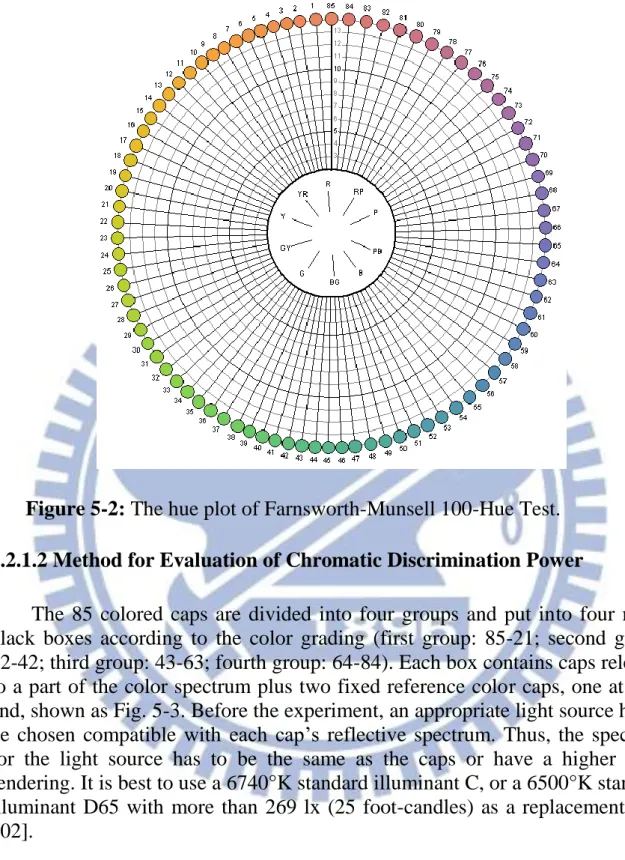
This research used devices such as: a shutter 3D LCD TV, a polarized 3D LCD TV and a laser projector. Firstly, the subjects’ color discrimination was examined by the hue test, and then, at another time, by viewing 3D and 2D videos at the same visual range to stimulate the eyes. Before and after the experiment the subjects’ accommodative microfluctuations were measured by the auto refract-keratometer, and then a questionnaire was filled in. Finally the analysis of variance (ANOVA) and a t-test were used for analysis.
Conclusions are: (1) 3D videos afflict greater visual fatigue than 2D videos (p<0.001). (2) The shutter glasses afflict more visual fatigue than the polarized glasses (p=0.012). (3) Time sharing method afflicts greater visual fatigue more than spatial formation method (p=0.008). (4) There is no difference between the LED backlight and mixed LED and LD lights (p=0.162). (5) In general, people with normal color discrimination have more visual fatigue than those with the good (p<0.001), but the visual discomfort are the same on LCD TVs and polarized system. (6) The HFC can evaluate the physiological stress or strain by overexerting the visual system, which then leads to visual fatigue.
Rudimentary relationships have been found between different colors and images appearances and visual fatigue. However, more detailed research is required using different parameters, and visual fatigue could be monitored with the development of an advanced real-time sensor.
Acknowledgement
在研究所兩年之碩士生涯,非常感謝指導教授 歐陽盟博士不辭辛勞指 導我的研究方向,時時給予鼓勵與支持而讓我保有動力來解決研究過程中 所遇到之問題,才能順利完成本論文研究。 感謝 邱俊誠博士、段正仁博士、柯美蘭博士、黃國華博士在繁忙之中 願意擔任學生之口試委員,在口試當天提供相當多寶貴意見讓學生可以清 楚瞭解本研究可以改善之處,提升本論文之品質。 接著也要感謝實驗室博士後學長庭緯、博班學長耀方、昱達與偉德, 不論在課業與研究上面均給予我指導與意見,以及碩士班學長建成與智 翔,給予研究之建議以及方法;碩士班同學與學弟誌賢、子賢、新淼、幸 璁、冠亨、益群、浩志、胤源、碧秀、俊誠、劉穎在實驗上面給予我許多 支援,以及處理研究相關之大小事,還有女友銘慧的支持鼓勵與陪伴,讓 我在研究所兩年生涯可以過得非常充實以及順利。 還有感謝父母在於金錢以及精神上的鼓勵與支持,得以進入研究所學 習更深入之專業技能,讓我可以提升自己,對於在未來踏入競爭如此激烈 之社會,有非常大的幫助。因此在未來進入社會階段,必須持續保有一顆 感恩的心不斷的提升自己、努力向上,使得自己在社會上可以出人頭地, 以報答父母之恩惠。Content
摘要 ... i
Abstract ... ii
Acknowledgement ... iii
List of Figures ... vi
List of Tables ... viii
Chapter 1 Introduction ... 1
Chapter 2 Visual Fatigue ... 3
2.1 Visual Process ... 3
2.2 Definition and Sources of Visual Fatigue ... 6
2.3 Indicators and Methods for Measuring Visual Fatigue ... 7
2.3.1 Accommodation Power ... 7
2.3.2 Pupil Diameter ... 8
2.3.3 Visual Acuity ... 8
2.3.4 Eye Movement Velocity ... 9
2.3.5 Critical Fusion Frequency ... 10
2.3.6 Visual Task Performance ... 10
2.3.7 Subjective Rating of Visual Fatigue ... 11
2.3.8 Brain Activity Measurements ... 11
2.4 Comparisons of indicators ... 12
Chapter 3 Accommodative Microfluctuations ... 15
3.1 Phenomena of Accommodative Microfluctuations ... 15
3.2 The Power Spectrum of Accommodative Microfluctuations ... 16
3.3 Relationship between Accommodative Microfluctuations and Visual Fatigue .. 16
3.4 Automatic Refractor-Keratometer ... 18
3.5 Comparisons between the HFC and other Indicators ... 19
Chapter 4 Methods for Color and Image Formation of Displays... 21
4.1 Color Formation Methods ... 21
4.1.1 Digital Light Processing ... 22
4.1.2 Liquid Crystal Display ... 25
4.2 3D Display Technologies ... 28
4.2.1 Shutter Glasses ... 30
4.2.2 Polarized Glass ... 31
4.3 Light Sources ... 33
4.3.1 Laser Diode ... 33
4.3.2 Light Emitting Diode ... 33
Chapter 5 Experiments ... 36
5.1 Purpose ... 36
5.2 Experimental Equipment ... 36
5.2.1 Displays and the Farnsworth-Munsell 100-Hue Test ... 36
5.2.2 Auto Refract-keratometer: Speedy-K Ver. MF-1 ... 40
5.3 Experimental Content ... 42
5.3.1 Experimental Design ... 42
5.3.2 Subjects ... 43
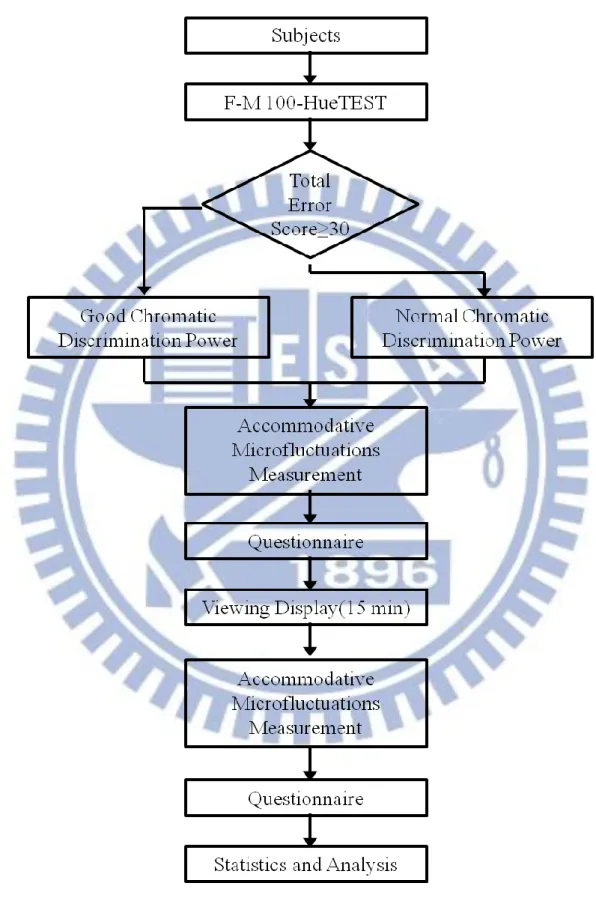
5.3.3 Experimental Process ... 44
Chapter 6 Results and Analysis ... 47
6.1 Results ... 47
6.2 Analysis Method ... 54
6.3 Analysis ... 54
6.3.1 Analysis of the Objective Indicator (△HFC) ... 54
6.3.2 Analysis of the Subjective Indicator (Questionnaire Method) ... 58
6.4 Comparison between the results by the Objective and the Subjective ... 70
Chapter 7 Discussions, Conclusions, and Future Works ... 72
7.1 Discussions ... 72 7.2 Conclusions ... 74 7.3 Future Works ... 74 References ... 76 Appendix 1 ... 81 Publications ... 82
List of Figures
Chapter 2
Figure 2-1: Anatomy of the eye [8]. ... 4
Figure 2-3: The perceive spectrum of human eye. ... 5
Figure 2-4: The spectra of human cone cells [9]. ... 5
Figure 2-5: The binocular parallax and motion parallax. ... 5
Chapter 3 Figure 3-1: The HFC of normal subjects [44]. ... 17
Figure 3-2: The HFC of subjects with asthenopia [44]. ... 18
Figure 3-3: The target in the auto refract-keratometer. ... 19
Chapter 4 Figure 4-1: The concept of time sharing method. ... 22
Figure 4-2: The concept of spatial formation method. ... 22
Figure 4-3: The concept of overlay formation method. ... 22
Figure 4-4: The structure of DMD [74]. ... 23
Figure 4-5: The phenomenon of color break-up. ... 25
Figure 4-6: Different effects on visual fatigue by projectors [40]... 25
Figure 4-7: Different effects on visual fatigue by projectors. ... 26
Figure 4-8: The structure of color filters. ... 27
Figure 4-9: The geometrical combinations of color filters. ... 28
Figure 4-10: The sort of 3D display technology. ... 29
Figure 4-11: The theory of shutter glasses ... 31
Figure 4-12: The theory of linear polarized system. ... 32
Figure 4-13: The theory of circular polarized system. ... 32
Chapter 5 Figure 5-1: The model for normal human color vision. [101]. ... 37
Figure 5-2: The hue plot of Farnsworth-Munsell 100-Hue Test. ... 38
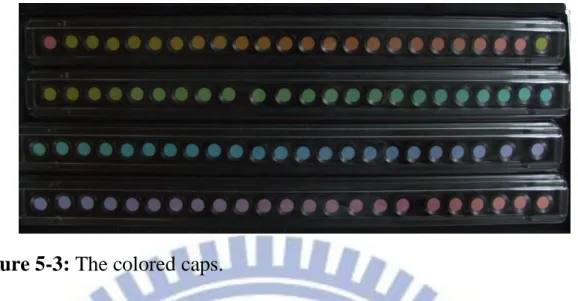
Figure 5-3: The colored caps. ... 39
Figure 5-4: The error arrangement of caps. ... 39
Figure 5-5: Auto Refract-keratometer: Speedy-K Ver. MF-1 ... 41
Figure 5-6: The accommodative microfluctuations of ciliary body. ... 41
Figure 5-8: The flow chart of experimental process. ... 45 Figure 5-9: Three displays are (a) shutter 3D LCD TV (b) polarized 3D LCD TV (c) laser
projector ... 46
Chapter 6
Figure 6-1: The result of the questionnaires from 10 subjects. The outer point means that
discomfort level caused by the mode is more serious. ... 59
Figure 6-2: The scores of symptoms in each mode. The outer point means that discomfort
level of the symptom is more serious. The symptoms of numbers are: (1)
eyestrain, (2) dry eyes, (3) too bright, (4) eyelid twitching, (5) feeling of pressure in the eyes, (6) ache behind the eyes, (7) blurred vision, (8) headache (9) head feels heavy, (10) head hurts when shaken (11) dazed feeling, (12) irritated feeling, (13) stiff shoulders, (14) sleepy feeling and (15) difficulty concentrating. ... 60
Figure 6-3: The total ranking for mean scores of each mode. ... 61 Figure 6-4: The mean total ranking for mean scores under 3D/2D mode (white), LCD/DLP
(gray) and shutter/polarized (black). ... 62
Figure 6-5: The mean total ranking for scores of all subjects (white), subjects under 3D mode
(gray) and 2D mode (dark gray) grouped by chromatic discrimination. ... 63
Figure 6-6: The mean total ranking for scores of subjects under shutter system (white) and
polarized system (gray) grouped by chromatic discrimination. ... 64
Figure 6-7: The mean total ranking for scores of subjects under LCD (white) and DLP (gray)
grouped by chromatic discrimination power. ... 65
Figure 6-8: The comparison between the mean score of each symptom and the mean scores
of 15 symptoms. The symptoms of numbers are: (1) eyestrain, (2) dry eyes, (3) too bright, (4) eyelid twitching, (5) feeling of pressure in the eyes, (6) ache behind the eyes, (7) blurred vision, (8) headache (9) head feels heavy, (10) head hurts when shaken (11) dazed feeling, (12) irritated feeling, (13) stiff shoulders, (14) sleepy feeling and (15) difficulty concentrating. ... 66
Figure 6-9: The mean total ranking for mean scores under 3D/2D mode (white), LCD/DLP
(gray) and shutter/polarized (black) by 6 major symptoms. ... 67
Figure 6-10: The mean total ranking for scores by 6 major symptoms of all subjects (white),
subjects under 3D mode (gray) and 2D mode (dark gray) grouped by chromatic discrimination. ... 68
Figure 6-11: The mean total ranking for scores by 6 major symptoms of subjects under
shutter system (white) and polarized system (gray) grouped by chromatic
discrimination. ... 69
Figure 6-12: The mean total ranking for scores by 6 major symptoms of subjects under LCD
(white) and DLP (gray) grouped by chromatic discrimination power. ... 70
List of Tables
Chapter 2
Table 2-1: The comparisons of eight indicators. ... 13
Chapter 3 Table 3-1: The HFC of subjects in different distances of target. The “-” means no fatigue; the “+” means fatigue [2]. ... 18
Chapter 5 Table 5-1: The symptoms of visual fatigue. ... 43
Table 5-2: The ages and color discrimination of 10 subjects. ... 44
Table 5-3: The displays and modes used in experiment. ... 46
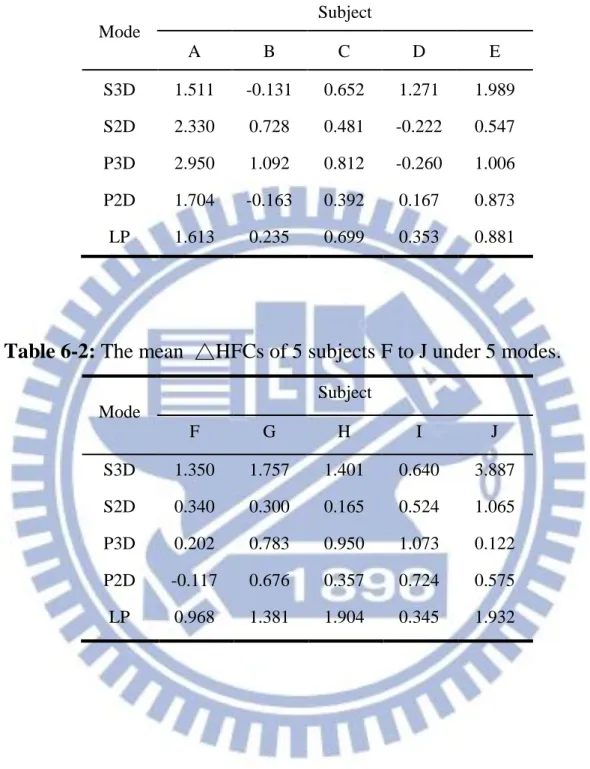
Chapter 6 Table 6-1: The mean △HFCs of 5 subjects A to E under 5 modes. ... 48
Table 6-2: The mean △HFCs of 5 subjects F to J under 5 modes. ... 48
Table 6-3: The scores of the subject A by subjective questionnaire under each mode ... 49
Table 6-4: The scores of the subject B by subjective questionnaire under each mode ... 49
Table 6-5: The scores of the subject C by subjective questionnaire under each mode ... 50
Table 6-6: The scores of the subject D by subjective questionnaire under each mode ... 50
Table 6-7: The scores of the subject E by subjective questionnaire under each mode ... 51
Table 6-8: The scores of the subject F by subjective questionnaire under each mode ... 51
Table 6-9: The scores of the subject G by subjective questionnaire under each mode ... 52
Table 6-10: The scores of the subject H by subjective questionnaire under each mode ... 52
Table 6-11: The scores of the subject I by subjective questionnaire under each mode... 53
Table 6-12: The scores of the subject J by subjective questionnaire under each mode ... 53
Table 6-13: The ANOVA for mode and distances of target. ... 54
Table 6-14: The t-test for distance of target above 2M and under 2M ... 55
Table 6-15: The t-test for each mode. ... 56
Table 6-16: The t-test for 3D/2D(with LP), 3D/2D(without LP), DLP/LCD and shutter/polarized. ... 57
Table 6-17: The t-test for LED backlight and mixed LED and LD lights. ... 57
Table 6-18: The t-test for chromatic discrimination under each condition. ... 58
Chapter 1 Introduction
As technology advances, many displays such as liquid crystal, projections display, plasma panels and 3D displays are used in our daily lives. Although enriching to the visual sense, various displays afflict eyes with symptoms such as dry eye, visual fatigue, eye ache and blurred vision due to drawbacks such as electromagnetic radiation and high luminance, and poor habits such as gazing at objects for a prolonged time or at short range. It is an important to find factors that cause visual fatigue in order to protect the eyes.
Currently visual fatigue is a common affliction because people frequently view displays for a long time. As these stimulate the eyes continuously, they also cause a great number of visual problems. Therefore, it is worth discussing the effects of such displays on people’s vision.
From a visual standpoint, displays can be divided into three parts: color formation methods, 3D technologies and light sources. In a study on the effects of visual fatigue from various colors and images appearances it is necessary to find a stress-free way for people to view things. Methods involved in the research on color formation are time sharing and spatial formation; 3D displays use shutter and polarized glasses; LED backlights and mixed LED and LD lights are the lighting sources. To date, the color break-up from time sharing method has been known to cause visual fatigue in the human eye, and it is common for 3D displays to make people feel tired. The main focus of this research is to discover the effects of other factors.
To solve these problems, it is necessary to find a suitable indicator for evaluating the effects of various displays on the human eye. There are various indicators for evaluating visual fatigue. A subjective method such as a questionnaire could be used, and some objective method such as critical fusion frequency which is suitable to certain case. This study proposes to evaluate visual fatigue through accommodative microfluctuations of the ciliary body. There is now a similar evaluation method in medical research on visual fatigue called the high frequency component of accommodative microfluctuations. For instance, Gray et al. [1] used low frequency component (LFC) and high frequency component (HFC) to analyze visual variations after using visual display terminals. The HFC’s spectral power was analyzed by Kajita et al.[2]. It showed that visual fatigue could indeed be measured and quantified. This method can effectively and objectively determine whether subjects are suffering
from visual fatigue. Therefore, this research uses it as an indicator for studying the relationships between the color formation methods, 3D technologies, light sources, individual differences and visual fatigue.
For this research, the test was designed using 3D and 2D videos to stimulate the human eye under different modes. Two blue-ray DVDs were selected, with a 15 min viewing time, for each mode. Before the experiment, subjects were given a hue test to pinpoint individual differences, and then they were measured by the auto refract-keratometer (Speedy-K; Nikon, Tokyo, Japan). They would also complete a questionnaire, before and after the experiment (four times for each mode). The auto refract-keratometer was used to measure and record the subjects’ accommodative microfluctuations, and then to calculate the spectral power of the high frequency component, a key point and major indicator in this research. It represents the state of the microfluctuations in the ciliary body, which decides whether or not subjects have visual fatigue. The differences between the before and after viewings are compared, using statistics, the ANOVA and a t-test to determine the relationships between these factors.
Chapter 2 Visual Fatigue
Different degrees of visual fatigue, a common affliction of present day society, occur in conditions where the eyes are used for a long time. Thanks to advancing new technology, information, whether it is dynamic or static, can be shown in displays. People usually watch all kinds of displays in their daily lives. External lighting and information stimulate each part of the eye continuously, causing problems such as visual fatigue, accommodation and a decrease in vision quality. Take computer use for example, according to the United States National Research Council in 1983, fifty percent of Americans feel uncomfortable when they use computers; moreover, ninety one percent of those computer users suffer from visual fatigue symptoms such as visual discomfort, blurred vision, double vision, tearing, myopia and so on [3]. So far, several devices and tests have been designed by researchers to measure visual fatigue and discover the reason for it. Now there is a need for further research to suggest ways to relax the eyes.
2.1 Visual Process
Vision is one of the most important sensory organs. People are able to see the world in color through their eyes. However, using one’s eyes for long periods of time may easily results in visual fatigue. Therefore, before studying the problem of how displays cause visual fatigue, it is necessary to determine how color images and stereoscopic vision are generated in the visual system.
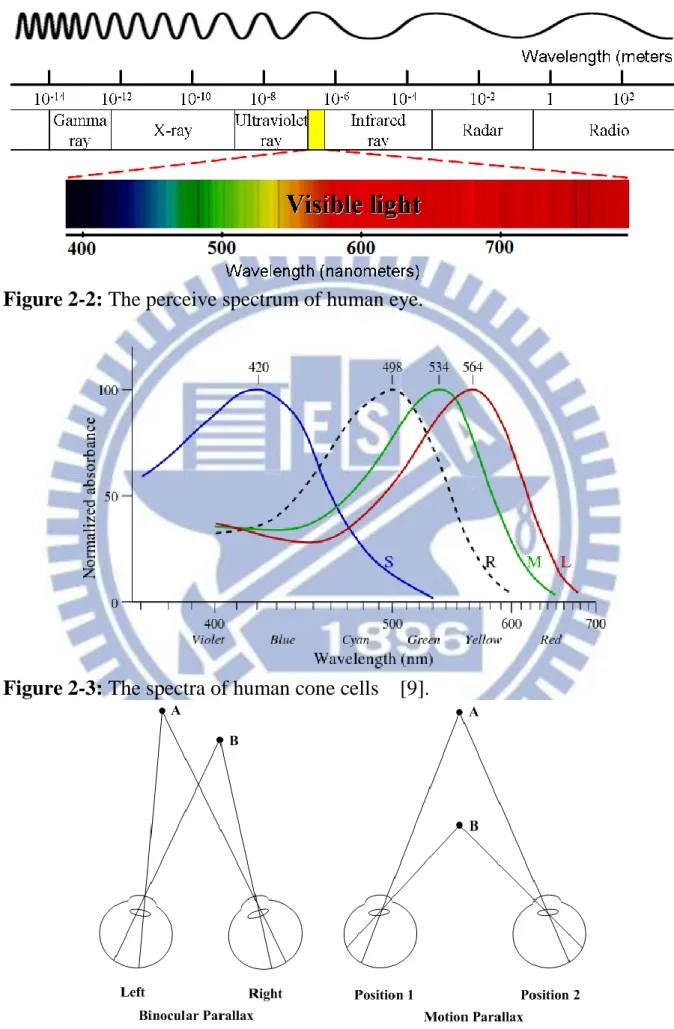
Fig. 2-1 shows how the eye’s refractive and photosensitive system works when a light source illuminates and reflects an object. Light enters the cornea and continues into the pupil’s aqueous humor. Just like the shutter of a camera, the pupil is controlled by the dilator sphincter. The sphincter papillae constricts or dilates from the intensity of the incoming light. After passing through the pupil, light is refracted by the crystalline lens. The lens curvature is controlled by the ciliary body; it has the ability to refract light and focus on objects, either distant or up close. Finally the light passes through the vitreous and the image is imprinted on the retina. The cornea, aqueous humor, crystalline lens and vitreous are the eye’s refractive system. On the retina are cone and rod cells, the eyes photosensitive system that act as autoradiography films. Fig. 2-2 shows the electromagnetic spectrum’s frequency band where human eyes can sense ranges between about 360 to 400nm (purple) and 780nm (red). Cone cells are the
photoreceptor cells in the eye’s retina. When luminance is above 3 nit it allows photopic vision [4]; it is divided into three types to sense light in three color bands, as shown in Fig. 2-3. The cones number around seventy million, with the total number of cells peaking close to 564-580 nm; 534-545 nm is about thirty times greater than 420-440 nm [5], so the human eye is more sensitive to yellow wavelengths of 580 nm. Rod cells, numbering about a hundred million, are photoreceptor cells when luminance is under 0.03 nit; they enable scotopic vision. A color image appears when the eye’s refractive and photosensitive systems co-ordinate. Then stereoscopic vision is generated not only by the cells related to the retina [6, 7], but also by merging images from different angles in the brain. True stereoscopic vision is the result of the binocular and motion parallaxes, as shown as Fig. 2-4. The binocular parallax is the apparent difference in position of an object as seen separately by one eye, and then the other, which is then merged into a stereo image by the brain. Motion parallax is a depth cue that results from the motion of the head. As a result, people have stereoscopic vision.
Figure 2-2: The perceive spectrum of human eye.
Figure 2-3: The spectra of human cone cells [9].
2.2 Definition and Sources of Visual Fatigue
Visual fatigue, which contains various classes of expositions and definitions, cannot be summarized in just a single description. Megaw (1995) claimed that visual fatigue should be defined from all kinds of perspectives, and pointed out at least seven points describing visual fatigue: (1) Visual fatigue does not occur just anytime or anywhere. In circumstances where subjects receive visual stimulation from a repetitive task over a long period of time, they would suffer from visual fatigue. Moreover, if subjects have vision defects such as uncorrected refractory errors, visual fatigue occurs relatively quickly. (2) Visual fatigue should be distinguished from a task related to a mental workload, e.g., the task associated with the information and cognition demands. (3) People who suffer from visual fatigue can recover by resting or changing the working conditions. Also visual fatigue will not cause permanent injury unless the person suffers from some related disease. (4) Visual fatigue should be separated from the visual system’s adaptive response. For example, the typical adaptation curve points out that upon entering a dark space, it takes the eye longer to adjust to the light, while in some conditions, the adjustment time is very short. The retina’s neural adaptation takes only a few milliseconds in small luminance changes (Rushton and Westheimer, 1962). (5) Symptoms of visual fatigue are the main reason that visual fatigue exists. (6) Individual problems, visual tasks and the environment affect whether or not visual fatigue will occur, i.e., a person with uncorrected refractive problems like myopia or hyperopia, will feel uncomfortable and suffer easily from visual fatigue when asked to perform a visual task. (7) The visual fatigue symptoms do not always relate to vision, i.e., in a dry environment, dust particles can cause visual discomfort. Therefore, any factors that can affect vision may cause visual fatigue. These seven points give a general description and definition of visual fatigue. So by referencing them, one can determine whether or not visual fatigue actually occurs.
The source of visual fatigue is fairly extensive and, generally speaking, can be divided into three components [10]: (1) the Oculomotor control systems causes fatigue, i.e., accommodation control related to the ciliary muscle, the six extraocular muscles which regulate vergence control and balance, vision control associated with the same muscles relate to the pursuit and saccadic eye movements, pupil response by the dilator sphincter and the sphincter papillae, blinking associated with the orbicularis palpebrarum, and so on. (2) Neural processes: light entering the retina passes through the optic nerves and the lateral geniculate body through to the striate cortex. (3) Relatively non-specific effects like arousal levels and the amount of effort. Although visual fatigue is ascribed to three sources, they are obviously not independent. Alcohol or medications will reduce the arousal, affecting eye movements, such as causing rapid eye movements. Due to the recent surge in display technology, several studies focus
on the influence of stereoscopic displays on visual fatigue. Some studies show the reasons that these displays cause viewers’ visual fatigue; they are: (1) Abnormal binocular vision. (2) Dichoptic errors, such as geometrical distortions between the left and right images (e.g., depth-plane curvature, keystone distortion, crosstalk, and binocular rivalry). (3) Conflict between the vergence eye movements and accommodation. (4) Excessive binocular parallax [11-14].
After extensive overuse, various symptoms arise: (1) aching, burning, tearing, strain, irritation or dryness in the eye; (2) double vision; (3) headaches; (4) the decrease of accommodation power and convergence; and (5) a decrease in visual acuity, sensitivity to contrast and speed of perception. These are possible symptoms when people suffer from visual fatigue, but in reality there are probably more symptoms [12, 15-17].
2.3 Indicators and Methods for Measuring Visual Fatigue
In visual fatigue research, there are various and extensive indicators and measuring methods, which can be divided into five types [10][[18-21]: (1) the measurement of the oculomotor systems, e.g., eye movement velocity, accommodation power, convergence, viewing distance, pupil diameter, er and blinking; (2) the measurement of visual acuity, e.g., visual acuity, critical fusion frequency (CFF); (3) measuring the performance of visual tasks, i.e., recognition speed and error detection rate; (4) the report of asthenopia symptoms, and (5) brain activity measurements like functional magnetic resonance imaging (fMRI), magneto encephalography (MEG) and electroencephalography (EEG) for observing neural activity affected by visual fatigue, both temporally (MEG and EEG) and spatially (fMRI).
Among the eight most common and obvious ways cited in numerous research papers, are seven objective or subjective indicators according to Chi and Lin [15] from Megaw(1995) such as accommodation power, pupil diameter, visual acuity, eye movement velocity, critical fusion frequency, the subjective rating of visual fatigue, visual task performance, and brain activity measurements which is applied to few researches. The subjective rating for visual fatigue is an indicator related to a judgment on the subjects’ level of visual fatigue; it will have more inaccuracies, while others have objective indicators according to the response of intraocular components or the visual cortex’ neural activity. The following sections give brief introductions to the eight indicators.
2.3.1 Accommodation Power
curvature to an object as its distance varies. The principle is that the curvature is adjusted by the ciliary body so that objects can be clearly imprinted on the retina. A diopter is the accommodation’s unit of measurement. W. Jaschinski-Kruza [22] reported that accommodation is connected to visual fatigue. Charman and Heron [23] claimed that microfluctuations exist in the ciliary body, which shows that accommodation can be evaluated whether or not the subjects suffer from visual fatigue. Sumio Yano et al.[11, 24] reported that there are apparent variations in the accommodative response after watching stereoscopic displays. Instead of measuring the crystalline lens’ accommodation power by using specific stimuli, due to the lack of measurement methods early studies focused on measuring the accommodation time or the nearest point of accommodation. Aside from using the VDT near-point tester to measure accommodation, laser, infrared and polarized vernier optometry were also included. Subjects’ accommodations should be measured before and after the experiment in order to record their response, which can then determine whether or not the fatigue occurs. Iwasaki et al. found that after an hour of viewing the test target, the accommodation time increases. Thereafter, subjects were tested on a visual experiment for fifteen min, and then their eye was stimulated by a distant refractometer target for two min. It was discovered that after comparing the before and after accommodative responses, that visual fatigue decreases as the ciliary body relaxes when looking at a distant object; this proves that accommodation is definitely related to visual fatigue [25].
2.3.2 Pupil Diameter
The iris must dilate or contract as a screen’s intensity changes, so that the dilator sphincter is forced to act frequently. The depth of field increases as the diameter of the pupil contracts, which affects the eye’s accommodation ability. Consequently, some research assesses the degree of visual fatigue by the changes in the pupil’s diameter. By using records from infrared photography, Geacintov and Peavler (1974) observed that subjects’ pupils do contract after watching continuous displays. Murata (1997) claimed that it is appropriate to use the changes in pupil diameter to assess visual fatigue [26]. Backs and Walrath (1992) confirmed that the pupil’s diameter response is highly sensitive to processing information; however, Taptagaporn and Saito (1990) [27] considered that it is easy for exterior stimuli to change the pupil, i.e., brightness, subjects’ emotions and difficulty in analyzing information. Every variable should be controlled. Whether the pupil’s diameter relates to the subjects’ fatigue is not clear; so the results are inconclusive.
2.3.3 Visual Acuity
for three hours, subjects have transient myopia when looking at distant targets. Landholt rings were used to survey the vision changes in the test. The subjects’ average vision obviously decreased from 1.08 to 0.82, and the range became wider as the time was increased. Apart from the loss of vision, some researchers claimed that sensitivity also decreases. Perhaps fatigue in the oculomotor control systems is responsible for the loss of vision, e.g., accommodation or vergence systems relating to the lens’ accommodation ability, a lowering of sensitivity in the vision process, or a general reduction in arousal. Therefore, the loss of vision, which is right for evaluating overall visual function, can also be used to evaluate visual fatigue. Besides using the Landholt rings to test eyesight, and asking and answering questions, some specific instruments are also available, such as the vision tester (OPTEC 2000, Stereo Optical) for example. The optotype inside the instrument is designed to employ the Landholt rings design concept. When doing research, eyesight should be tested before and after the experiment by the optotype. The test’s design can also stimulate eyes efficiently and the visual acuity, from watching these stimuli, can be observed and compared.
2.3.4 Eye Movement Velocity
Six extraocular muscles regulate the movements of the eye. These movements can be recorded several ways and are generally divided into five methods according to the way the eye moves: (1) Electro-oculography, which puts electrodes around the eyes and records potential changes in the corneoretina. (2) A Video-Based Eye Tracker, which videotapes the subjects’ eye movements. (3) A Scleral Search Coil, which assesses eye movement by using the electromagnetic induction theory. (4) The Dual Purkinje Image Tracker that uses different corneal refraction angles and lenses to shoot the pupil’s contour. (5) Infrared Oculography uses infrared rays to irradiate around the iris, and reflex back. The optic signals are transferred into electrical impulses so that the eye movements can be understood by the signals. Bahill and Stark [29] pointed out that eye movement parameters will be influenced by the saccadic eye movement control system. As the intraocular and extraocular muscles control eye movements, over time it would cause muscle fatigue. After studying the saccadic eye movement system, Saito et al. [30] found that, for VDT staffs, the eye movement amplitude and frequency are high after work as opposed to before work. Hallett [31] noted that eye movement velocity is the function of the saccadic angle (the amplitude of vibration) and movement frequency. In other words, eye movement velocity is equal to the saccadic angle shifts multiplied by the frequency. When the saccadic angle is large, it will cause excessive torsion, which presses on the optic nerve or leads to conjunctivitis, so the eyes will hurt or be hurt. Schmidt, Abel, DellOssen & Daroff (1979) and Stberg (1980) claimed that eye movements could be used to evaluate visual fatigue because the
reaction is obvious, especially for the ciliary body, so a visual fatigue study using eye movement velocity would be reliable.
2.3.5 Critical Fusion Frequency
Critical fusion frequency is a kind of temporal measure that enhances the flash frequency little by little. When subjects are looking at a flash of light, they feel it is continuous. In other words, the subjects fail to identify whether or not the light flashes. This flash of light reaches a critical point, which is called a critical fusion frequency. Analyzing the change in CFF is highly sensitive and suitable for assessing whether or not visual fatigue occurs. The CFF can be tested by using an instrument, (e.g., Handy Flicker, NEITZ), containing an optotype with different colors. The flash frequency can be gradually increased until the subjects feel that the optotype does not flash anymore; then the frequency can be recorded. This action can be repeated with decreasing frequency to observe whether or not the subjects’ CFF also tends to decrease t [32]. Osaka [33] noted that when a VDU task shows any large red or blue words, both the foveal and peripheral CFF test show deterioration. Iwasaki et al. [34] studied the reactions of different CFF colors, and found that yellows and greens decreased after thirty min, and the red after fifteen. The distinction between color and light are provided by the cone cells and the rod cells, respectively, on the retina. Therefore, a decrease in the CFF represents a decrease in the retina’s function. For the work place, the brightness contrast is best from between 7:1 to 11:1. The lower the light, the more fatigue people feel. In low brightness contrast, the decrease in the degree of CFF is fairly obvious.
2.3.6 Visual Task Performance
Many researchers prefer to observe if subjects suffer from visual fatigue by using direct or indirect visual performance measures. Aside from the reading [35] and simulated inspection tasks [36], there are some experiments that have been designed specifically for this purpose. This kind of indicator evaluates the subjects’ visual response under different working conditions by comparing the before and after variation, so the degree of visual fatigue can be better understood. Nonetheless, there are three restrictions: (1) the drop in performance may not be caused by visual fatigue, e.g., it may be caused by boredom, low arousal or low spirits. Therefore, anything that can lower the visual performance should be avoided in a test so that there is nothing to connect the visual fatigue with the visual performance. (2) Perhaps performance is hindered by the subjects’ special effort or learning, so using something that can be learned or achieved through effort should also be avoided. (3) Do not use methods that are difficult to attain, e.g., analyze the data before and after reading to determine the occurrence of visual fatigue from the reading speed and comparison of the error
detection rate. Generally speaking, researchers like to observe whether or not the subjects with visual fatigue maintain the same performance levels after the experiment. Studies have shown that people who read monitors have a higher level of visual fatigue than those who read paper. As the visual fatigue increases, the reading efficiency is affected, either directly or indirectly. The research on multimedia dynamic information displays [37] showed that information load and speed of movement evidently influence visual performance measures and visual fatigue.
2.3.7 Subjective Rating of Visual Fatigue
Numerous researchers adopt the subjective rating method, which Sinclair [38] divided into five areas: rankings, questionnaires, interviews, ratings and checklists. Bullimore et al. [39] claimed that the advantage to adopting a subjective rating method for evaluating visual fatigue and visual performance measures is that it is easy to manipulate, involves little cost and is quick to evaluate, even if there are too many variables. The subjective rating method possesses higher sensitivity, but because it acts upon the subjects’ subjective senses, its diagnostic, validity and reliability are still up for discussion. The cause of fatigue is hard to find. Other objective evaluation indicators should be involved when evaluating visual fatigue in order to improve the diagnosis. The most general method to determine the degree of visual fatigue is through a questionnaire. Researchers have to design a form where relevant visual fatigue symptoms can be recorded. Subjects rank their symptoms on the form in five to seven points [11, 26, 32, 40], according to their situation before and after the experiment. Afterwards the researchers use the total for after the experiment minus the one before, and then the occurrence of visual fatigue can be analyzed. There is another method that uses points for individual symptoms which occur, after watching the display minus the ones from before so that the strongest and the weakest symptoms can be compared.
2.3.8 Brain Activity Measurements
All perceptions and high-level recognition are processed in the brain. Therefore, any visual fatigue occurring after the experiment is reflected by new activity in the brain. Apart from providing variations in brain activity, brain activity measurements also provide understandable perceptual and cognitive processes to characterize variations of pathology, such as specific visual deficiencies. In order to achieve high sensitivity and specificity, high-quality spatial information, such as functional magnetic resonance imaging (fMRI) can be combined with high-quality temporal resolution, such as magneto encephalography (MEG) and electroencephalography (EEG). Most of the relevant brain activity studies on depth perception focus on basic issues like
establishing the binocular vision’s real path. Some visual fatigue studies have used this method to discuss the relationship between perception and the causes of visual fatigue. Emoto et al. [12] measured visually evoked cortical potential with an EEG, which reflects fatigue of the relevant intraocular muscles, extraocular muscles and nerves in the brain, and used a P100 latency (positive component at approximately 100ms latency) as a fatigue index. The delays for temporally changing parallax were significant, and a high correlation was found between the relative vergence limits and P100 latencies. In preliminary research Hagura et al. [41] use an fMRI combined with an MEG as a tool to measure visual fatigue, which allows the dipole data obtained by the MEG to be superimposed onto a 3D model set up by the fMRI. Although the results showed that the back left side of the brain was active while viewing stereogram and isocontour maps, the dipole activity varied with different watching periods, and the maps were not clear enough to identify and locate those exact areas; therefore, this method’s applications need further investigation.
2.4 Comparisons of indicators
Overall, not all of the visual fatigue measurement indicators are high in sensitivity or obvious in every experiment. There are different restrictions or conditions in the different experimental environs [15], as shown as Table 3-1. The eye movement speed and pupil diameter are more obvious reactions, as they are highly sensitive in experiments containing dynamic information. These will fail to underline the variations if the experiment condition is static. Accommodation, eyesight and critical fusion frequency are highly sensitive in a long-term stimulated environment, but not obvious over a short period of time. C. F. Chi and F. T. Lin [15] pointed out that using these three indicators to evaluate visual fatigue will improve sensitivity if the test time is over sixty min. In order to improve validity, there is a need to increase both the viewing time and the number of subjects when adopting these three evaluation indicators. A subjective rating method can reflect all kinds of conditions that cause visual fatigue. The benefit of it is that it is easy to practice and has high validity, but it relies on the subjective element, and aside from consulting professional ophthalmologists or clinicians to enhance its validity, more samples and experiments are required. Information is displayed on monitors everywhere now, so there are many factors that lead to visual fatigue. To evaluate visual fatigue, different types of work need to be evaluated using different scales, so that the occurrence of visual fatigue can be found quickly and efficiently. Measuring brain activity is a pioneering method. A breakthrough in technology is required in order to achieve clarification and accuracy in locating and identifying visual fatigue by this method. Follow-up studies should continue to improve this method’s validity.
An appropriate evaluation indicator should be chosen to investigate the relationship between the color formation methods, 3D technologies, light sources and visual fatigue. This indicator needs to satisfy every condition to compare these relationships. This study uses dynamic information as the experimental tool since displays are used to show the dynamics of daily life. The moving frames stimulate eyesight. Moreover, it is better to use multiple visibility ranges than others that just explore the influence of different ranges at short distances. From the eight indicators mentioned in the previous section for evaluating visual fatigue, accommodation and critical fusion frequency are highly sensitive at short distances and low brightness contrast respectively; both are unsuitable. Secondly, the pupil’s diameter is so easily influenced by exterior stimuli that it is difficult to control variations. The speed of eye movements can be adopted in a dynamic environment, but existing measurement methods are limited. Some instruments cause the eyes discomfort, and the measurement of movement time is inaccurate. Because of such difficulties, this study has not adopted this method. Visual performance measures have too many limits to operate, so it does not figure highly on the list. Lastly, eyesight evaluation conforms to the study’s goals; however, the stimulation takes a lot of time. As for brain activity measurements, due to the difficulty and uncertainty with equipment, it is not on the list. As a result, a subjective rating method is selected as one of the reference methods, the benefit being that it is easy to use in various conditions. In addition, to the subjective rating method, the study will use an advanced evaluation method of visual fatigue. This method uses microfluctuation variations in the ciliary body after it is stimulated to determine if visual fatigue occurs. This method analyzes how the ciliary body’s response to objects is different from accommodation. Because this indicator is not restricted by the conditions and relates to the subjects’ physiology and the ciliary body microfluctuations, it was adopted in this study, in addition to the subjective rating method.
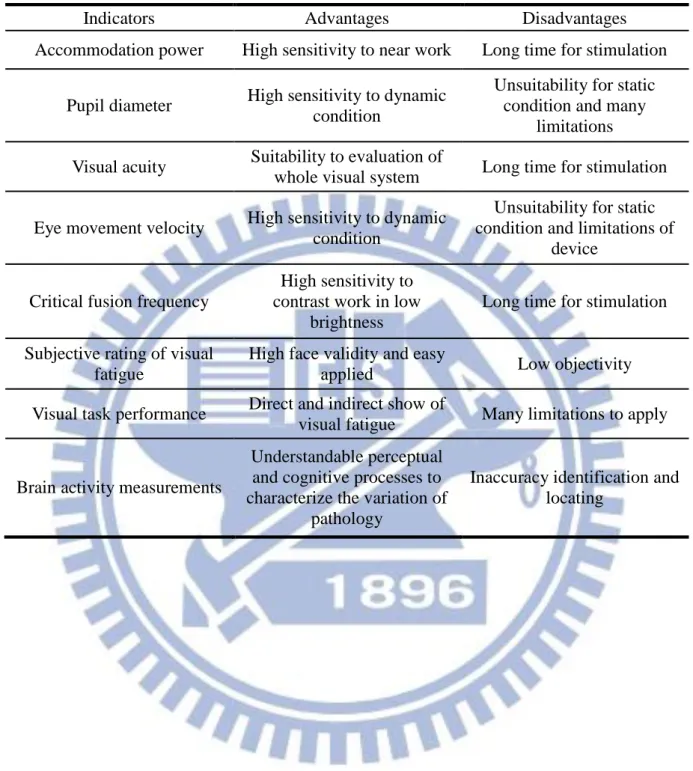
Table 2-1: The comparisons of eight indicators.
Indicators Advantages Disadvantages
Accommodation power High sensitivity to near work Long time for stimulation
Pupil diameter High sensitivity to dynamic condition
Unsuitability for static condition and many
limitations Visual acuity Suitability to evaluation of
whole visual system Long time for stimulation Eye movement velocity High sensitivity to dynamic
condition
Unsuitability for static condition and limitations of
device
Critical fusion frequency
High sensitivity to contrast work in low
brightness
Long time for stimulation Subjective rating of visual
fatigue
High face validity and easy
applied Low objectivity Visual task performance Direct and indirect show of
visual fatigue Many limitations to apply
Brain activity measurements
Understandable perceptual and cognitive processes to characterize the variation of
pathology
Inaccuracy identification and locating
Chapter 3 Accommodative Microfluctuations
The eye lens’ curvature changes its dioptric ability to maintain a clear image of objects as the distance varies. This self-adjusting mechanism on optical system calls accommodation, which varies from 0.01 m (10 D) to infinity (0 D) for normal and young eyes. The ciliary body around the lens controls the curvature of the lens by contracting and relaxing, and has a large number of suspensor ligaments connected to the lens. Theoretically, the ciliary body should be in fixed state when looking at an object, but actually it adjusts repeatedly instead of adjusting immediately to a suitable curvature during the accommodation process. In time, it becomes unstable and fluctuates with changes lower than 1 D and a frequency up to a few Hz. These are called accommodative microfluctuations [1, 2, 23, 42-47]. As people with normal vision look at a close object, the activity of the ciliary body is relatively low when compared to viewing a far object. When people with visual fatigue look at a far object, the activity of the ciliary body is significantly higher compared to normal vision, and remains high while looking at short distances, but is not as obvious compared to people with normal vision [2, 43]. When reading at short distances, people with myopia exhibit a significant increase in the power of accommodative microfluctuations [48].
3.1 Phenomena of Accommodative Microfluctuations
Collins (1937) [49] used an infrared optometer to measure patients and found that high frequency fluctuations occurred during accommodation. Since then, there have been a series of studies on this phenomenon. Arnulf et al. indicated that the fluctuations make images on the retina focus poorly. In the research, the double-pass ophthalmoscopic method was used to take pictures of retina images while subjects watched stable targets. The results showed that a series of adjustments let the ciliary body keep a balanced position while the amplitude is about 0.1D, which maintains an optimum response between the lens and the image but changes the contrast of the retina image further. As technology advanced, Campbell [50] developed a high-speed infrared optometer which has a high temporal resolution to record accommodative microfluctuations almost continuously, and can both quantify and establish a frequency domain for the microfluctuations [2, 23, 46, 51]. These microfluctuations act as the sinusoidal wave [2] and are defined according to two components: low frequency component (LFC) and high frequency
component (HFC). Because the fluctuation frequency of about 5Hz is stable, the fluctuations above 5Hz are not adopted. The root mean square (rms) of amplitudes below 5Hz ranges between 0.02D to 0.2D [44]. Some research has reported peaks in the HFC [49, 50, 52, 53]. In addition to the classical IR autorefractometer, a wave-front aberrometer and ultrasound have also been used in the research. Wave-front recording accommodation can compute high order aberrations, like Zernike polynomials. So beyond spherical defocus and astigmatism [54, 55], additional information is available on the eyes’ optics to analyze the microfluctuations and yield a total defocus error. The Ultrasonographic method, which is completely different from other optical methods, can track microfluctuations by measuring variations in the eye’s morphology [56, 57]. Finally, an IR autorefractometer will be introduced in section 3.5.
3.2 The Power Spectrum of Accommodative Microfluctuations
The behavior of accommodative microfluctuations is complex, without rules and nonlinear in time; however, regular patterns exist while transferring the waveform into the frequency domain. According to the waveform, accommodative microfluctuations consist of two components: low frequency component (LFC) and high frequency component (HFC); the former is defined below 0.6 Hz and the latter between 1.0 to 2.3 Hz [1, 2, 23, 44, 45]. Accommodative microfluctuations may be affected by a distance of target [43, 58-60], pupil diameter [47, 61-63], the form and contras of target [64, 65], the luminance of target [1, 66, 67], the eye’s age, astigmatism [68],visual fatigue [2, 43, 69, 70] ,bi/monocular observation of the target [62, 69], and artifacts such as cardiopulmonary signals [52, 71, 72] or other rhythmical physiological systems. Neurological control also affects the LFC’s wavelength, and arterial signals correlate highly to the HFC [1, 44].
3.3 Relationship between Accommodative Microfluctuations and
Visual Fatigue
Among the factors mentioned in section 3.2 that influence accommodative microfluctuations, the effect on the pupil’s diameter is the most obvious. The pupil changes with light, and when the diameter is smaller, the HFC fluctuations are imperceptible, although the LFC increases; when the diameter increases, the HFC fluctuations become obvious and the LFC decreases [44]. Geacintov and Peavler (1974), Goldwater (1974), and Ukai et al. (1997) reported that there is a connection between pupil instability and visual fatigue [1]. Some recent research has studied eye variations and visual fatigue after viewing VDTs; it indicates the close connection between the pupil’s variations and accommodative
microfluctuations [1]; it showed that patients with asthenopia can indeed be diagnosed from changes in the HFC [2]. Table 3-1 shows that the HFC range for people with normal vision is about 40 to 60 while viewing a stable target at about 0 to -0.75 D, and that with asthenopia, it is about 60 to 70; the difference is imperceptible if the target is about -1.0 to -3.0 D. Suzuki et al. (2001) [43] tried using a color code to show the position of targets, the accommodative response amplitude and the HFC value as figures. While viewing a distant, stable target, Fig. 3-1 shows that a normal subject’s HFC is about 50 to 60, labeled in green, while Fig, 3-2 shows a subject with asthenopia is above 60, labeled in red. After combining these results, it is concluded that the ciliary body’s tension is low when viewing far objects, so its variation is large if visual fatigue occurs, and slight with short distances. Thus, the ciliary body’s tension is recognized by the HFC variations and subjects are assessed to see if they suffer visual fatigue.
Figure 3-2: The HFC of subjects with asthenopia [43].
Table 3-1: The HFC of subjects in different distances of target. The “-”
means no fatigue; the “+” means fatigue [2]. Subject HFC1 (0~-0.75D) HFC2 (-1.0~-3.0D) fatigue 1 49.8 69.0 -2 56.6 71.2 -3 54.4 72.6 -4 64.8 77.0 + 5 65.2 70.4 + 3 62.4 71.1 + 7 60.7 69.7 +
3.4 Automatic Refractor-Keratometer
In section 3.3 Dr. Kajita used the HFC to evaluate the state of visual fatigue by measuring the accommodation of different subjects, and Suzuki proved that the HFC values reveal if subjects suffer visual fatigue. So in 2003 and 2005, Dr. Kajita published two patents, for the auto refract-keratometer design (Speedy-K; Nikon, Tokyo, Japan) developed from his research. Fig. 3-3 shows infrared illuminated optotype that the auto refract-keratometer measures and records the
eye’s accommodative microfluctuations with in real time. A stepper motor controls the target distance. The relative position between the target and the optical lens changes when the motor steps, so subjects are stimulated by multiple distances during the measurement process. The chopper and receiver in the device sample the target’s stimulation; the sample rate can be modified depending on the requirements. In order to acquire a large sample of accommodative responses and calculate HFC values, an auto refract-keratometer was applied in this research. There were 8 target distances in the device: +0.5D, 0D, -0.5D, -1.0D, -1.5D, -2.0D, -2.5D and -3.0D, from far to near. 0D means 6 meters in Optometry where the accommodative response is very low, and +0.5D is above 6 meters where the ciliary body is almost unadjusted so the image is blurred to the eye. The device used in this research features the Speedy-K Ver. MF-1 software that communicates with RS-232 and calculates the HFC; therefore, the subject’s HFC can be analyzed and shown on the software interface.
Figure 3-3: The target in the auto refract-keratometer.
3.5 Comparisons between the HFC and other Indicators
The indicators for evaluating visual fatigue, accommodation power, pupil diameter, visual acuity, eye movement velocity, critical fusion frequency, subjective rating of visual fatigue, visual task performances and brain activity
measurements, have their own limitations. For instance, accommodation power is best used to evaluate visual fatigue because the lens curvature becomes larger in close work and fatigue occurs over long periods of time. Work station illumination is different from that of a target or dynamic information, and the iris’ sphincter muscle, as a pupil constrictor, has to control the amount of light entering the eyes. Because it is easy to feel tired when working long hours, the pupil’s diameter is a suitable evaluator under these conditions. The disadvantage to a subjective rating, is that the method’s objectivity depends on the subjects’ psychological and physiological feelings, rating it inadequate. So it is generally only used to supplement other methods.
The HFC is part of the accommodative microfluctuations spectrum, and is calculated according to accommodation records. Section 3.2 shows the high correlation between the HFC and cardiopulmonary signals; therefore eyes suffering from visual fatigue can be evaluated by the HFC variations because physiological aspects influence cardiopulmonary signals. In addition to measuring accommodative microfluctuations and calculating the HFC, the device can be used to measure accommodation power, which is more functional than optometers in the past.
The HFC is a speedy and uncomplicated indicator to evaluate visual fatigue. Although there is little research on visual fatigue with the HFC due to the expense involved in using the device, it can test a subject’s level of visual fatigue.
Chapter 4 Methods for Color and Image Formation
of Displays
Currently, people use electronic devices frequently in their daily lives. As technology has developed, people have continued to pursue more realistic and natural imagery, from the monochromatic television of thirty years ago, to color televisions using color filters, to the high quality lightweight televisions of today. In order to provide an advanced visual feast, technology has expanded into the 3D field. Various 3D displays are developing in stereo.
From a visual standpoint, displays involve three aspects: color formations, 3D technologies and the selection of light sources. Different display methods cause different sensations and effects on the human eye. This research uses two kinds of 3D liquid crystal display (LCD) televisions and a laser projector. The color formation methods, 3D technologies and light sources are introduced and detailed in the following sections, and a final comparison is given on each aspect’s differences.
4.1 Color Formation Methods
Instead of binary images, color images have become the main method of displaying color filters, separating the light by a range of wavelengths. Three methods are based on these configurations: time sharing, spatial formation and an overlay formation method, each with its own expression in time and space. To date, all of the color displays being sold are manufactured by these methods. Time sharing is discontinuous in the time domain. Different colors like RGB are projected as time-sharing; in other words, they are discrete [73]. When a series of colors are projected in an interval shorter than the persistence of vision threshold, human eyes sense a color mix spatially, instead of three distinct colors, as shown as Fig. 4-1. Spatial formation method is discontinuous in spatial domain, where a pixel is made up of different color filters called a geometrical sub-pixel, like RGB filters. Although it is discontinuous due to gaps in the geometrical combination [73], eyes sense a color mix of three sub-pixels instead of recognizing their position and color if the color filters geometrical combination is close enough to the eyes’ critical spatial resolution, as shown as Fig. 4-2. The overlay formation is an additional colored science principle that produces any color by projecting different colors like RGB in the same place. Since eyes cannot differentiate between original colors, a single color forms in
the visual cortex [73], as shown as Fig.4-3. The laser projector used in this research applied the Digital Light Processing (DLP) as its time sharing method, and the two kinds of 3D LCD TVs applied the spatial formation method, which are detailed in the following sections.
Figure 4-1: The concept of time sharing method.
Figure 4-2: The concept of spatial formation method.
Figure 4-3: The concept of overlay formation method.
Humans can observe a world of color through their eyes. We all know that we cannot see anything in a dark room because everything we see reflects light from a light source.
Digital Light Processing (DLP) is a projection technology developed by Texas Instruments, which outputs digital optical pulses with high optical efficiency after receiving electrical signals. As optical pulses pass through the eyes, they are converted into analog color images. DLP projectors based on the number of Digital Micromirror Devices (DMD), as shown in Fig. 4-4, are divided into single-chip, two-chips and three-chips. A single-chip is common in schools, homes and companies, while the two and three chips are usually reserved for specific situations such as a movie theater, due to the costs and large volume. There are two important components in the single-chip optical system, the color wheel and the DMD.
Figure 4-4: The structure of DMD [74].
A color wheel is a circular sheet with red, blue and green color filters. Using various wavelengths up to 60Hz can provide 180 color fields per second. When a white-light source passes through the color wheel, red, blue, and green images are formed in the eyes, but the light’s intensity decreases as the spectrum is filtered. The DMD is a quick optical switch that is the core of DLP projection technology. Many micro mirrors reflect the colors as they pass through the lens
to the color wheel, and an image is projected onto the screen. Input signals are written sequentially and converted into RGB data in the DMD’s static random access memory (SRAM). The white-light source focuses on a color wheel by focusing the lens’ images on the DMD. As the color wheel rotates, red, blue and green are sequentially projected onto the DMD. Thus, when red is emitted on the DMD, mirrors decide when to switch the position and display intensity from the R data, to blue and green. Video signals are the same. The human visual system combines sequential colors to get a color image [75].
The color wheel design concept is time-sharing; it reveals color in a rotational frequency quicker than the human eye. However, some people with sensitive vision see three individual colors so their visual quality is affected. This is called color break-up (CBU) or a rainbow effect [76-79] , shown as Fig. 4-5. Color break-up occurs on fast moving frames, especially on the edge of a object, or as a fast eye movement because the RGB image is incomplete and then destroyed by the next frame. Color break-up causes viewers visual fatigue, dizziness and headaches for a long time. Ogata et al. [40] used different projectors on subjects viewing the same video, and a questionnaire to examine their subjective feelings, such as feelings of dizziness, dry eyes and so on. Each symptom was given five grades, with the higher grade being more serious. Fig. 4-6 shows the statistical result after experiments where different bars represent different projectors (2×-DLP means that the rotational speed is 60Hz x2, and so on). The vertical axis represents the subjects’ different scores before and after the experiment. A high score means serious visual fatigue. It is obvious that LCD projectors cause fewer fatigue problems, and DLP projectors with higher rotational speeds make subjects feel less fatigued. The way to reduce this effect is by improving the color wheel’s rotational speed, but coordinating the DMD and color wheel becomes increasingly difficult, and the electrical circuit design becomes much more complicated. Another way is dividing a color wheel into red, blue and green. As the color wheel rotates once, the red, blue and green circle twice, so the rotational speed is doubled. Although it is effective to decrease the color break-up, the projector’s brightness decreases when light passes through more colors.
Figure 4-5: The phenomenon of color break-up.
Figure 4-6: Different effects on visual fatigue by projectors [40].
4.1.2 Liquid Crystal Display
In 1968, the Radio Corporation of America developed a liquid crystal display that was lightweight and consumed little power. The most important aspect of the LCD is the materials which have properties of a conventional liquid and a birefringence of anisotropic crystals [80] that let light pass through a substrate by deflecting it into different angles for a display that is as effective
as external electric fields. A polarizing filter is applied to the LCD. Imagine the light as a string wave with two mutually perpendicular vibrating directions. The two polarizing filters are fences that block the perpendicular direction of the string wave and bypass the parallel. It is the same way that the polarization of the passing light is selected through a polarizing filter. The liquid crystal layer becomes a way of changing the light’s polarization through voltage control, as shown as Fig. 4-7. When the voltage is off, the layer’s polarization changes, lets the light pass through, and the display is brightly lit. When the voltage is on, the liquid crystal molecules rotate and cannot change the light polarization, so the display is dark as the light is blocked. Thus, the combination of liquid crystal molecules changes to show gray levels as the external electric fields change with varying optical transmittance.
Figure 4-7: Different effects on visual fatigue by projectors.
The main reason that a LCD is able to show colored images is that red, green, and blue color filters are placed on a liquid crystal cell. The gray levels are formed by a back light passing through a liquid crystal layer control driver IC and through color filters to form red, green and blue and finally a color image for the eyes. Since liquid crystals do not emit light directly, the LCD is arrayed in front of a light source to produce colored images from different colored filters.
A color filter consists of a glass substrate, black matrixes, a color layer, an over coat and indium tin oxide (ITO), shown as Fig.4-8. The main function of the black matrix (BM) is to avoid a color mix effect between the colors. The
purpose of the overcoat is to form a flat surface and keep the liquid crystal uncontaminated. ITO is used as a transparent conducting oxide with electrical conductivity and optical transparency, which is easily deposited as a thin film.
Figure 4-8: The structure of color filters.
In order to display images with good color quality, the arrangement of color filters is important. The color filters are fabricated by applying organic RGB materials to each pixel. Generally, the pixel arrangement is divided into stripes, mosaics, deltas, squares and so on, shown as Fig. 4-9. The RGB pixel is arranged individually into long stripes with three different neighboring colors, so thick stripes appear if the picture is larger, or if the figure is longitudinal. The mosaic places the RGB sideways to get more natural images than the stripe and a sharper oblique line for larger pictures. The RGB is arranged in a triangular shape in the delta and displays the most natural images, with a resolution 1.5 times the stripe but with the same number of pixels. It is often used in mid and small sized panels. The square feature occurs when a pixel consists of four points, like a square, instead of three, and is applied more to the image field. In summary, LCD TVs use liquid crystals to represent gray levels and use color filters to show colors.
![Figure 2-1: Anatomy of the eye [8].](https://thumb-ap.123doks.com/thumbv2/9libinfo/8235811.171151/14.892.133.800.108.930/figure-anatomy-of-the-eye.webp)
![Figure 3-1: The HFC of normal subjects [43].](https://thumb-ap.123doks.com/thumbv2/9libinfo/8235811.171151/27.892.128.809.126.895/figure-hfc-normal-subjects.webp)
![Figure 3-2: The HFC of subjects with asthenopia [43].](https://thumb-ap.123doks.com/thumbv2/9libinfo/8235811.171151/28.892.134.797.102.913/figure-hfc-subjects-asthenopia.webp)