Department of Business Administration
I-Shou University
Master thesis
The influence of new leadership style on the
satisfaction and loyalty of the employees: A case in
Vietnam
Advisor: CHING SUNG LAI, Ph.D
Co-advisor: HO SY TAN, Ph.D
Graduate Student: NGUYEN THANH TRUNG
Acknowledgement
First of all, I would like to thank my professors who have been teaching for the last two years in the MBA courses. I have learnt a lot from them. Especially, I would like to thank Dr.Ching Sung Lai and Dr. Ho Sy Tan for their guidance in my thesis.
Secondly, I also thank my classmates for their support for the last two years. I have learnt much from them. Surely, the friendship and cooperation we have built together will last for years.
Finally, I would like to thank my family for their constant support and motivation so that I can finish this course. No word can describe my gratitude to them. Thank you very much!
Abstract
Human resource is the most valuable asset of any enterprise. It is the source of wealth and development. The business administrators is always looking for ways to attract the human resource, which both has high qualification and ability to respond flexibly and effectively to external changes. Simultaneously, the administrators also should be interested in developing and maintaining satisfaction and loyalty of the workforce. The results of exploratory factor analysis show that it is needful to reduce research models and transformational leadership is consequently divided into two factor groups as follows: (1) Leader’s prestige and Ability to exploit employee capacities; (2) Motivation and Care about individuals. Among them, the factor group “Leader’s prestige and Ability to use employees’ capacities” always has greater effect compared to the factor group “Motivation and Care about individuals” regarding level of employee satisfaction and loyalty
Keywords: leadership, satisfaction, loyalty, motivation, prestige
TABLE OF CONTENTS
Acknowledgement ... i
Abstract ... ii
TABLE OF CONTENTS ... iii
LIST OF FIGURES ... vi
LIST OF TABLES ... vii
CHAPTER 1 INTRODUCTION ... 1
1.1 REASON SELECTED TOPIC THE REASON FOR CHOOSING THE TOPIC ... 1
1.2 THE PURPOSE OF THE RESEARCH ... 1
1.3 RESEARCH SUBJECT AND SCOPE OF RESEARCH... 1
1.4 THE SIGNIFICANCE OF THE RESEARCH ... 2
1.5 STRUCTURE OF THE THESIS ... 2
CHAPTER 2 LITERATURE REVIEW ... 3
2.1 LEADERSHIP STYLE ... 3
2.1.1 Concepts ... 3
2.1.3 Style of “ New leadership in quality” ... 5
2. 2 THE EMPLOYEESATISFACTION AND LOYALTY ... 7
2.2.1 Employee satisfation ... 7
2.2.2 Employee loyalty to the organization ... 8
2.2.3 The benefit of building and maintaining the satisfaction and loyalty of employees to the organization ... 8
2..3 THE RELATIONSHIP BETWEEN THE NEW LEADERSHIP STYLE IN QUALITY AND THE EMPLOYEESATISFACTION AND LOYALTY ... 9
CHAPTER 3 RESEARCH METHODOLOGY ... 11
3.1 RESEARCH INTRODUCTION ... 11
3.2 RESEARCH PROCEDURE ... 11
3.3 RESEARCH MODEL ... 12 iii
3.3.1 Research variables... 12
3.3.2 Research hypotheses ... 12
3.3.3 Reasearch model diagram ... 14
3.4 DATA PROCESSING METHOD ... 15
CHAPTER 4 RESEARCH RESULTS ... 16
4.1 DESCRIPTION OF SURVEY SAMPLE ... 16
4.2 PRELIMINARY EVALUATION OF THE MEASUREMENT SCALES ... 17
4.2.1 The measurement scale “transformational leadership” ... 17
4.2.2 The measurement scale “employee satisfaction” ... 17
4.3 EXPLORATORY FACTOR ANALYSIS (EFA) ... 18
4.3.1 Exploratory factor analysis of the scale “transformational leadership” ... 19
4.3.2 Exploratory factor analysis of the scale “Employee satisfaction and loyalty” ... 20
4.4 REDUCED RESEARCH MODEL ... 20
4.5 THE RESULTS OF MEASUREMENT AND ANALYSIS ... 22
4.5.1 Linear regression analysis ... 22
4.5.2 Comparison result (ANOVA & T-Test) based on personal characteristics . 25 4.5.3 The testing result of descriptive statistics ... 27
4.6 TESTING RESULTS OF HYPOTHESES ... 30
4.7 THE SUMMARY OF CHAPTER 4 ... 31
CHAPTER 5 CONCLUSIONS AND RECOMMENDATIONS ... 32
5.1 GENERAL EVALUATION ... 32
5.1.1 Practical uses of leadership style at enterprises ... 32
5.1.2 The effects of leadership styles on employee satisfaction and loyalty ... 32
5.2 SOLUTIONS AND RECOMMENDATIONS... 33
5.2.1 Leader’s prestige and The influence of the ideal ... 33
5.2.2 Encouraging employees to exploit their intellectual capacities ... 34
5.2.3 Motivation ... 35 iv
5.2.4 Caring about individuals ... 36
5.2.5 Other recommendations ... 37
5.3 CONCLUSION ... 38
5.3.1 Main contributions of the research ... 38
5.3.2 Limitations of the research ... 39
5.3.3 Recommendations for next researches ... 39
REFERENCES ... 40
APPENDIX ... 42
LIST OF FIGURES
Figure 3.1: Research procedure ... 11 Figure 3.2 The research model of the relationship between the new leadership style in quality and the
satisfaction, loyalty of employees to the organization ... 14 Figure 4.1: Sample description based on business ownership . Error! Bookmark not defined.
LIST OF TABLES
Table 4.1: Sample description based on employee age ... 16 Table 4.2: Sample description based on employee educational attainment ... 16 Table 4.3: Sample description based on employee seniority ... 16 Table 4.4: Summary of preliminary measurement scales of Cronbach’s Alpha coefficients .. 18 Table 4.5. Results of exploratory factor analysis EFA of transformational leadership ... 19 Table 4.6: Results of exploratory factor analysis of employee satisfaction and loyalty ... 20 Table 4.2. The research model (modified) of the relationship between transformational
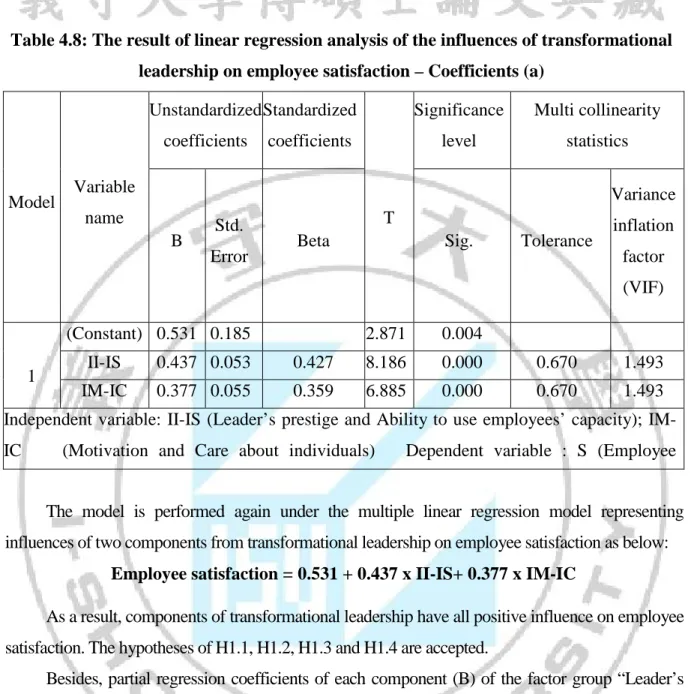
leadership and employee satisfaction with and loyalty to organizations ... 21 Table 4.7: The result of statistical values of the influences of transformational leadership on employee satisfaction – Model Summary ... 22 Table 4.8: The result of linear regression analysis of the influences of transformational
leadership on employee satisfaction – Coefficients (a) ... 23 Table 4.9: The result of statistical values of the influences of transformational leadership on employee loyalty– Model Summary ... 24 Table 4.10: The result of linear regression analysis of the influences of transformational leadership on employee loyalty – Coefficients (a) ... 24 Table 4.11: Comparisons based on types of ownership – ANOVA ... 26 Table 4.12: The result of descriptive statistics regarding transformational leadership based on types of business ownership ... 28 Table 4.13: The results of descriptive statistics of employee satisfaction and loyalty based on types of business ownership ... 29 Table 4.14: Testing results of hypotheses ... 30
CHAPTER 1 INTRODUCTION
1.1 REASON SELECTED TOPIC THE REASON FOR CHOOSING THE TOPIC
Human resource is the most valuable asset of any enterprise. It is the source of wealth and development. The business administrators is always looking for ways to attract the human resource, which both has high qualification and ability to respond flexibly and effectively to external changes. Simultaneously, the administrators also should be interested in developing and maintaining satisfaction and loyalty of the workforce.
The administrators accomplish those personnel objectives in the implementation process of their leadership role. Thus, leadership and successful leadership have been more vital than ever. Especially, in the current Vietnam’s economy with nearly 30 years of innovation, those new factors of motivation and leadership style have gradually come into the economic and social life. Workers have more choices and become more sensitive to the leadership style of the organization.
So, is there any connection between leadership style with satisfaction and loyalty of the employees to the organization? In Vietnam, there have not been many researches about leadership style as well as the satisfaction and loyalty of the employees. The urgent issue poses the needs of conducting surveys to determine the level of leadership’s practice and assess the degree of influence –if any–of the leadership style on the satisfaction and loyalty of the employees.
For that reason, the topic “The influence of new leadership style on the satisfaction and
loyalty of the employees: A case in Vietnam” was selected for the research.
The results of this research hope to support leaders to give more attention to the practice of leadership style as well as help them to have an effective approach while they practice leadership for the satisfaction and loyalty of the employees.
1.2 THE PURPOSE OF THE RESEARCH
With the purpose of researching the influence of new leadership style in quality to the satisfaction and loyalty of the employee, the thesis was conducted to address the following issues:
- Adjusting the scale for new leadership style in quality on Vietnam condition; analyzing the influence of the new leadership style in quality on the satisfaction and loyalty of the employees
- Offering some effectively applied and comprehensive solutions of the new leadership style in quality to enhance the employee satisfaction and loyalty in the condition of Vietnamese enterprises. 1.3 RESEARCH SUBJECT AND SCOPE OF RESEARCH
- Research subject is employees who have university degree or higher, and are working in enterprises in Ho Chi Minh City. The research was conducted from March, 2015 to November,
2015.
- The scope of research: geographically, the research is limited within enterprises in Ho Chi Minh City. Conceptually, employee satisfaction is a very broad concept. Research on satisfaction is limited to the common issues, and problems relevant to leadership factor.
1.4 THE SIGNIFICANCE OF THE RESEARCH - Contributions in academictheory:
The research introduces, incorporates, and adjusts the scale of the new leadership style in quality with the scale of the employee satisfaction and loyalty in Vietnam’s condition.
- Contributions in the reality:
The research measures the influence of the new leadership style in quality on the level of satisfaction and loyalty of the employees to the organization in the scope of enterprises in Ho Chi Minh City. The research will be the scientific and objective foundation helping administrators to give a bigger attention to the employees and the influence of leadership style on the employee satisfaction and loyalty.
1.5 STRUCTURE OF THE THESIS
The structure includes five main chapters: - Chapter 1: Introduction
- Chapter 2: Theoretical foundation - Chapter 3: Research methodology - Chapter 4: Research results
- Chapter 5: Conclusions & recommendations
CHAPTER 2 LITERATURE REVIEW
This chapter introduces the overview of theories and previous researches that have been done on the new leadership style in quality, employee satisfaction, employee loyalty, and the relationship between the new leadership style in quality and the satisfaction, loyalty of the employees to the organization.
2.1 LEADERSHIP STYLE
2.1.1 Concepts
2.1.1.1 Leadership concept • Traditional concept
According to George R. Terry (1972), “Leadership is an activity influencing people to voluntarily strive for the goal of the group”. Robert Tannenbaum, Irving R. Weschler and Fred Massarik (1961) defined leadership as “inter-personality influence is implemented in the situation and it is oriented through the communication process in order to achieve specific purposes”. Harold Koon andCyril O’Donnell (1964) stated,“Leadership is the influence on human being to pursue the achievement of a common goal”.
Thus, most of the authors admitted,“Leadership is a process influencing the activity of an individual or a group in order to achieve the goal in a specific circumstance”.
It should be noted that this definition does not refer to any particular organization. In a situation in which a person is seeking to influence the behavior of an individual or a group, that is leadership. Likewise, when the above definition mentions the superior and the staff, it is not necessarily understood, as we are talking about ranking as the superior (boss) and the subordinates. Any individuals seeking to influence the behavior of others, that individual is the potential leader. The subordinate of that influenced attempt is the potential follower, even though individual is the boss, colleague, the inferior, a friend, a relative or a group.
• Modern concept
According to Kevin Freiberge and Jackie Freiberge (1996), “Leadership is an active relationship relied on the mutual influence and common purpose between leaders and their associates, by which, they are reaching a higher level of motivation and working morale while executing changes as planned”.
According to Joseph Rost (1991), “Leadership is the mutual influenced relationship between leaders and associates – in order to achieve changes reflecting common purposes of both parties”.
Northouse (2007) defined the leadership as “a process whereby an individual influences a group of individuals to achieve a common goal.” While House (2004) defined the leadership as “the individuals who have the ability to influence, stimulate and encourage others to contribute to the efficient operation and success of the organizations they run."
Therefore, this definition emphasized more on the perspective of “relationship” and “partner”. According to this definition, leaders are also influenced by partners when they worktogether to achieve the common goal.
2.1.1.2 The concept of leadership style
“Leadership style is a model or a way which leaders use to influence subordinates in the process of motivating them to implement the common goals of the organization” (Le Thanh Ha, 2004).
There are many different models of leadership style. Each model has its own advantages and disadvantages. The research of this thesis replies on the theory of Benard M. Bass in 1985,about the style of “new leadership in quality”. To understand the new leadership style in quality, we need to distinguish this style with the “Leader of qualification”.
2.1.2 Style “Leadership of qualification”
“Leaders of qualification” are people who “instruct and motivate their followers to pursue the defined objectives by clarifying role and task requirements” (Robbins, 2003).
According to the model of Bass (1985), leaders of qualification replies on the process of exchange when leaders perform pay-off. The leaders of qualification work through the creation of a clear structure of the tasks that the subordinates must carry out, and of rewards that they will achieve if following orders. Discipline are rarely mentioned yet always be implied and official discipline system has always been in place.
In fact, one can say that the leader of qualification is not eligible for “leadership” from the definition (Bryman 1992). Based on the exchange, the leader of qualification does not encourage the employees to work more just to get bonuses or not to be punished. In conclusion, many researches indicated that placing too much reliance on leadership of qualification might negatively affect the results of operation, and satisfaction of the employees (Bass, 1985; Bryman 1992; Burns, 1978; Peters & Austin, 1985)
From the above conclusion, Bas (1985) presented a new theory about the new leadership style in quality and pointed out which elements form this style. The new leadership style in quality is considered to achieve significantly higher operational results from the staff.
2.1.3 Style of “ New leadership in quality”
“The new leader in quality” is the person who “inspires the executors so they can act beyond personal interests”. “The new leader in quality” is also the person who “has the ability to create profound and special influence on executors.” (Robbins, 2003).
2.1.3.1 Expression
According to the model of Bass (1985), working for a new leader in quality could be an amazing experience. They transmit the desire and energy. They care about your and always want you to succeed.
“Prospect”, “inspiring”, “daring to do” are words that can describe the style of “new leader in quality”. They revive bankruptcy companies. They lead the entire organization to a very different future from the past and present of that organization. They are people with high goals and ideals.
Creating the prospect
The new leader in quality starts out to create a prospect, a vision of the future that can stimulate and urge potential people. The scenario could be created by the leaders or a group of experienced employees or be developed from series of group discussion. It is important that the leaders have decided to choose and pursue that vision.
Explaining the prospect
The next step, actually not just a step, is the act of continuous explanation about the scenario consistently. This step requires many energy and commitment because many people will not be persuaded by a scenario. The new leader in quality takes advantage of every opportunity and uses every mean to convince others toward that vision.
To attract many followers, the new leader in quality must be cautious in building faith, and personal ethics of the leader are the critical part in that strategy.
Finding a path forward
Together with the explanation of the prospect is the act of finding a path forward. Some new leaders in quality see the road and simply want people to follow. Some others have not had a specific strategy but they are willing to lead the journey to find the promise land.
The road may not be clear and detailed, but with a clear prospect, the new leader in quality always has a grasp of direction. Therefore, seeking a way forward is a process of continuous development.The new leader in quality accepts the possibility of failure along the way. They are very satisfied as long as they go in the right direction, towards the target.
Assuming full responsibility
One more important thing, during the entire journey, the new leader in quality is 5
always the leading and central figure. A new leader in quality always steps forward and does not hide behind his soldiers. By their behavior and attitude, the new leader in quality sets themselves as a sample for everyone. They constantly encourage, reinforce the morale of the executors. They constantly build, listen, appease, and applaud their executors.
Their consistency itself helps everyone move forward, especially in difficult period when there are doubts on the feasibility of the prospect. If not everybody believes in their success, their efforts will fall. New leaders in quality always seek to spread and reinforce the commitment, faith of the executors in the prospect.
One of the methods that the new leader in quality always uses to maintain their motive is to publicly motivate the executors in the form of formal ceremony or cultural symbols. Regardless of degree, any improvement is encouraged and motivated as a sign of progression. In general, new leaders in quality balance actual actions that create progress and the working spirit of the employees. Their approach is human-oriented more than other styles. They believe that the success will come and it is maintained thanks to the long-term and profound commitment of the staffs.
2.1.3.2 Individual personality
The new leaders in quality are “consistent adventurous people”, who are always seizing the opportunity. They also think in a systematic way, understand the interaction between human beings, technology, and culture. Especially, new leaders in quality are people with very high personal prestige. They are the ones who have the attraction of leaders.
2.1.3.3 Factors forming the style of “ New leader in quality”
(1) Prestige leadership or ideal influenced range: the new leaders in quality always know how to pass over to the employee pride of the organization. They present capability and faith in the employees. They gain the faith of the staffs by placing the needs of employees on top of their personal needs. They share the risk with the employees and always behave with principles and high ethical standards. Those leaders are admired, respected, and believed.
(2) Spiritual motivation: the leaders always show the employees meanings and challenges in their job. Teamwork and individual are enhanced. The enthusiasm and optimism are always shown. The leaders always encourage employees to build bright scenarios. On that basis, the leaders construct the prospect for the organization and for themselves.
(3) Paying attention to individuals: the leaders pay attention to the needs of each individual in their achievements and progress through the role of a guide or a mentor. The staff must be developed to the highest potential. The leader must constantly create learning opportunities and an environment that promotes development. The differences in needs of
each individual are recognized.
(4) Encouraging employees to utilize the intellectual capacity: the leader encourages employees to be creative by raising questions to assumptions, examining problems repeatedly, and approaching old situations with the new method. Absolutely, there is no mockery or public criticism of individual’s mistake. New ideas or creative solutions attract attention of the staffs because they participated in the process right from the stage of identifying and resolving problems.
2. 2 THE EMPLOYEESATISFACTION AND LOYALTY
Employees are essential resource of every organization. They are the core in creating value through the successful implementation of model, strategy of the organization. In the reality, customer’s assessment on a company is mainly based on their experience through working with employees of that company.
Employees always have their choices or decisions that may affect their performance, customers’ assessment, and finally the operational results of the organization. Those choices or decisions could be:
- Should I search for the opportunity to increase productivity, adhere to the principles and procedures of the company?
- Should I introduce my company as a good place for work to future staffs of the company?
- Should I introduce product/service of my company to current customers or potential customers?
- Should I encourage colleagues to try their best for work and to be proud of the company?
- Should I continue to work for the company or start looking for a new job elsewhere? All organizations want beneficial decisions for the company from their staffs. Thus, the purpose of building, maintaining the satisfaction and loyalty of employees has become more important than ever.
2.2.1 Employee satisfation 2.2.1.1 Concept
Satisfaction is “the degree to which the employee has a positive feeling toward jobs in the organization” (Price, 1997).
2.2.1.2 Criteria evaluating “ Employee satisfaction ”
There have been many researches on satisfaction (or contentment) of the employees for work. This is perhaps the most researched topic in researches on organization in the past
four decades (Ajmi, 2001); (Curryan, 1999). The job satisfaction of the employees is defined and measured on two perspectives: the overall satisfaction and the satisfaction in each element of work. Satisfaction (or contentment) generally presents emotion included all the common aspects of work.
This research uses the scale of GuideStar Research Organization (2005) that focuses on the overall satisfaction of employees and satisfaction in the leadership elements of the organization.
According to GuideStar model(2005), criteria for evaluating satisfaction (or contentment) of the employees include the followings:
(1) Overall satisfaction in the job and the company
(2) Satisfaction in influence of the company’s managers on the organization and individual.
2.2.2 Employee loyalty to the organization 2.2.2.1 Concept
“Loyalty of the employee is that when the employee commits to attach to the success of the organization and believe that working for the organization is his best choice”. (The Loyalty Research Center, 2004)
2.2.2.2 Criteria for evaluating “ Employee loyalty to the organization”
Like leadership style, the employeeloyalty is not measured or quantified directly. It must be expressed through measured variables. They will be the behaviors and attitudes that people often see in loyal employees.
According to the measurementscale of the employeeloyalty by Man Power (2002), criteria for evaluating the employeeloyalty include:
(1) Being willing to refer the company as a good place to work (2) Being willing to introduce products and services of the company (3) Intending to make long-term commitment to the company
2.2.3 The benefit of building and maintaining the satisfaction and loyalty of employees to the organization
The value of employee loyalty is tremendous. Minimizing the cost of changing staff is just a visible example. The benefit of retaining experienced and reliable staffs is invaluable. It is also noted to administrators who are over the age of forty that things made loyal employees today are very different from what made us loyal to the organization yesterday. Seniority, work experience, organization’s stability will be first things at first thought. However, beyond personal experience, we will look at the complete prospect of the benefit of building and
maintaining satisfaction and loyalty of the employee in the current context.
• In terms of revenue, satisfied and loyal employees tend to do better than what the customers do expect and they always remain in their best morale and ability. Both traits are very important in retaining loyal customers as well as bringing in high revenue.
• In terms of cost, loyal and satisfied employees will work for the company for a long time; reject offers from the company’s competitors. They do not actively seek new jobs and they always introduce the company as a good place to work. These four attitudes positively affect the section of expenses in the balance sheet of the company because the company will avoid significant expense in replacing staff.
In other words, instead of focusing on retaining the employees (trying to retain employees who decided to quit), administrators must be more active and proactive in recognizing the benefit of understanding, managing and enhancing the loyalty and the satisfaction of employees.
Thus, although the employee satisfaction and loyalty are acknowledged as two of the most crucial factors to the success of an enterprise, it is not a surprise to realize that companies and organizations are facing severe challenges in developing an enthusiastic and dedicated staff.
2..3 THE RELATIONSHIP BETWEEN THE NEW LEADERSHIP STYLE IN QUALITY AND THE EMPLOYEESATISFACTION AND LOYALTY
Survey results of Aon research institute (2004) show that 13% of employees donot trust their owner at the basic level. They feel insecure of fears, threats, and harassment. From the survey of over 2,000 employees, only 45% of which agree that “the organization deserves my loyalty”; 32% remains neutral and 23% disagreed. In this same survey, 54% employees do not believe that their leaders have a high level of integrity.
Administrative experts admit that the commitment, loyalty, and trust of the employees are being eroded because of the restructure, merger, and acquisition of enterprises as well as things the fast change nowadays. The research results of Aon show that trust is the basic requirement. Without trust, any benefits, programs of the company will not increase significantly commitment of the employees. Watson Wyatt (2004) pointed out the relationship between faith and profit. In companies that the employees trust leaders, profit increases more than 42%. Apparently, faith is the key of loyalty, especially in the tight labor market. The global study of Watson Wyatt (2004) revealed that 7,500 of their researched employees believes half of their leaders.
Therefore, what do we have to do to promote and consolidate the satisfaction, loyalty, commitment and faith of employees in a constantly changing environment nowadays? The answer is
surprisingly simple. There are real leadership behaviors that affect the employee loyalty. Leaders that practice those behaviors constantly will earn satisfied and profoundly loyal employees.
This has been tested in some researches at some countries. The result of the study of influence of leadership style on the satisfaction and performance of employees in banking industry at the United Arab Emirates (2005) showed that administrators who practiced the new leadership style in quality have positive influences on the satisfaction and performance of the employees. The study on the influence of the organizational culture, leadership behavior to the cohesion, job satisfaction, and job performance at small and medium enterprises of Taiwan (Li Yen Chen, 2004) also concluded: new leadership behaviors in quality have positive influences on the cohesion, job satisfaction, and job performance of employees.
CHAPTER 3 RESEARCH METHODOLOGY
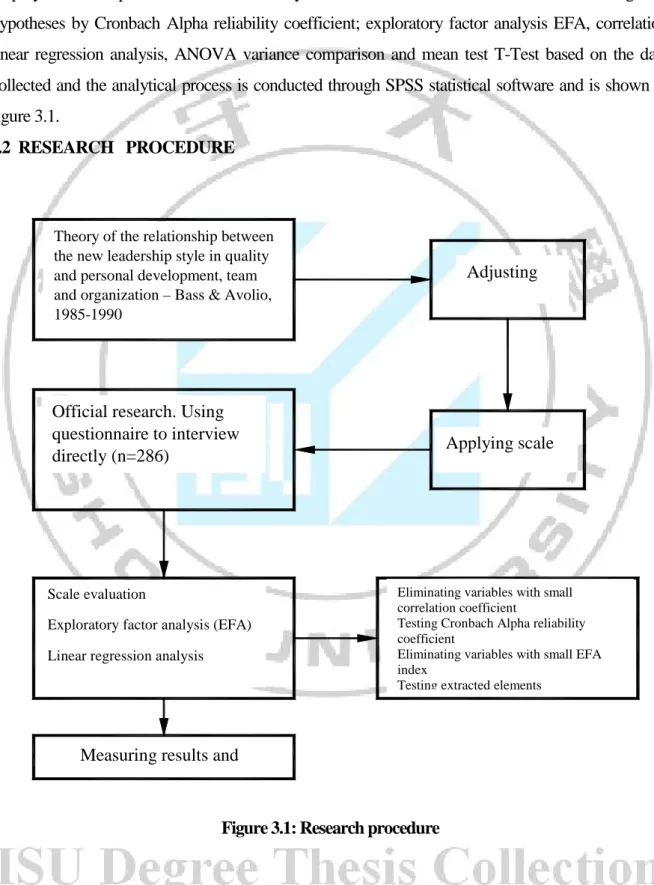
3.1 RESEARCH INTRODUCTIONThe research is conducted through quantitative research methodology with direct interview technique. Research sample is collected by the convenient sampling method with more than 300 employees of enterprises in Ho Chi Minh City. The scale and theoretical model are tested along with hypotheses by Cronbach Alpha reliability coefficient; exploratory factor analysis EFA, correlation linear regression analysis, ANOVA variance comparison and mean test T-Test based on the data collected and the analytical process is conducted through SPSS statistical software and is shown in figure 3.1.
3.2 RESEARCH PROCEDURE
Figure 3.1: Research procedure
Applying scale
Eliminating variables with small correlation coefficient
Testing Cronbach Alpha reliability coefficient
Eliminating variables with small EFA index
Testing extracted elements
Theory of the relationship between the new leadership style in quality and personal development, team and organization – Bass & Avolio, 1985-1990
Adjusting
Official research. Using questionnaire to interview directly (n=286)
Scale evaluation
Exploratory factor analysis (EFA) Linear regression analysis
Measuring results and
3.3 RESEARCH MODEL
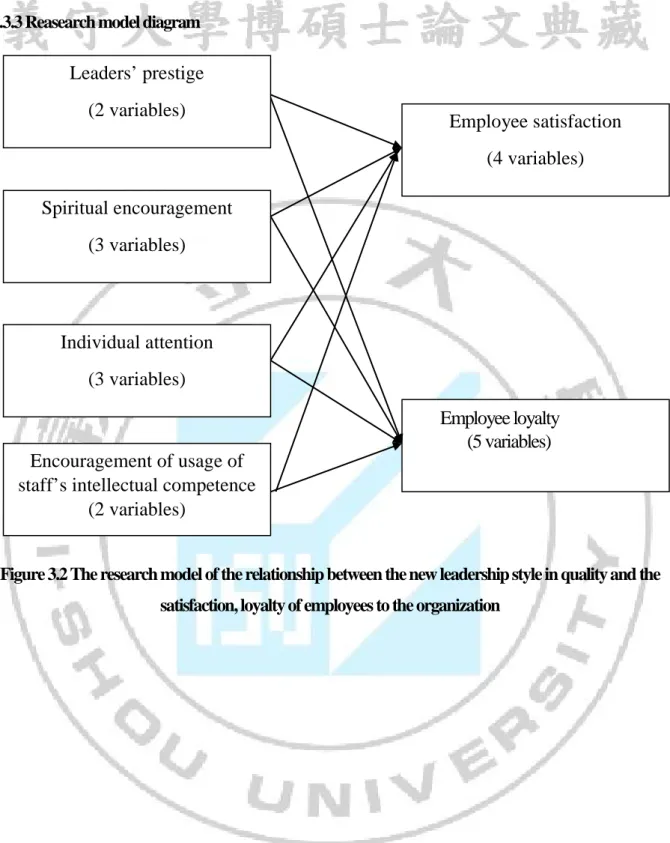
The research model of “The new leadership style in quality and employeeloyalty at enterprises in Ho Chi Minh City” includes three concepts with six components through 19 observed variables in eight hypotheses.
The scale was constructed in the form of measurement introduced by Rennis Likert (1932). There are five ranks in which the fifth rank is equivalent to the level of totally agree and the first rank equates totally disagree.
3.3.1 Research variables
The research variables are categorized into three groups, the new leadership in quality, the employee satisfaction and the employee loyalty to the organization.
3.3.1.1 The scale of “ The new leadership style in quality”
Within the scope of this thesis, the author focuses on studying the new leadership style in quality, also applying the measuring scale MQL (Bass & Avolio, 1990). The scale of the new leadership style in quality includes four components that form the style of “new leadership in quality” (four independent variables).
(1) Prestige of the leader or ideal influence (2) Spiritual encouragement
(3) Individual attention
(4) Encouragement of usage of staffs’ intellectual competence
Component variables of the scale of the new leadership style in quality will be presented through 10 observed variables.
3.3.1.2 The scale of “ Employee satisfaction”
The scale of employee satisfaction includes two criteria for evaluation: (1) General satisfaction on jobs, company, and personal development
(2) Satisfaction in positive influence of the company’s management on the organization and personal.
3.3.1.3 The scale of “ Employee loyalty to the Organization”
The scale of employee loyalty to the organization includes three criteria for evaluation: (1) Being willingness to introduce the company as a good place to work
(2) Being willingness to introduce products/services of the company (3) Long-term commitment to the company
3.3.2 Research hypotheses
This research is conducted to figure out the connection between the leadership style and the 12
satisfaction, loyalty of employees to the organization in Vietnamese conditions. 3.3.2.1 The influence of the new leadership in style on the employee satisfaction
According to the model of Bass (1985) and the result of the study on influence of leadership style on the satisfaction and performance of employees in banking industry at the United Arab Emirates (2005), administrators who practiced the new leadership style in quality have positive influences on the satisfaction and performance of the employees.
Group of research hypotheses in Vietnamese conditions:
H1.1 The increase or decrease of employee satisfactionfollowsthe increases or decreases in performing level of “Leaders’ prestige”.
H1.2 The increase or decrease of employee satisfactionfollow the increases or decreases in performing level of the spiritual encouragement of leaders.
H1.3 The increase or decrease of employee satisfactionfollowsthe increases or decreases in performing level of individual attention of leaders.
H1.4The increase or decrease of employee satisfactionfollowsthe increases or decreases in performing level of encouragement of usage of staff’s intellectual competence of leaders.
3.3.2.2 The influence of the new leadership style in quality on the employee loyalty to the organization
From research and conclusions of many researches by international organizations, they stated that “Employees donot leave companies, they leave managers” (Western proverb). Therefore, the leadership style of the administrators was believed to have a direct influence on employeeloyalty to the organization. Researchhypotheses
H2.1 The increase or decrease of employee loyaltyfollows the increases or decreases in the performing level of “Leaders’ prestige”.
H2.2 The increase or decrease of employee loyalty followsthe increases or decreases in theperforming level of the spiritual encouragement of leaders.
H2.3 The increase or decrease of employee loyalty followsthe increases or decreases in the performing level of individual attention of leaders.
H2.4 The increase or decrease of employee loyalty followsthe increases or decreases in the performing level of encouragement of usage of staff’s intellectual competence of leaders.
3.3.3 Reasearch model diagram
Figure 3.2 The research model of the relationship between the new leadership style in quality and the satisfaction, loyalty of employees to the organization
Spiritual encouragement (3 variables)
Individual attention (3 variables)
Encouragement of usage of staff’s intellectual competence
(2 variables) Employee loyalty (5 variables) 14 Leaders’ prestige (2 variables) Employee satisfaction (4 variables)
3.4 DATA PROCESSING METHOD
First, the research will test the value of the scales on practical influences of the leadership style on the satisfaction and loyalty of employees. The scales are preliminarily evaluated through the result of testing Cronbach Alpha reliability coefficient. Any variables with total correlation less than 0.4 and components with Cronbach Alpha reliability coefficient less than 0.6 will be eliminated.
After processing Cronbach Alpha reliability coefficient of components of the scale, the exploratory factor analysis (EFA) and regression analysis are implemented. All scales, measuring models, research models are tested with appropriate reliability aggregation, and extracted variance.
Cronbach Alpha reliability coefficient test and EFA test are all done by SPSS software.
CHAPTER 4 RESEARCH RESULTS
4.1 DESCRIPTION OF SURVEY SAMPLEThe survey was conducted in Ho Chi Minh City, and the direct interviews were held with employees of enterprises operating in Ho Chi Minh City. Total survey samples collected is 315 of which 286 questionnaires are valid, accounting for 91%. The descriptive statistics are shown in tables 4.1 to 4.3.
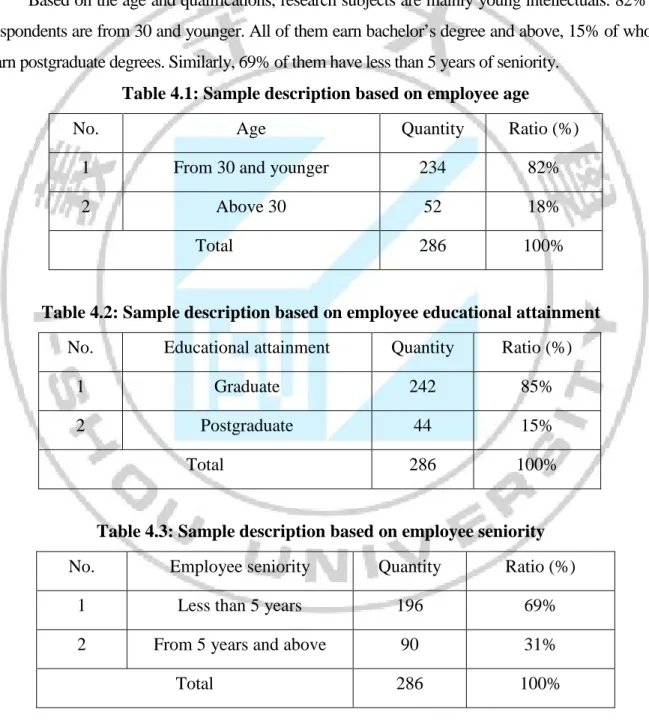
Based on the age and qualifications, research subjects are mainly young intellectuals. 82% of respondents are from 30 and younger. All of them earn bachelor’s degree and above, 15% of whom earn postgraduate degrees. Similarly, 69% of them have less than 5 years of seniority.
Table 4.1: Sample description based on employee age
No. Age Quantity Ratio (%)
1 From 30 and younger 234 82%
2 Above 30 52 18%
Total 286 100%
Table 4.2: Sample description based on employee educational attainment
No. Educational attainment Quantity Ratio (%)
1 Graduate 242 85%
2 Postgraduate 44 15%
Total 286 100%
Table 4.3: Sample description based on employee seniority
No. Employee seniority Quantity Ratio (%)
1 Less than 5 years 196 69%
2 From 5 years and above 90 31%
Total 286 100%
Based on types of ownership, there are three types of business ownership as follows: foreign-owned enterprises (35%), State-foreign-owned enterprises (33%) and private enterprises (32%).
4.2 PRELIMINARY EVALUATION OF THE MEASUREMENT SCALES
Measurement scales are preliminarily evaluated through the testing result of Cronbach Alpha’s reliability coefficient. Cronbach Alpha’s coefficient is a statistical hypothesis test about how close sections of questions in the measurement scales correlate to each other. (Hoang Trong – Chu Nguyen Mong Ngoc, 2005). In accordance with the convention, several researchers agree that Cronbach’s Alpha of 0.6 and above can be used for new research concepts or the concepts that are new to respondents in the research context (Nunually, 1978; Peterson, 1994; Slater, 1995). Besides, SPSS software also supports to compute total correlation coefficient between variables, therefore the total correlation less than 0.4 will be deleted.
4.2.1 The measurement scale “transformational leadership”
The measurement scale MQL of Bass (1990) is used to survey subjects who are young intellectuals and employees of enterprises in Ho Chi Minh City. It includes four components and ten observed variables.
The result shows that corrected item-total correlationmeets the requirement of being greater than 0.4. Cronbach’s Alpha coefficients of each component are as below: (1) Factor “Leader’s prestige or the influence of the ideal” has two observed variables, Cronbach’s Alpha = 0.7476; (2) Factor “Motivation” has three observed variables, Cronbach’s Alpha = 0.6896; (3) Factor “Care about individuals” has three observed variables, Cronbach’s Alpha = 0.7006; (4) Factor “Encouragement of the application of employee’s intellectual capacities” contains two observed variables, Cronbach’s Alpha = 0.6766 (Tables PL 2.1 to PL 2.4, Appendix 2).
When considering more deeply the value of Cronbach’s Alpha coefficients, the removal of variables will make the value of Cronbach’s Alpha decrease. Therefore, we shall not remove any observed variables (question sections).
4.2.2 The measurement scale “employee satisfaction”
The measurement scale Guidestar Research (2005) is used to survey the level of employee satisfaction based on two following aspects: The general satisfaction of employees and the satisfaction with leadership factor of the organization.
The result depicts that the total correlation of variables is all greater than 0.4. Cronbach’s Alpha coefficients of each component are as follows: (1) the general satisfaction with two observed variables, Cronbach’s Alpha = 0.7970; (2) the satisfaction with leader’s influence with two variables, Cronbach’s Alpha = 0.7247 (Table PL 2.5 and PL 2.6 – Appendix 2).
When considering more deeply the value of Cronbach’s Alpha, deleting items will all make the value of Cronbach’s Alpha decrease. Thus, we shall not remove any observed variables.
4.2.3 The measurement scale “employee loyalty”
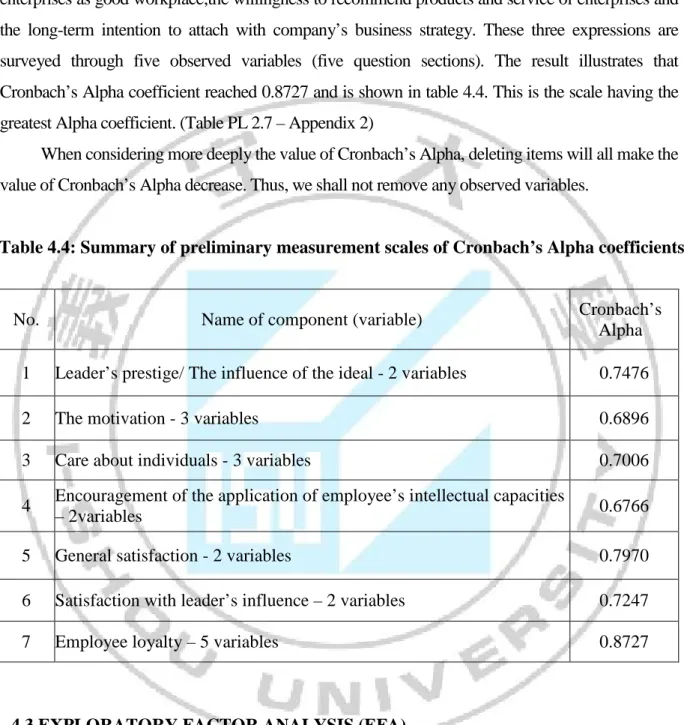
The scale model of employee loyalty of Man Power (2002) is used to survey and evaluate employee loyalty in accordance with three expressions: The willingness to recommend their enterprises as good workplace;the willingness to recommend products and service of enterprises and the long-term intention to attach with company’s business strategy. These three expressions are surveyed through five observed variables (five question sections). The result illustrates that Cronbach’s Alpha coefficient reached 0.8727 and is shown in table 4.4. This is the scale having the greatest Alpha coefficient. (Table PL 2.7 – Appendix 2)
When considering more deeply the value of Cronbach’s Alpha, deleting items will all make the value of Cronbach’s Alpha decrease. Thus, we shall not remove any observed variables.
Table 4.4: Summary of preliminary measurement scales of Cronbach’s Alpha coefficients
No. Name of component (variable) Cronbach’s
Alpha
1 Leader’s prestige/ The influence of the ideal - 2 variables 0.7476
2 The motivation - 3 variables 0.6896
3 Care about individuals - 3 variables 0.7006
4 Encouragement of the application of employee’s intellectual capacities
– 2variables 0.6766
5 General satisfaction - 2 variables 0.7970
6 Satisfaction with leader’s influence – 2 variables 0.7247
7 Employee loyalty – 5 variables 0.8727
4.3 EXPLORATORY FACTOR ANALYSIS (EFA)
After conducting the evaluation of measurement scales, the research continues to implement exploratory factor analysis of measurement scales.
Factor analysis is the general name of a group of procedures used to reduce and summarize data. (Hoang Trong – Chu Nguyen Mong Ngoc, 2005).
Exploratory factor analysis is based on Eigenvalue; therefore, only factors which have Eigenvalue greater than 1 will be remained in the analysis model. Eigenvalue represents for
variations explained by factors. Factors which have Eigenvalue less than 1 will not have the effect to summarize information better than one original variable, because after standardization, each original variable has variance of 1.
The methodology to extract principal components and the original factor rotation Varimax Procedure are used to minimize the quantity of variables which has high coefficients at the same factor, helping to increase the ability to explain of factors.
4.3.1 Exploratory factor analysis of the scale “transformational leadership”
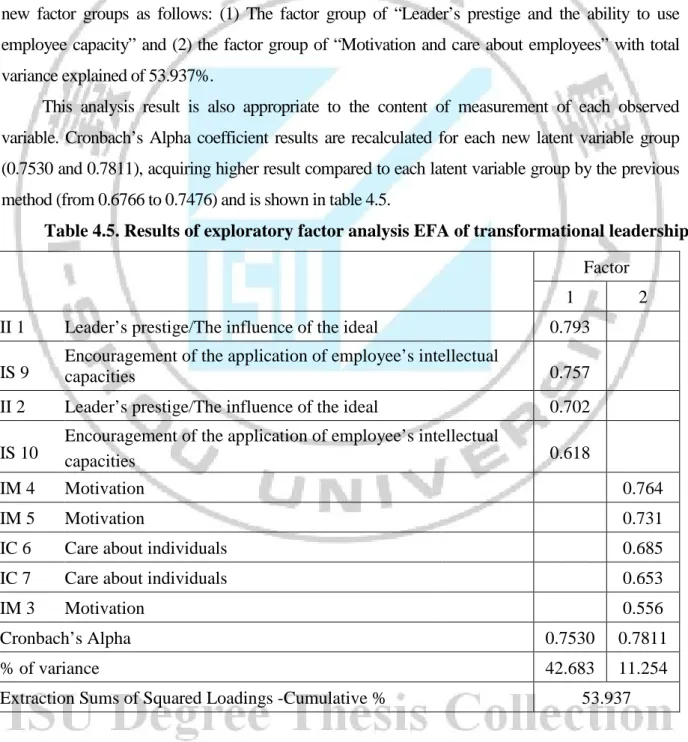
Factor analysis is conducted based on the measurement scale “transformational leadership” with four latent variables and ten observed variables. Variable IC 8 has factor loading which does not meet requirements. Thus, it is deleted from the scale. Nine remaining variables are extracted to two new factor groups as follows: (1) The factor group of “Leader’s prestige and the ability to use employee capacity” and (2) the factor group of “Motivation and care about employees” with total variance explained of 53.937%.
This analysis result is also appropriate to the content of measurement of each observed variable. Cronbach’s Alpha coefficient results are recalculated for each new latent variable group (0.7530 and 0.7811), acquiring higher result compared to each latent variable group by the previous method (from 0.6766 to 0.7476) and is shown in table 4.5.
Table 4.5. Results of exploratory factor analysis EFA of transformational leadership Factor
1 2
II 1 Leader’s prestige/The influence of the ideal 0.793
IS 9 Encouragement of the application of employee’s intellectual capacities 0.757
II 2 Leader’s prestige/The influence of the ideal 0.702
IS 10
Encouragement of the application of employee’s intellectual
capacities 0.618
IM 4 Motivation 0.764
IM 5 Motivation 0.731
IC 6 Care about individuals 0.685
IC 7 Care about individuals 0.653
IM 3 Motivation 0.556
Cronbach’s Alpha 0.7530 0.7811
% of variance 42.683 11.254
Extraction Sums of Squared Loadings -Cumulative % 53.937
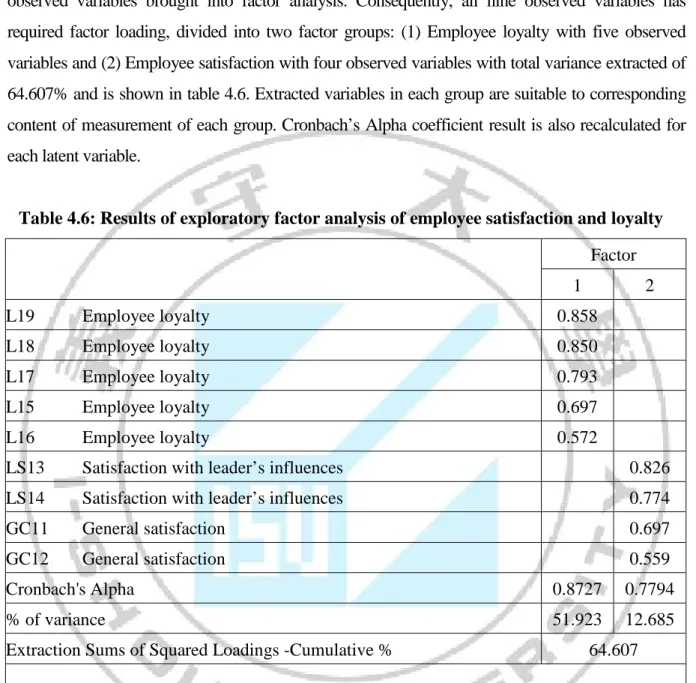
4.3.2 Exploratory factor analysis of the scale “Employee satisfaction and loyalty”
The measurement scale “Employee satisfaction and loyalty” has five latent variables, nine observed variables brought into factor analysis. Consequently, all nine observed variables has required factor loading, divided into two factor groups: (1) Employee loyalty with five observed variables and (2) Employee satisfaction with four observed variables with total variance extracted of 64.607% and is shown in table 4.6. Extracted variables in each group are suitable to corresponding content of measurement of each group. Cronbach’s Alpha coefficient result is also recalculated for each latent variable.
Table 4.6: Results of exploratory factor analysis of employee satisfaction and loyalty Factor 1 2 L19 Employee loyalty 0.858 L18 Employee loyalty 0.850 L17 Employee loyalty 0.793 L15 Employee loyalty 0.697 L16 Employee loyalty 0.572
LS13 Satisfaction with leader’s influences 0.826
LS14 Satisfaction with leader’s influences 0.774
GC11 General satisfaction 0.697
GC12 General satisfaction 0.559
Cronbach's Alpha 0.8727 0.7794
% of variance 51.923 12.685
Extraction Sums of Squared Loadings -Cumulative % 64.607
Extraction Method: Principal Component Analysis. RotationMethod:Varimax withKaiser Normalization. Rotation converged in 3iterations.
4.4 REDUCED RESEARCH MODEL
The measurement result depicts that the measurement scale of transformational leadership from the four groups is divided into two groups of analysis factors. The measurement scale of employee satisfaction and loyalty from three variables group is reduced to two groups. One observed variable which is deleted from the scale of leadership style is “Leaders are ready to listen to employees”. It can be explained that in reality, with Vietnamese characteristics, employees rarely offer to talk and discuss with leaders. Therefore, they face difficulties when being required to
evaluate this expression of leaders.
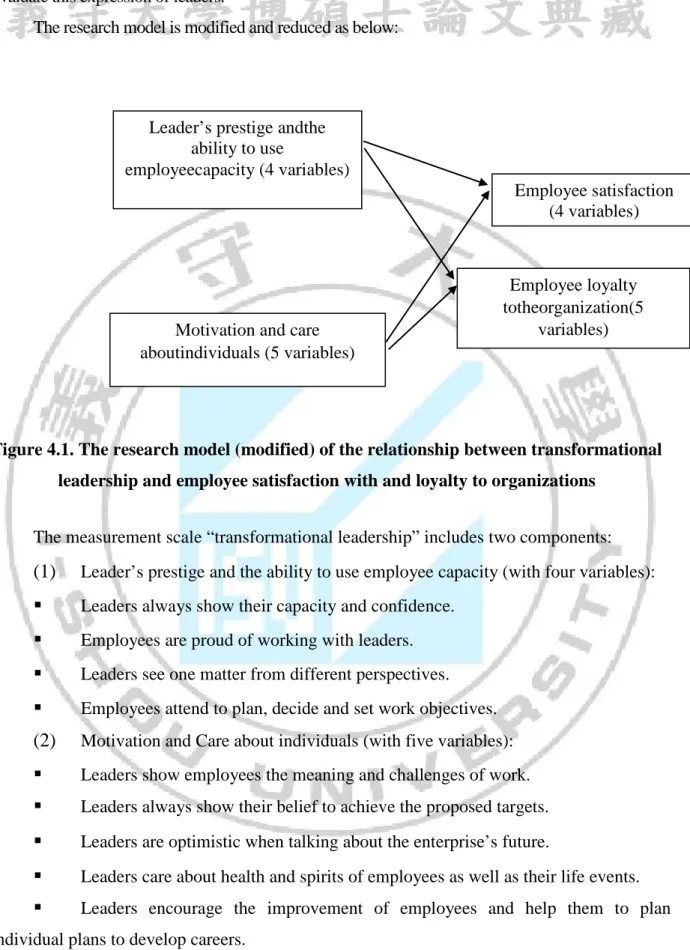
The research model is modified and reduced as below:
Figure 4.1. The research model (modified) of the relationship between transformational leadership and employee satisfaction with and loyalty to organizations
The measurement scale “transformational leadership” includes two components: (1) Leader’s prestige and the ability to use employee capacity (with four variables): Leaders always show their capacity and confidence.
Employees are proud of working with leaders. Leaders see one matter from different perspectives. Employees attend to plan, decide and set work objectives. (2) Motivation and Care about individuals (with five variables): Leaders show employees the meaning and challenges of work. Leaders always show their belief to achieve the proposed targets. Leaders are optimistic when talking about the enterprise’s future.
Leaders care about health and spirits of employees as well as their life events.
Leaders encourage the improvement of employees and help them to plan
individual plans to develop careers.
The measurement scale “employee satisfaction” (with four variables): In general, employees are satisfied with their current companies.
Motivation and care aboutindividuals (5 variables)
Leader’s prestige andthe ability to use employeecapacity (4 variables) Employee satisfaction (4 variables) Employee loyalty totheorganization(5 variables) 21
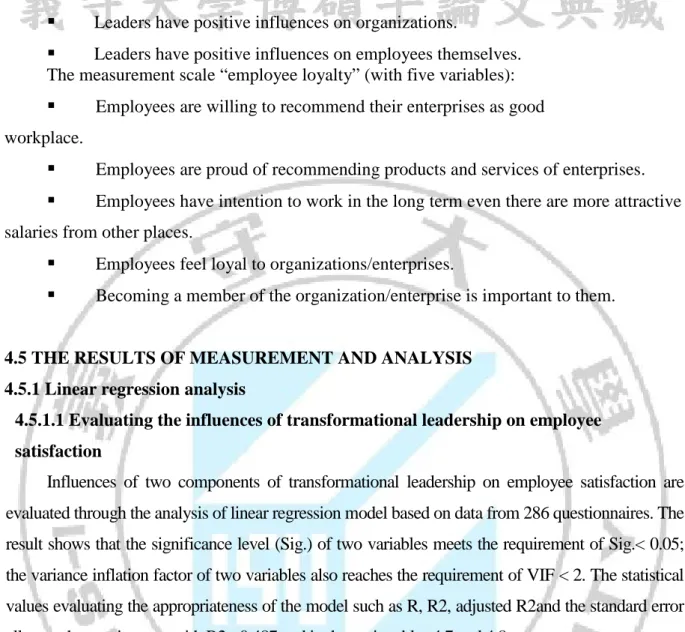
In general, employees are satisfied with their current jobs. Leaders have positive influences on organizations.
Leaders have positive influences on employees themselves. The measurement scale “employee loyalty” (with five variables): Employees are willing to recommend their enterprises as good workplace.
Employees are proud of recommending products and services of enterprises. Employees have intention to work in the long term even there are more attractive salaries from other places.
Employees feel loyal to organizations/enterprises.
Becoming a member of the organization/enterprise is important to them. 4.5 THE RESULTS OF MEASUREMENT AND ANALYSIS
4.5.1 Linear regression analysis
4.5.1.1 Evaluating the influences of transformational leadership on employee satisfaction
Influences of two components of transformational leadership on employee satisfaction are evaluated through the analysis of linear regression model based on data from 286 questionnaires. The result shows that the significance level (Sig.) of two variables meets the requirement of Sig.< 0.05; the variance inflation factor of two variables also reaches the requirement of VIF < 2. The statistical values evaluating the appropriateness of the model such as R, R2, adjusted R2and the standard error all meet the requirement with R2= 0.487 and is shown in tables 4.7 and 4.8.
Table 4.7: The result of statistical values of the influences of transformational leadership on employee satisfaction – Model Summary
Model R R Square Adjusted R Square Std. Error of the Estimate Change Statistics R Square Change F Change df1 df2 Sig. F 1 0.698 0.487 0.483 0.518 0.487 133.758 2 282 0.000
Predictors: (Constant), IMIC, IIIS
Table 4.8: The result of linear regression analysis of the influences of transformational leadership on employee satisfaction – Coefficients (a)
Model Variable name Unstandardized coefficients Standardized coefficients T Significance level Multi collinearity statistics B Std.
Error Beta Sig. Tolerance
Variance inflation factor (VIF) 1 (Constant) 0.531 0.185 2.871 0.004 II-IS 0.437 0.053 0.427 8.186 0.000 0.670 1.493 IM-IC 0.377 0.055 0.359 6.885 0.000 0.670 1.493
Independent variable: II-IS (Leader’s prestige and Ability to use employees’ capacity); IM-IC (Motivation and Care about individuals) Dependent variable : S (Employee
The model is performed again under the multiple linear regression model representing influences of two components from transformational leadership on employee satisfaction as below:
Employee satisfaction = 0.531 + 0.437 x II-IS+ 0.377 x IM-IC
As a result, components of transformational leadership have all positive influence on employee satisfaction. The hypotheses of H1.1, H1.2, H1.3 and H1.4 are accepted.
Besides, partial regression coefficients of each component (B) of the factor group “Leader’s prestige and Ability to use employees’ capacity” are greater than coefficients of the factor group “Motivation and Care about individuals”. It depicts that leader’s prestige and the ability to use employees’ capacity have greater influence on employee satisfaction.
Similarly, standardized regression coefficients of the factor group “Leader’s prestige and Ability to use employee capacity” are also greater (0.427) which affirms the important level of this group.
With such analysis result, if leaders who are even in the limited condition of sources focus on improving the factor group “Leader’s prestige and Ability to use employees’ capacity”, they will also enhance employee satisfaction.
4.5.1.2 Evaluating influences of transformational leadership on employee loyalty The influences of two components of transformational leadership on employee loyalty are also evaluated through the analysis of linear regression model based on data collected from questionnaires and is shown in tables 4.9 and 4.10.
Table 4.9: The result of statistical values of the influences of transformational leadership on employee loyalty– Model Summary
Model R R Square Adjusted R Square Std. Error of the Estimate Change Statistics R Square Change F Change df1 df2 Sig. F 1 0.621 0.386 0.382 0.611 0.386 88.957 2 283 0.000
Predictors: (Constant), IMIC, IIIS
Table 4.10: The result of linear regression analysis of the influences of transformational leadership on employee loyalty – Coefficients (a)
Model Variable name Unstandardized coefficient Standardized coefficient T Significance level Multi collinearity statistics B Std.
Error Beta Sig. Tolerance
Variance inflation factor (VIF) 1 (Constant) 0.680 0.218 3.112 0.002 IIIS 0.412 0.063 0.372 6.540 0.000 0.670 1.492 IMIC 0.372 0.065 0.328 5.763 0.000 0.670 1.492
Independent variable: II-IS (Leader’s prestige and the ability to use employees’ capacity); IM-IC (Motivation and Care about individuals) Dependent variables: L (Employee
The result illustrates that the significance level (Sig.) of the two variables meets the requirement of p-value< 0.05; the variance inflation factor of two variables reaches the requirement of VIF < 2. Statistical values to evaluate the appropriatenessof the model such as R, R2, adjusted R2and the standard error all meet the requirement with R2= 0.386.
The model is performed again under the multiple linear regression model representing the
influences of two components of transformational leadership on employee loyalty as below: Employee satisfaction = 0.680 + 0.412 x IIIS+ 0.372 x IMIC
Therefore, the components of transformational leadership have positive influence on employee loyalty. The hypotheses of H2.1, H2.2, H2.3 and H2.4 are accepted. Besides, partial regression coefficients of each component (B) as well as standardized regression coefficients (beta) of the factor group of “Leader’s prestige and Ability to use employees’ capacity” and the coefficients of factor group “Motivation and Care about individuals” have no differences in statistical significance. It represents that in order to improve employee loyalty, leaders shall make efforts to improve all components of transformational leadership comprehensively.
4.5.2 Comparison result (ANOVA & T-Test) based on personal characteristics 4.5.2.1 Comparison result based on types of business ownership (ANOVA)
One-factor analysis of variance (One-way ANOVA) is conducted to compare the different levels regarding the Leadership style and Employee and satisfaction as well as Employee loyalty between various types of business and is shown in table 4.11.
Table 4.11: Comparisons based on types of ownership – ANOVA Sum of Squares df Mean Square F Sig. S (Employee satisfaction) Between Groups 1.794 2 0.897 1.736 0.178 Within Groups 145.705 282 0.517 Total 147.499 284 L (Employee loyalty) Between Groups 1.158 2 0.579 0.957 0.385 Within Groups 171.176 283 0.605 Total 172.334 285 IIIS (Leader’s prestige and Ability to use employees’ capacity) Between Groups 0.076 2 0.038 0.076 0.927 Within Groups 140.796 283 0.498 Total 140.872 285 IMIC
(Motivation and Care about individuals)
Between Groups 0.656 2 0.328
0.697 0.499
Within Groups 133.133 283 0.470
Total 133.789 285
• The differentiation has significance when sig <0.05
With all significance levels greater than 0.05, it can be said that there are no differences between employees at other types of business ownership when evaluating the leadership style as well as satisfaction and loyalty.
4.5.2.2 Comparison result of T-TEST
To compare the mean of observed variables regarding age, educational attainment and seniority, we use the Independent samples T-test.
Before testing the mean, we conduct the homogeneity of two variances (Levene’s test) to identify which test results will be used.
Based on the result of Levene’s test, we will consider the testing result t. If the value Sig. in the Levene’s test < 0.05,there are differences between two variances, we will use the testing result in the section of Equal variances not assumed. Conversely, if the value Sig in
the Levene’s test >= 0.05, there are no differences between two variances. Thus, we will use the testing result in the section of Equal variances assumed.
After choosing the testing result t which will be used, we continue to compare the value sig. (sig. (2 tailed) in the t testing. If sig. (2 tailed) < 0.05, we can conclude that the differentiation has significance regarding the mean between groups. If sig. (2 tailed) >= 0.05, we can conclude that there are no significant differences regarding the mean between groups.
Comparison based on employee age
The ages of respondents are divided into two following groups: 30 or younger and above 30.
The testing result of the mean shows that there are no differences in satisfaction and loyalty between age groups.
The testing result of the mean also represents that there are no differences between age groups in terms of evaluations of leadership style.
Comparison based on educational attainment
The testing result depicts that even there are differences between variances regarding loyalty level between two groups of educational attainment (graduate and post-graduate), the testing result of the mean shows no differences between these groups in terms of satisfaction and loyalty level.
The result of Levene’s test illustrates that even there are differences between variances of two groups of educational attainments; the testing result of the mean proves that there are no differences between groups of educational attainment regarding evaluations of transformational leadership.
Comparison based on seniority
The testing result of the mean also illustrates that there are no differences between employee groups regarding seniority (less than 5 years and 5 years and above) in level of satisfaction and loyalty as well as evaluations of transformational leadership.
4.5.3 The testing result of descriptive statistics
4.5.3.1 Descriptive statistics of the practical use of transformational leadership In accordance with the results of descriptive statistics in table 4.12, it can be seen that there is no significant difference regarding evaluations of transformational leadership between types of business ownership. When conducting extensive research, we can realize that the factor group “Leader’s prestige and Ability to use employees’ capacity” is always evaluated higher than the factor group “Motivation and Care about individuals” at all types of business ownership. Employees at the private economic sector evaluate “Leader’s prestige
and Ability to use employees’ capacity” as the highest, whereas for State-owned enterprises, the factor group “Motivation and Care about individuals” is evaluated as the highest.
Table 4.12: The result of descriptive statistics regarding transformational leadership based on types of business ownership
N Mean Standard
deviation
Standard error
95% confidence interval for the
mean
Lowest value
Highest value
Upper Lower Min Max
IIIS Private 93 3.7688 0.7073 0.0733 3.6231 3.9145 1 5 State 94 3.7420 0.6784 0.0700 3.6031 3.8810 1 4.75 State 99 3.7298 0.7281 0.0732 3.5846 3.8750 2 5 Total 286 3.7465 0.7031 0.0416 3.6647 3.8283 1 5 IMIC Individual 93 3.5548 0.7236 0.0750 3.4058 3.7039 1.2 5 State 94 3.6426 0.6144 0.0634 3.5167 3.7684 1.8 4.8 State 99 3.5313 0.7132 0.0717 3.3891 3.6736 1.8 5 Total 286 3.5755 0.6852 0.0405 3.4958 3.6553 1.2 5
Notation: 1 –Strongly disagree 2 - Disagree
3 –Neitheragree nor disagree 4 -Agree 5- Strongly
agree
It can be explained as follows: at private enterprises, the systematic characteristic of assigning jobs, rewarding, fining and encouraging employees is not essential. Employees are therefore directly affected by their leaders every day. Consequently, employees will highly evaluate their leaders for the expressions of prestige and the ability to use employees’ capacity.
On the other hand, at State-owned enterprises which are still considered as being heavy with bureaucracy, distinction of rank and seniority compared to private enterprises and foreign-owned companies, employees will highly evaluate their leaders for the expressions
of building motivation and caring their individuals.
The result of descriptive statistics of transformational leadership based on employee age shows that there is no significant difference in the way they evaluate transformational leadership between employees of different age groups.
The result of descriptive statistics of transformational leadership based on employee qualifications shows that there is no significant difference in the way they evaluate transformational leadership between employees who have various educational attainment.
The result of descriptive statistics of transformational leadership based on employee’s seniority shows that there is no significant difference in the way they evaluate transformational leadership between employees who have different seniority.
4.5.3.2 Descriptive statistics of practical application of employee satisfaction and loyalty
Regarding the results of descriptive statistics in table 4.13, it can be seen that there is no significant difference in terms of the level of employee satisfaction and loyalty at enterprises which have different types of business ownership.
Table 4.13: The results of descriptive statistics of employee satisfaction and loyalty based on types of business ownership
N Mean Standard
deviation
Standard error
95% confidence interval for the
mean Lowest value Highest value Upper Lower Min Max S Private 93 3.4194 0.8285 0.0859 3.2487 3.5900 1 5 State 93 3.6156 0.5950 0.0617 3.4931 3.7381 1.75 4.75 State capital 99 3.5101 0.7142 0.0718 3.3677 3.6525 1.5 5 Total 285 3.5149 0.7207 0.0427 3.4309 3.5989 1 5 L Private 93 3.4602 0.8118 0.0842 3.2930 3.6274 1.6 5 State 94 3.5915 0.7118 0.0734 3.4457 3.7373 1.2 5 State capital 99 3.6000 0.8046 0.0809 3.4395 3.7605 1.8 5 Total 286 3.5517 0.7776 0.0460 3.4612 3.6423 1.2 5
Notation:1 –Strongly disagree2 – Disagree3 –Neither agree nor disagree4 –Agree5- Strongly agree
The result of descriptive statistics of employee satisfaction and loyal based on age shows that there is no significant difference regarding the level of employee satisfaction and loyalty at different ages.
The result of descriptive statistics of employee satisfaction and loyal based on qualifications shows that there is no significant difference regarding the level of employee satisfaction and loyalty at different groups of qualifications.
The result of descriptive statistics of employee satisfaction and loyal based on employee’s seniority shows that there is no significant difference regarding the level of employee satisfaction and loyalty at different groups of employee’s seniority.
4.6 TESTING RESULTS OF HYPOTHESES
Table 4.14: Testing results of hypotheses
Theory Measurement
result H1.1 Performance level “Leader’s prestige” increases or decreases then
employee satisfaction increases or decreases respectively
Accepted p<0.001 H1.2 Performance level of activities to motivate employee morale of
leaders increases or decreases then employee satisfaction increases or decreases respectively
Accepted p<0.001 H1.3 Performance level of activities to care about individuals increases
or decreases then employee satisfaction increases or decreases respectively
Accepted p<0.001 H1.4 Performance level of activities to encourage the application of
employees’ intellectual capacity of leaders increases or decreases then employee satisfaction increases or decreases respectively
Accepted p<0.001
H2.1 Performance level of “Leader’s prestige” increases or decreases then employee satisfaction increases or decreases respectively
Accepted p<0.001
H2.2 Performance level of activities to motivate employee of leaders increases or decreases then employee satisfaction increases or decreases
Accepted p<0.001 H2.3 Performance level of activities to care about individuals increases
or decreases then employee satisfaction increases or decreases respectively
Accepted p<0.001 H2.4 Performance level of activities to encourage the application of
employees’ intellectual capacity of leaders increases or decreases then employee satisfaction increases or decreases respectively
Accepted p<0.001
4.7 THE SUMMARY OF CHAPTER 4
Chapter 4 demonstrates research models, data processing methods; survey samples description, evaluations of measurement scales, results of measurement and analyses; research on measurement scales of components of transformational leadership as well as employee satisfaction and loyalty at enterprises in Ho Chi Minh City.
The research results depict that measurement scales used to research components of transformational leadership as well as employee satisfaction and loyalty all have accepted Cronbach’s Alpha reliability. However, the results of exploratory factor analysis show that it is needful to reduce research models and transformational leadership is consequently divided into two factor groups as follows: (1) Leader’s prestige and Ability to exploit employee capacities; (2) Motivation and Care about individuals; the group satisfaction and loyalty is reduced from 3 to 2 group factors such as (1) Employee satisfaction and (2) Employee loyalty.
The results collected from Chapter 4 will be used in Chapter 5 as the foundation to propose solutions and recommendations to increase positive influences of transformational leadership on employee satisfaction and loyalty at Vietnamese enterprises.
CHAPTER 5 CONCLUSIONS AND RECOMMENDATIONS
5.1 GENERAL EVALUATION5.1.1 Practical uses of leadership style at enterprises
According to researches, practical uses of transformational leadership at enterprises include four main components:
(1) Leader’s prestige or The influence of the ideal
(2) Motivation
(3) Care about individuals
(4) Encourage to exploit intellectual capacities of employees They are summarized into two group of factors:
(1) Leader’s prestige and Ability to use employees’ capacity (2) Motivation and Care about individuals
This proves that practical uses of leadership style at enterprises are not clear and adequate.
The comparison result between ANOVA and T-Test illustrates no significant differences in leadership styles among types of business ownership, age, educational attainment and seniority of employees.
5.1.2 The effects of leadership styles on employee satisfaction and loyalty
The research results depict that two component groups of transformational leadership have influences on employee satisfaction and loyalty with different levels. Among them, the factor group “Leader’s prestige and Ability to use employees’ capacity” has greater influence on employee satisfaction and loyalty.
Therefore, when leaders perform their prestige or influences and ability to exploit employees’ intellectual capacities, conduct activities to build motivation and express their cares about each individual, they will receive positive feedbacks from employees. These features of the transformational leadership really foster the level of employee needs to a higher one (self–actualization needs); thereby, bringing employees the feeling of satisfaction and loyalty. The attention of leaders to employees will receive positive attitudes of employees towards jobs and organizations in return, and gradually it will strengthen job efficiency, satisfaction and loyalty level.
These results are appropriate to other researches on leadership style (Bass & Avolio; 1990; Jung & Berson; 2003; Pillai & William, 2004; Fernades & Awamleh, 2004).
The comparison result between ANOVA and T-Test indicates that there are no significant differences in influences of the transformational leadership on employee satisfaction and loyalty among types of business ownership, age, educational attainment and seniority of employees.
5.2 SOLUTIONS AND RECOMMENDATIONS
The research results show the effect level of the transformational leadership on employee satisfaction and loyalty. Consequently, in order to increase employee satisfaction and loyalty so as to receive invaluable benefits that these two factors bring with enterprises, leaders shall pay attention to four components of the transformational leadership in the order of influence levels as below:
(1) Leader’s prestige or The influence of the ideal
(2) Encourage employees to exploit their intellectual capacities
(3) Motivation
(4) Care about individuals
To conduct everything consistently and strategically, leaders shall concentrate on the factor of corporate culture and build the culture of “leadership for employee satisfaction and loyalty” in organizations.
5.2.1 Leader’s prestige and The influence of the ideal
With the role of leaders through building vision for organizations, leaders gain respect and trust from employees. Leader’s prestige will contribute to increasing the absorption rate of employees towards challenging objectives.
Always expressing competence and confidence
Leaders are not required to implement operational works, but in case of problems or extremely difficult projects and works, leaders shall be the pioneers to solve them directly. Additionally, through the process of handling problems, leaders shall express calmness and confidence to prove their own capacities. Employees will observe and remember these expressions for a long time and this is one part of building leader’s prestige.
Building trust and pride in employees towards leaders
In order to build and strengthen the influence, leaders shall gain employee trust by putting organization’s benefits over personal benefits and employee’s needs over leader’s needs. More importantly, when conducting these things, leaders shall “talk” to make employees understand that.
For Vietnamese enterprises in general, it does exist a certain gap in the relationship