Software Maintenance In Taiwan And A Comparative Analysis With Other Countries
7
0
0
全文
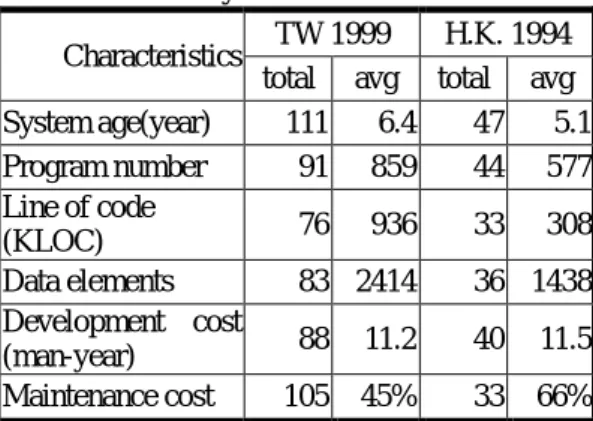
(2) software development 5. questions about how the organization and management issues 6. questions for the major maintenance problems 7. specific question focus on the Y2K fix We sent out 1000 questionnaires to the information system departments in the top 1000 enterprises listed by the Common Wealth magazine. A total of 111 valid responses were received. We summaries the data from the first six part and make some comparison with data reported from other sources in Section 3. The Y2K data are reported in Section 4. Section 5 summaries our findings.. 3.. A Compar ative Analysis of Sur vey Data with those from other countr ies. The manufacturing industry dominates the percentage of respondents at 46%, followed by the government organizations at 21%, the banking/financial industry at 16%. The rest of the respondents are from retail, transportation, information technology and other types of industry. The majority of the respondents (at 66%) are at manager or group leader positions. The respondents have an average working experience of 8 years in software maintenance, and an average of 10 people report to them. The average number of their information system departments is 40 people. 3.1.. suspect the maintenance cost would most likely reach above 70%. Table 3-1 shows the comparison of our data with Yip's data. The survey result of the system development strategy is shown in Table 3-2. The percentage of outsourcing is much higher than that in Yip's survey. There are tow possible reasons for this. First of all, our survey is conducted later than Yip's, and outsourcing becomes a more acceptable option only in recent years. Secondly, the average headcount of the IS department in our data is 40, significantly lower than the average in Yip's data, which is 127. Outsourcing is certainly a more attractive and sometimes the only option for an IS department with fewer resources. Other items with notable differences are the usage of 4GL and CASE. Again, the number of IS people plays a key role, since larger IS departments would take the lead in adopting software engineering methods and tools [8]. Table 3-2. System development strategy TW 1999(111) H.K. 1994(45) Strategy total % total % In-house 52 47% 30 67% Package. 21. 19%. 10. 22%. Outsourcing. 37. 33%. 5. 11%. 4GLs. 4. 4%. 10. 22%. CASE. 2. 2%. 8. 17%. Others. 3. 3%. -. -. Typical software char acter istics. We asked the respondents to select a typical software system based on three criteria: the system must be released more than 6 months, a fair amount of resources were allocated to the system, and the system should be an important asset to the organization. We find that an average system is about 6.4 years old and costs 11.2 man-years to develop. An average system consists of 859 programs, 936 thousand line of code (KLOC), and 2414 data elements.. The programming languages used are shown in Table 3-3. The last item in the table, others, include clipper(5%) 、4GLs(4%) 、Informix(3%)and Sybase (3%).The total of the percentage exceeds 100% because some of the systems are developed with more than one languages. Table 3-3. Programming languages used TW 1999(111)H.K. 1994(41) Languages total % total % COBOL 53 48% 12 30%. Table 3-1.System characteristics Characteristics System age(year) Program number Line of code (KLOC) Data elements Development cost (man-year) Maintenance cost. TW 1999 H.K. 1994 total avg total avg 111 6.4 47 5.1 91 859 44 577 76. 936. 33. RPG. 308. 83 2414. 36 1438. 88. 11.2. 40. 11.5. 105. 45%. 33. 66%. The average effort in maintaining these systems already takes 45% of the overall cost in the life cycle, and the effort for the maintenance cost is projected to be 64% for the ultimate life cycle. However, from the Y2K experience, most software outlives their expected age, we. 14. 13%. 9. 22%. C, C++. 6. 6%. 2. 4%. VB, Delphi. 8. 8%. -. -. SQL. 9. 8%. -. -. 4GL. 4. 4%. 9. 22%. 30. 25%. 9. 22%. Others 3.2.. The distr ibution of Maintenance activities. There are two dimensions for the distribution of maintenance activities. The first dimension concerns the different functional categories as discussed previously in the introduction. However, since the term corrective, adaptive, and perfective maintenance may need further.
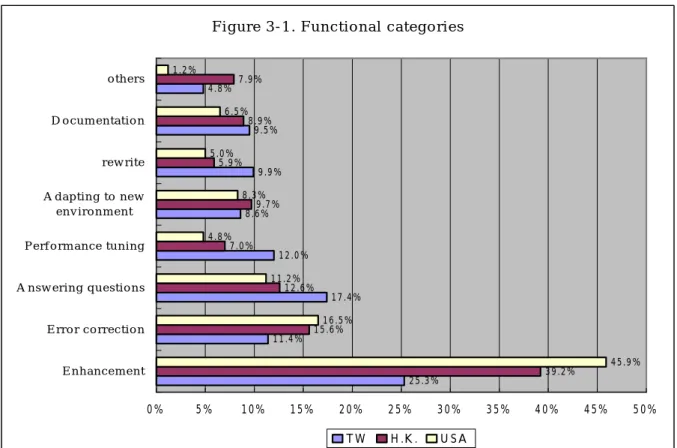
(3) F ig u r e 3 - 1 . F u n c tio n a l c a te g o r ie s 1 .2 %. o th e r s. 4 .8 %. 7 .9 %. 6 .5 %. D o c u m e n ta tio n. 8 .9 % 9 .5 %. 5 .0 % 5 .9 %. r e w r ite. 9 .9 % 8 .3 % 9 .7 % 8 .6 %. A d a p tin g to n e w e n v ir o n m e n t. 4 .8 % 7 .0 %. P e r f o r m a n c e tu n in g. 1 2 .0 % 1 1 .2 % 1 2 .6 %. A n s w e r in g q u e s tio n s. E r r o r c o r r e c tio n. 1 1 .4 %. 1 7 .4 %. 1 6 .5 % 1 5 .6 %. E nhancem ent 0%. 5%. 10%. 15%. 20% TW. explanation before their meaning can be fully understood by the respondents, the questionnaire instead use the more comprehensible terms such as enhancements, error corrections, etc. Other dimensions concern the distribution of activities in the process of a maintenance project, and we divide the process into five major steps: studying request, designing changes, coding, testing, and activities after making the changes such as documentation, training, etc. Table 3-4. Distribution of activities in maintenance process activities TW 1999 HK 1994 USA 1990 Studying requests 22.2% 20.4% 19.4% Designing changes 19.9% 23.4% 29.5% Coding changes 26.4% 28.3% 27% Testing changes 16.4% 18.3% 16% Implementing 12.6% 9.5% 8.2% changes Others 2.5% The distribution in functional category and its comparison with other survey data is shown in Figure 3-1. The enhancement activity weighs the most in all three surveys, an indication of efforts to evolve software systems to the need of the users as well as the business. Comparing the items with the second largest percentage shows an interesting difference. While error correction is the second most significant item in both surveys in Hong Kong and USA, in our survey it is “answering questions.” This might result from insufficient users training, “userunfriendly” design or even an indication of lack of IT application ability in the whole society. In Singapore, Poo and Chung use frequency count to find the two most significant types of maintenance are error correction and enhancement, with the same frequency [6].. 4 5 .9 %. 3 9 .2 %. 2 5 .3 %. 25%. 30%. H .K .. USA. 35%. 40%. 45%. 50%. As show in Table 3-4, coding is the most timeconsuming activity in the maintenance process in both Hong Kong and Taiwan, but in USA, designing outweighs coding slightly. However, Singapore's survey uses ranking scales to find that studying requests is the most time-consuming, followed by designing, and coding [6]. 3.3. Softwar e Maintenance vs. software development The result of our survey in Table 3-5 shows that the percentage of simultaneously performing development and maintenance work is very high in Taiwan as compared to other countries. The Singapore’s data are from Tan and Gable's survey [5]. Table 3-5: The organization of software maintenance. Organization. TW 1999 total. Separate groups Separate assignments Rotating assignments Simultaneous. Organization. total. %. 7 7% 14 15% 4 4% 71 74%. 31 14 5 29. H.K. 1994. USA 1990. total Separate groups Separate assignments Rotating assignments Simultaneous. %. Singapore 1997. 13 5 6 23. % 28% 11% 13% 48%. total. 66% 30% 11% 62%. %. 27 52% 4 8% 3 6% 18 35%.
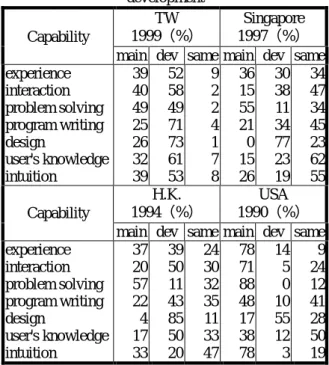
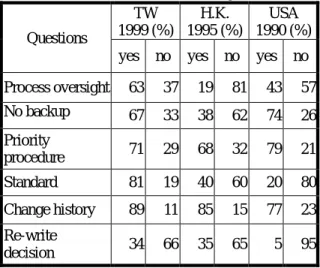
(4) Swanson and Beath classify the departmentalization in development and maintenance into three forms: work (system analysis versus programming), application (application group A versus application group B, A-form), and life cycle phase form (development versus maintenance, L-form) [9]. Separate groups and separate assignments are variants of L-form, and rotating assignments and simultaneous assignments are variants of A-form. After this mapping, we can see that most departmentalization in USA is L-form, and in Hong Kong and Taiwan is A-form. In Singapore, the L-form and the A-form seem to be about the same. Swanson points out that the major drawback of the A-form is the cost of coordination and integration among application groups. The fulfillment opportunities provided by the software development and maintenance work are compared in seven items as shown in Table 3-6. The survey in the USA is conducted in the international conference on software maintenance (ICSM). We suspect that such conference attendants are well recognized for their maintenance work, making their data less representative for the general software maintenance community. Therefore, the following discussion derives from the other three surveys. The data reflect the general perception that the maintenance work is less rewarded than the develop work. The only exception is the fulfillment of responsibility. With fewer people responsible for a software system and a clearer understanding of a system in the maintenance stage, the responsibility for a maintenance staff should be clearer than that of a development staff. Our data also shows that the fulfillment opportunity provided by the software maintenance is clearly higher in Taiwan than in Hong Kong and Singapore. What causes this result needs further investigation. Table 3-6. Fulfillment opportunity: maintenance vs development TW Singapore 1999(%) 1997(%) Fulfillment main dev. same main dev. same satisfaction 36 59 5 0 89 11 challenge 11 84 5 6 68 26 learning 22 74 4 11 68 21 growth 19 72 9 4 77 19 responsible 50 41 9 30 19 51 visibility 11 75 14 4 68 28 salary 11 60 29 2 45 53 H.K. USA 1994(%) 1990(%) Fulfillment main dev. same main dev. same satisfaction 2 83 15 40 28 33 challenge 11 72 17 66 9 26 learning 11 66 23 40 33 28 growth 6 68 26 12 59 29 responsible 76 2 22 visibility 11 59 30 17 62 21 salary 2 28 70 3 26 71 Note: main for maintenance, dev for development.. In an A-form software organization, both development and maintenance are conducted by the same staff. The less-rewarded maintenance work is very likely to rank in low priority in a job list, thus impairing the quality of the maintenance work and ultimately the maintained systems. Since most of organizations are of A-from in Taiwan, such implication should be noted and rectified through possibly management means. On the other hand, the capabilities required by the software development and maintenance work are compared in Table 3-7. Again, the USA data differs significantly from those from other countries. The data conform the belief that development work demands more capability than maintenance does as the development excels in all items except problem solving. As discussed earlier, the corrective maintenance is an important kind of maintenance activity, and the very nature of the corrective maintenance is to fix a certain problem in a system. The weight of such activity in development is comparably little. The differences in the capability requirements between software development and maintenance are comparatively smaller than the differences in the fulfillment opportunities. This may suggest that maintenance work is not properly rewarded. Table 3-7. Capability requirement: maintenance vs development TW Singapore 1999(%) 1997(%) Capability main dev same main dev same experience 39 52 9 36 30 34 interaction 40 58 2 15 38 47 problem solving 49 49 2 55 11 34 program writing 25 71 4 21 34 45 design 26 73 1 0 77 23 user's knowledge 32 61 7 15 23 62 intuition 39 53 8 26 19 55 H.K. USA 1994(%) 1990(%) Capability main dev same main dev same experience 37 39 24 78 14 9 interaction 20 50 30 71 5 24 problem solving 57 11 32 88 0 12 program writing 22 43 35 48 10 41 design 4 85 11 17 55 28 user's knowledge 17 50 33 38 12 50 intuition 33 20 47 78 3 19 Note: main for maintenance, dev for development. 3.4.. Maintenance management. Management has been one of the top three problems in maintenance in previous surveys. Maintenance management includes the maintenance procedures, methods, and standards. Table 3-8 shows the status of the management practice in Taiwan and other countries. There is no data in this category from Singapore’s survey. In the questionnaire, the actual phrases for these questions are as follows: 1. Process oversight: Has the responsibility for overseeing maintenance process been assigned to.
(5) 2.. 3.. 4. 5. 6.. one person? No backup: Are there systems that have to be maintained by individual because no one else understands the program logic? Priority procedure: Do you following a formal procedure for determining priority of maintenance requests? Standard: Do you require that older systems conform to programming standards? Change history: Do you keep the data on the history of change requests? Re-write decision: Do you employ a formal method for determining when programs should be re-written?. standards, considerably higher than other countries. There is, however, one management problem that needs further attention, namely, some systems being maintained by an individual because no one else can do the job. Once such individuals are no longer available, the maintenance work might not be able to be continued. Therefore, it is imperative to train other staff to become backups. From the last item in Table 3-8, it seems that it is not a common practice to use formal method for determining when programs should be re-written. The reason for this should be further pursued. An obvious reason is that there are few formal methods except by Sneed [10] and Ransom, et. al. [11]. This might indicate an area where more research effort could be dedicated to solve the need in the software maintenance practice.. Table 3-8. Maintenance management TW H.K. USA 1999 (%) 1995 (%) 1990 (%) Questions yes no yes no yes no Process oversight. 63. 37. 19. 81. 43. 57. No backup. 67. 33. 38. 62. 74. 26. Priority procedure. 71. 29. 68. 32. 79. 21. Standard. 81. 19. 40. 60. 20. 80. Change history. 89. 11. 85. 15. 77. 23. Re-write decision. 34. 66. 35. 65. 5. 95. 3.5.. Maintenance pr oblems and desir ed changes. There are all kinds of maintenance problems reported by the respondents in our survey. In order to compare our data with others, we adopt the same classification as those used in the surveys in Hong Kong, Singapore and USA. The classification consists of six major factors: management, system characteristics, personnel, user relations, environment, and others. The management factor includes maintenance standards, policies, tools, etc. The system factor covers quality of documentation, program maintainability, etc. The personnel factor contains skills and numbers of personnel, turnover, etc. The user relation factor encompasses user training, management support, etc. The environment factor comprises of business changes, etc. The survey result is displayed in Figure 3-2. Maintenance management is the most problematic area in Taiwan, consistent with findings in other countries. System characteristics factor is another major problem except in Hong Kong. Other factors are not as compelling as these two factors. It denotes research. Generally speaking, the maintenance procedures are well managed in Taiwan. Well over 50% of the respondents’ department follow some formal procedures and oversee the maintenance process. As for standards, it is quite surprising that over 80% of our respondents require the older system conform to programming. F ig u re 3 -2 . M a in te n a n c e p ro b le m s 3 .9 % 1 .7 % 1 .3 %. O th e r s. 1 8 .9 %. E n v ir o n m e n t. 3 .3 % 4 .7 %. U s e r r e la tio n s. 2 7 .5 %. 1 7 .2 % 1 0 .7 %. 1 6 .0 % 1 8 .1 % 1 8 .9 % 2 1 .4 % 1 6 .6 % 1 7 .5 %. P e rso n n e l S y s te m c h a r a c te ris tic s. 2 1 .3 %. 1 1 .3 %. 3 1 .2 %. 1 8 .7 %. 2 8 .3 % 2 6 .5 % 2 7 .2 %. M anagem ent 0%. 5%. TW. 10%. 15%. S in g a p o re. 20%. 25%. H .K .. 30%. U SA. 3 8 .2 %. 35%. 40%. 45%.
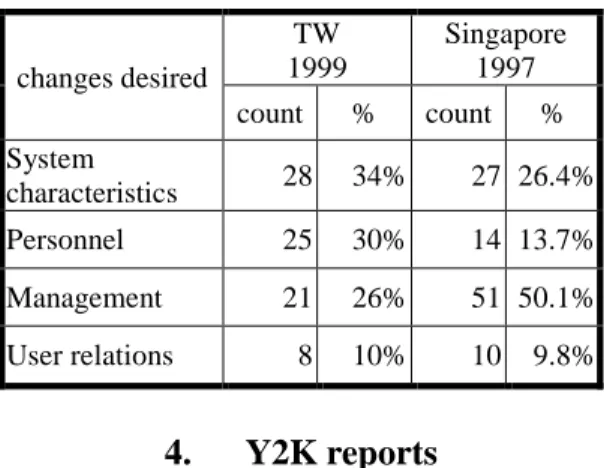
(6) directions that may have significant contribution to software maintenance practitioners. As for the desired changes for software maintenance, only 47 respondents responses to this question. Table 3-9 summaries the result. Only the Singapore data are shown because other data are not accessible. Many respondents in our survey desire that the quality of maintenance documentation needs to be improved, making the percentage of system characteristics highest. Interestingly, although maintenance management is the most problematic factor, it seems to be less desired to change, unlike Singapore’s case. The underlining rationale for this inconsistency is hard to derive from our data. A deeper investigation may shed more lights. Table 3-9. Categories of changes desired. changes desired. TW 1999 count. Singapore 1997 %. count. %. System characteristics. 28. 34%. 27 26.4%. Personnel. 25. 30%. 14 13.7%. Management. 21. 26%. 51 50.1%. User relations. 8. 10%. 10. 4.. 9.8%. Y2K repor ts. We gather data about the Y2K issue with an eye to understand the impact of different maintenance factors on the criticality of the Y2K problems and the productivity and quality of a maintenance project. The detailed analysis is still under way. We merely present some descriptive data on Y2K in this paper. There are 92 respondents providing valid answers to the Y2K part of the questionnaire. With its high visibility in the press and the government oversight, the Y2K project is receiving more attention than ordinary maintenance projects. There are 51% of the Y2K projects are led by top management, 24% led by middle management, and 25% led by project managers. 81 percent of the Y2K projects are in-house, 10 percent are outsourcing, and the rest are carried out in either a mix mode with some inhouse and some outsourcing or by total replacement. Although many experts advise against mixing Y2K problem resolution with other maintenance goals in a Y2K project, there are still 72% of the projects enhancing systems besides fixing Y2K bugs, possibly to gain more support from management. As for the solution approach, 79% of the respondents take the long-term solution by changing the data fields and 77% adopt some special test strategy to carry out the compliance test. Overall, most of the projects seem to approach the Y2K problems in a proper manner technically. The quality of a Y2K project is hard to evaluate. We let the respondents grade their own effort. 39% consider their projects excellent, 45% good, and 15% average. Finally, good news for the software maintenance practitioners is that 58% of the respondents report that after the Y2K crisis, their organizations. appreciate the importance of maintenance more than before. Whether this will promote the maintenance work in the long run remains to be seen [12].. 5.. Conclusions. The result of our survey shows that there are some unique phenomena in Taiwan, and the comparison of our data with others provide interesting and useful information to both software engineering practitioners and researchers. We summarize the major findings from our survey and the results of the comparison with other similar surveys from other countries as follows: 1. The cost of software maintenance in Taiwan is growing to exceed the cost of software development. Our data shows that the percentage of maintenance is projected to climb to 64% from the current 45%. 2. Due to a smaller number of staff in most IS departments, outsourcing is a more attractive option for software development in Taiwan than in other areas. Limited human resource also handicaps the adoption of CASE tools. 3. Answering users’ questions is the second highest percentage functional activity in maintenance. This unique phenomenon may indicate that user training should be emphasized and the software design process should consider more user involvement. 4. From the results of several surveys in different countries, it is generally accepted that the rewards in development work are higher than maintenance work. Moreover, our data shows that most of the software organizations are of A-from in Taiwan. The software managers must realize that the difference would very like result in deterioration of maintenance work. Certain remedial steps must be practiced to prevent such deterioration. Another implication of the difference is that proper allocation of maintenance work development work to the staff is important to motivate staff. 5. The notable differences of our data in the opportunity and the capability comparisons from those from Singapore and Hong Kong lead us to speculate the origins of such differences. The possible factors are that our respondents are largely managers and the majority of the organization of software maintenance also differs significantly from those in Singapore and Hong Kong. 6. Maintenance management and System characteristics are two most problematic items in Taiwan as well as other areas. It denotes research directions that may have significant contribution to the maintenance practitioners. Another area where more research effort could be dedicated is to propose a method to determine when a software system should be re-written or reengineered..
(7) References: [1] von Mayrhauser T.E., “Software Engineering-Methods and Management”, Academic Press, Inc., San Diego, CA., 1990。 [2] Layzell, Paul J. and Macaulay, Linda A., “An Investigation into Software Maintenance---Perception and Practices”, Software maintenance: Research and Practice. Vol.6, pp.105-120, 1994。 [3] Lientz, B. P. and Swanson, E.B., Software Maintenance Management, Addison-Wesley., Reading MA, 1980. [4] Nosek, J.T. and Palvia, P., "Software maintenance management: changes in the last decade", Journal of Software Maintenance, vol. 2, no. 3, pp. 157-174. [5] Dekleva, S.M.,“Software Maintenance - 1990 Status”, Journal of Software Maintenance, Vol.4, pp233-247, 1992。 [6] Yip, S.W., “Software Maintenance in Hong Kong”, proceedings of International Conference on Software Maintenance, pp.88-95, 1995。 [7] Tan, Wui-gee and Gable, Guy G., “Attitudes of Maintenance Personnel Towards Maintenance Work: A Comparative Analysis”, Software Maintenance: Research and Practice 10, pp. 59-74,1998. [8] Poo, D.C.C and Chung, M.K., "CASE and software maintenance practices in Singapore", Journal of Systems and Software 44, pp. 97-105, 1998. [9] Swanson, E.B. and Beath, C.M., “Departmentalization in Software Development and Maintenance”, Communications of the ACM, Volume 33, no. 6, pp. 658 – 667, June 1990. [10] Sneed, H.M., “Economics of Software Reengineering”, Software Maintenance: Research and Practice, vol. 3, pp. 163-182,1991. [11] Ransom, J., Sommerville, I., and Warren, I., “A Method for Assessing Legacy Systems for Evolution”, Enromicro Conference on Software Maintenance and Reengineering, 1998. [12] Rob Thomsett, “The Year 2000 Bug: A Forgotten Lesson”, IEEE Software, July/August 1998, pp. 91-95..
(8)
數據
+2
相關文件
Due to rising prices in fresh vegetables, fish and other seafood, fruit and the price increase in eggs caused by the impact of bird flu found in the neighbouring areas, coupled with
1.16 Works means the construction and maintenance works to be carried out by the contractors not included in the fee proposal appointed and paid separately by the School under
• Thresholded image gradients are sampled over 16x16 array of locations in scale space. • Create array of
Biases in Pricing Continuously Monitored Options with Monte Carlo (continued).. • If all of the sampled prices are below the barrier, this sample path pays max(S(t n ) −
In order to solve the problem of the tough recruitment of students in the future, universities and colleges, in addition to passing the relevant assessment conducted by the
This research explored the school concern on contracting the school building maintenance and management to the property management companies.. To understand the
The aim of this study is to investigate students in learning in inequalities with one unknown, as well as to collect corresponding strategies and errors in problem solving..
In this study, the Taguchi method was carried out by the TracePro software to find the initial parameters of the billboard.. Then, full factor experiment and regression analysis
