Effects of Workplace Conditions on Taiwanese Workers’ Quality of Life
9
0
0
全文
(2) Wen-Miin Liang, et al.. 207. in 1990 to 33.1% in 1998. Nine percent of. Quality of life is a broad ranging. workers reported feeling stress and anxiety in. concept, incorporating, in a complex way, the. the workplace. Fifty one percent reported. persons' physical health, psychological state,. experiencing stress but not anxiety [2]. Stress. level of independence, social relations,. and anxiety in the workplace can affect. personal beliefs, and relationship to salient. workers' performance efficiency and quality. features of the work environment [8]. The. of life (QOL) [3]. QOL in this study is defined. World Health Organization Quality of Life. as individuals' perceptions of their position in. (WHOQOL) questionnaire is a multidi-. life, in the context of the culture and value. mensional, multilingual profile which was. systems in which they live and in relation to. designed. their goals, expectations, standards and. assessment [9]. The main outcome measures. for. cross-cultural. subjective. concerns [4]. Previous studies [5,6] have shown. were QOL scores for the Taiwan edition of the. that QOL can be affected by life satisfaction,. WHOQOL-BREF questionnaire which includes. which in turn may be related to conditions in. 24 facets and two global WHOQOL items from. the workplace and may affect the worker. the WHOQOL conceptual constructs and two. turnover rate. There is little data in the. additional facets specifically designed for the. literature to show the effect of work. Taiwan WHOQOL-BREF edition [10]. The 28. conditions in the workplace on QOL. The. facets on the QOL questionnaire were assigned. objective of this study was to evaluate. conceptually to four domains: physical,. workers' QOL and to understand the. psychological, social relationships and. relationship between QOL and conditions in. environment. The scores for some facets were. the workplace.. reversed to allow for comparisons with other facets with a scale of 1 to 5 representing "very. MATERIALS AND METHODS. good(4), very good(5)". A higher score meant a. Subjects Population We randomly selected 1884 workers from Taiwan's Labor Insurance Bureau registry. (7,597,386). bad(1), bad(2), neither bad nor good(3),. on. a. proportional. probability basis. Further details of the sampling strategy used are described in Liang (2001) [7]. Subjects' demographic profiles were very similar to individuals of each occupation in the general worker population. Of the 1884 workers, 1726 (91.6%) were interviewed. Instruments. higher QOL in that facet. Interviewers completed each interview within 30 to 40 minutes. Companies/factories were contacted to arrange time for the workers to be interviewed privately. Before the study, the questionnaire was pre-tested to check the wording, sequencing and ease of comprehension and was modified accordingly. Five experts from the various fields (public health, statistics, environmental health, epidemiology and occupational hygiene). A structured questionnaire which. conducted a content validity test. Twenty. included workers' demographic data and QOL. subjects were used to test the reliability of the. was administered to each worker. Conditions. QOL questionnaire (Cronbach's coefficient,. in the workplace were determined by. range: 0.83 0.87).. selfevaluation in the form of a questionnaire.. Statistical Analysis. Workers were interviewed to determine which items on the questionnaire caused stress and anxiety, and which coping strategies were employed. Workers estimated the number of hazards in the workplace and were asked to assess how well the workplace made provisions for workers' health and safety.. All data were analyzed using the SAS/pc 6.12 package [11] and frequencies of stress and anxiety and coping strategies among males and females were compared. Multivariate logistic regression was used to analyze the factors that affected QOL. There were no.
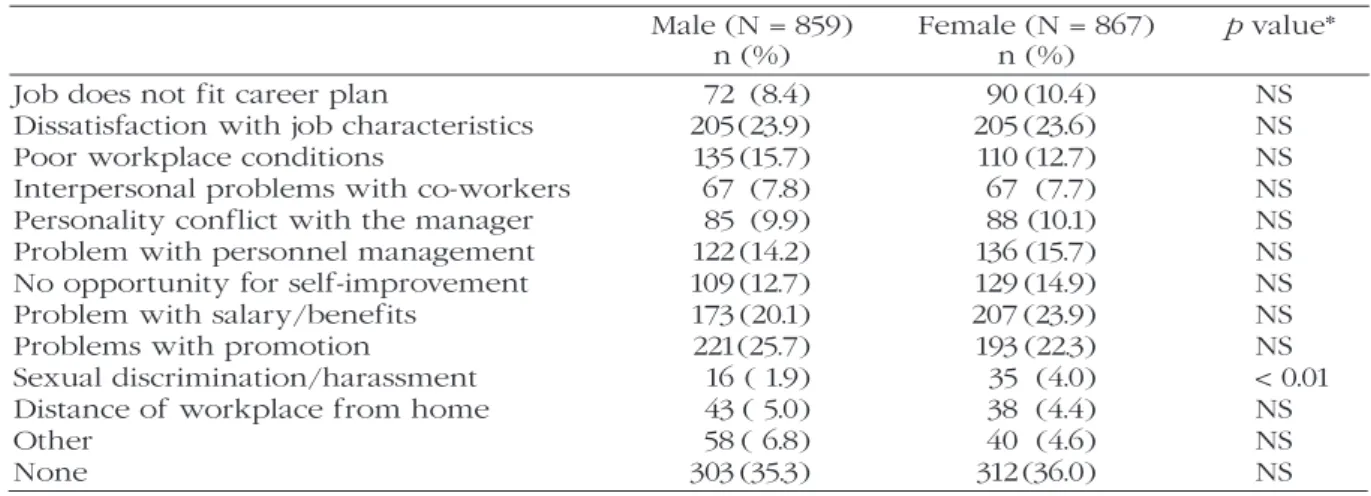
(3) 208. Workplace Conditions on Worker' Quality of Life. Table 1. Causes of stress and anxiety in the workplace among males and females (multi-choice). Job does not fit career plan Dissatisfaction with job characteristics Poor workplace conditions Interpersonal problems with co-workers Personality conflict with the manager Problem with personnel management No opportunity for self-improvement Problem with salary/benefits Problems with promotion Sexual discrimination/harassment Distance of workplace from home Other None. Male (N = 859) n (%). Female (N = 867) n (%). 72 (8.4) 205 (23.9) 135 (15.7) 67 (7.8) 85 (9.9) 122 (14.2) 109 (12.7) 173 (20.1) 221 (25.7) 16 ( 1.9) 43 ( 5.0) 58 ( 6.8) 303 (35.3). 90 (10.4) 205 (23.6) 110 (12.7) 67 (7.7) 88 (10.1) 136 (15.7) 129 (14.9) 207 (23.9) 193 (22.3) 35 (4.0) 38 (4.4) 40 (4.6) 312 (36.0). p value* NS NS NS NS NS NS NS NS NS < 0.01 NS NS NS. *Based on chi-square test.. Table 2. Coping methods among males and females (multi-choice). Sleeping Exercise Going to movie theaters/Shopping Traveling Drinking Smoking Playing video parlor games Singing or playing musical instruments Praying Complaining to friends or relatives Discussing problems with the boss Other. Male (N = 859) n (%). Female (N = 867) n (%). p value*. 507 (59.0) 307 (35.7) 153 (17.8) 103 (12.0) 98 (11.4) 163 (19.0) 79 (9.2) 84 (9.8) 63 (7.3) 184 (21.4) 92 (10.7) 53 (6.2). 529 (61.0) 296 (34.1) 303 (34.9) 164 (18.9) 19 (2.2) 16 (1.8) 43 (5.0) 98 (11.3) 98 (11.3) 316 (36.4) 75 (8.7) 47 (5.4). NS NS < 0.01 < 0.01 < 0.01 < 0.01 < 0.01 NS < 0.01 < 0.01 NS NS. *Based on chi-square test.. significant differences between males and females with regard to the demographic data. Because of some incomplete questionnaire items, all analyses were based on the maximum valid sample.. work (23.9%) and workplace conditions (15.7%). For females, the most frequently reported item was salary and benefits (23.9%), followed by nature of work (23.6%) and career advancement and promotion (22.3%). The coping strategies of male and female workers are compared in Table 2. The most. RESULTS. frequent strategy among males was sleeping. Table 1 shows the items for stress and anxiety in the workplace for males and females. There were no differences for all items except for sexual discrimination/ harassment (females = 4.0%, males = 1.9%). Approximately 65% of workers reported experiencing stress and anxiety in the workplace. The most frequently reported item among males was career advancement and promotion (25.7%), followed by nature of. (59.0%), followed by exercising (35.7%). Among females, the most frequent coping strategy was sleeping (61.0%), followed by complaining to friends or relatives (36.4%). There were significant differences between males and females for the following items: alcohol consumption, smoking, going to video game parlors, going to movie theaters/shopping, traveling, praying, and complaining to friends or relatives. The former three items were more.
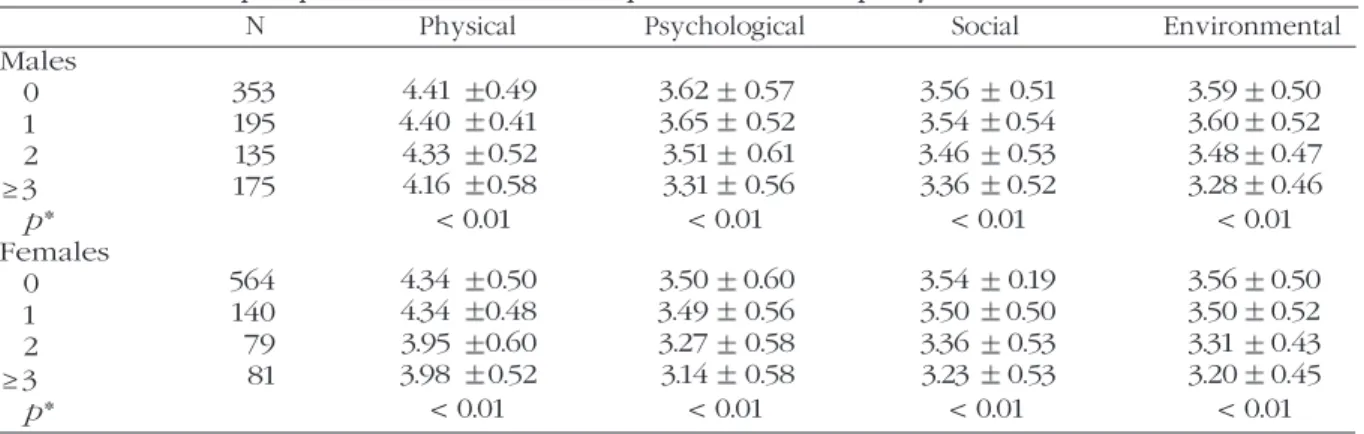
(4) Wen-Miin Liang, et al.. 209. Table 3. Relationship of perceived number of workplace hazards and quality of life for males and females Males 0 1 2 ≥3 p* Females 0 1 2 ≥3 p*. N. Physical. Psychological. Social. Environmental. 353 195 135 175. 4.41 0.49 4.40 0.41 4.33 0.52 4.16 0.58 < 0.01. 3.62 0.57 3.65 0.52 3.51 0.61 3.31 0.56 < 0.01. 3.56 0.51 3.54 0.54 3.46 0.53 3.36 0.52 < 0.01. 3.59 0.50 3.60 0.52 3.48 0.47 3.28 0.46 < 0.01. 564 140 79 81. 4.34 0.50 4.34 0.48 3.95 0.60 3.98 0.52 < 0.01. 3.50 0.60 3.49 0.56 3.27 0.58 3.14 0.58 < 0.01. 3.54 0.19 3.50 0.50 3.36 0.53 3.23 0.53 < 0.01. 3.56 0.50 3.50 0.52 3.31 0.43 3.20 0.45 < 0.01. * Based on F-test of one-way ANVOA.. Table 4. Comparison of male and female workers' satisfaction with workplace conditions and quality of life Males Excellent Good No opinion Poor Very poor p* Females Excellent Good No opinion Poor Very poor p*. N. Physical. Psychological. Social. Environmental. 102 357 353 353 4. 4.54 0.40 4.41 0.46 4.25 0.57 3.99 0.60 4.02 0.86 < 0.01. 3.90 0.53 3.64 0.54 3.39 0.54 3.19 0.56 2.79 0.86 < 0.01. 3.80 0.52 3.59 0.49 3.35 0.50 3.27 0.54 2.95 1.12 < 0.01. 3.86 0.50 3.58 0.49 3.36 0.43 3.23 0.51 2.84 0.92 < 0.01. 87 350 342 52 4. 4.60 0.68 4.36 0.42 4.18 0.55 4.18 0.55 3.79 0.27 < 0.01. 3.85 0.62 3.54 0.57 3.31 0.56 3.31 0.56 3.13 0.42 < 0.01. 3.85 0.50 3.57 0.45 3.37 0.49 3.37 0.49 3.10 0.48 < 0.01. 3.88 3.52 3.59 0.47 3.34 0.45 3.18 0.47 2.88 0.23 < 0.01. * Based on F-test of one-way ANVOA.. frequent among males, and the latter four. conditions. When the male satisfaction rating. items were more frequent among females.. was 'very poor', QOL scores in psychological,. There was a significant negative. social and environmental domains were lower. correlation between number of hazards and. than 3. However, for females, only the latter. QOL for both males and females. The higher. domain was lower than 3.. the perceived number of hazards in the. Table 5 shows the relationship of stress. workplace, the lower the QOL was. Males had. and anxiety with QOL. When workers (males. consistently higher QOL scores in each of the. and females) reported both stress and anxiety. four domains compared to females. The mean. in the workplace, QOL scores were lowest in. score in the physical domain was higher than. each of the four domains, followed by stress. in the other domains (Table 3).. only. There were significant differences. Male and female workers' satisfaction with workplace conditions and QOL is. between the three groups (None, stress only, both stress and anxiety) in each domain.. compared in Table 4. Males and females' QOL. Using multiple regression analysis, the. scores were similar in each domain, but males'. males' QOL scores in the physical and. QOL scores were slightly higher. There were. psychological domains were higher than for. significant positive correlations between QOL. females. QOL was lowest among workers. scores and satisfaction with workplace. under the age of 30. The highest QOL score.
(5) 210. Workplace Conditions on Worker' Quality of Life. Table 5. Relationship of stress and anxiety among males and females with quality of life Males None Stress only Both p* Females None Stress only Both p*. N. Physical. Psychological. Social. Environmental. 227 507 116. 4.52 0.40 4.30 0.53 4.19 0.52 < 0.01. 3.74 0.55 3.50 0.56 3.35 0.60 < 0.01. 3.65 0.50 3.48 0.53 3.27 0.49 < 0.01. 3.67 0.50 3.46 0.48 3.28 0.51 < 0.01. 236 491 109. 4.43 0.50 4.24 0.52 4.09 0.56 < 0.01. 3.65 0.01 3.40 0.56 3.20 0.65 < 0.01. 3.63 0.43 3.46 0.50 3.30 0.60 < 0.01. 3.66 0.52 3.40 0.49 3.29 0.52 < 0.01. * Based on F-test of one-way ANVOA.. was among 45 to 60 year-olds in the. workers [12]. A survey of 18,120 workers. psychological domain, but for 30 to 44 year-. conducted by Taiwan's Council of Labor in. olds, the highest QOL score was in the social. 1998, revealed that 57% of workers were. domain. For occupation, QOL scores were. dissatisfied with conditions in the workplace.. highest among specialists. There was a. The chief complaint of all workers was. negative correlation between QOL and. exposure to workplace hazards due to noise,. anxiety and stress: workers who reported. dust and temperature. About 20% reported. both stress and anxiety had the lowest QOL. having fallen in the workplace, and 29%. scores. There was a negative correlation. reported sustaining cuts or abrasions.. between number of perceived hazards in the. Causes of stress and anxiety were similar. workplace and QOL scores, and a positive. for males and females. Males were most. correlation. concerned. between. satisfaction. with. about. problems. related. to. workplace safety and health conditions and. promotion (25.7%), whereas females were. QOL scores (Table 6).. most concerned about salary and benefits (23.9%). Neither males nor females expressed much concern about conditions in the. DISCUSSION. workplace. This may be due to a perceived. The increasing number of hazards in the. lack of hazards in the workplace or to. workplace over the past two decades has had. workers' abilities to tolerate these hazards.. a considerable impact on workers' health. In. Pugliesi [13] stated that "differential exposure. 1990, Taiwan's Council of Labor implemented. and vulnerability to social roles and role. a plan to improve safety and health conditions. characteristics have been suggested to account. in the workplace. The measures included a. for gender differences in well-being" and that. zero injury policy, and self-monitoring of. "these differences occur primarily in the. safety conditions. In addition, companies and. proximate effects of self-esteem and social. factories were encouraged to improve and. integration on distress and happiness". Our. maintain health and safety conditions. More. results indicate that Taiwanese workers are. than 80% of companies in Taiwan employ 30. able to accept a hazardous workplace. workers or less, and the managers of these. provided that they are satisfied with their job. companies have so far shown a poor response. in other areas, such as salary and benefits.. to the Council of Labor's health and safety. According to our study, males' and females'. guidelines. To help combat this problem the. coping methods were also significantly. Council has recently begun monitoring. different except for sleeping which was the. workplace health and safety conditions in. most common coping strategy for both sexes.. different kinds of industries to identify which. Discussing problems with the manager is. companies pose the greatest hazards to. generally regarded as an effective way of.
(6) Wen-Miin Liang, et al.. 211. Table 6. Factors affecting workers' quality of life using multiple regression analysis Domain Sex Female Male Age (yr) ≤ 29 30 44 45 59 ≥ 60 Occupation Non/semi-skilled Skilled Semi-professional Professional Specialist Stress and Anxiety None Stress only Both Number of perceived hazards 0 1 2 ≥3 Satisfaction with safety and health conditions Very poor Poor No opinion Good Excellent. N. Physical p. Psychological p. 773 801. 0 0.096. 464 739 342 29. 0 0.000 0.061 0.149. 0 0.068 0.129 0.072. 445 351 370 360 48. 0 0.012 0.050 0.016 0.187. *. 0 0.036 0.032 0.052 0.167. *. 0 0.011 0.082 0.046 0.129. 422 938 214. 0 0.173 0.209. *** ***. 0 0.178 0.277. *** ***. 0 0.115 0.239. 822 317 199 236. 0 0.036 0.141 0.175. *** ***. 0 0.065 0.053 0.185. 7 84 639 664 180. 0 0.096 0.398 0.530 0.662. * ** ***. 0 0.249 0.481 0.651 0.893. ***. 0 0.112. Social p. Environmental p 0 0.026. 0 0.021. ***. *** **. 0 0.041 0.084 0.122. *. 0 0.050 0.018 0.023 0.147. *. *** ***. 0 0.123 0.242. *** ***. ***. 0 0.011 0.051 0.111. **. 0 0.027 0.082 0.187. * ***. * ** ***. 0 0.391 0.492 0.669 0.840. * ** *** ***. 0 0.490 0.606 0.790 1.020. ** *** *** ***. 0 0.110 0.095 0.127. * **. *. *p < 0.05; **p < 0.01; ***p < 0.001 (Based on Wald's test).. coping with stress and anxiety in the. other stress-relieving activities, such as. workplace, and yet our results showed that. meditation and flower arranging. Companies. only about 10% of males and females reported. are being encouraged to promote these stress. using this coping strategy. Females were more. reduction activities among their workers.. willing than males to share their problems. Workplace QOL was significantly related. with a relative or friend. However, both male. to. and female reluctance to discuss their stress at. satisfaction with safety and health conditions.. work could have a marked effect on their. There have been few studies which have. commitments to the workplace and the QOL. investigated. of the individual workers. The vast majority. workplace stressors and workers' QOL. A. of companies in Taiwan do not make use of. previous. psychological counselors, so workers must. relationship between interpersonnel conflict at. relieve their stress and anxiety in other ways,. work and psychological outcomes. Cheung. such as sleeping, exercise and shopping. The. compared sex differences with job satisfaction. DOH is currently implementing health. and found that sex was not attributable to. promotion and education in semi-conductor. differences in work values. Cheung suggests. manufacturers and includes recommendations. that "placing higher values on the tasks and. to increase physical activity and participate in. team dimensions, and a lower value on the. perceived. number. the. study. of. hazards. relationship [14]. and. between. emphasized. the.
(7) 212. Workplace Conditions on Worker' Quality of Life. reward dimensions lead to greater job. correlated to workers' QOL. The authors. satisfaction" [15]. Job factors (e.g. job control,. suggest that companies constantly monitor. pay) and job attitudes (e.g. satisfaction,. and improve workplace conditions in order to. alienation and stress) had a significant effect. minimize the risks posed to workers and. on workers' physical and psychological well-. thereby reduce workers' stress and anxiety.. being [5]. A longitudinal study was conducted to investigate women's work experiences in a. ACKNOWLEDGEMENTS. male-dominated industry. The results showed. The authors would like to thank the. a relationship between work-role quality and. Institute of Occupational Health and Safety,. QOL and self-reported health [16]. In the. Council of Labor for their administrative and. current study, our results indicate that. financial support, and all interviewers who. workplace conditions may be affected by job. participated in the program for their help.. satisfaction which in turn may have an impact on QOL. Satisfaction with safety and health. REFERENCES. conditions is one part of overall job. 1. Lund T, Borg V. Work environmental and self-rated. satisfaction. Organizational and individual. health as predictors of remaining in work 5 years. factors affect mental health and job satisfaction. later among Danish employees 35-59 years of age.. [17]. Workers who reported that they perceived safety and health conditions to be. Exp Aging Res 1999;25:429-34. 2. Chen S. Survey on safety and health condition among Taiwanese workers. Bull Safety and Health. excellent had the highest QOL scores, especially for the environmental domain.. (Chinese) 2000;42:6-9. 3. Achat H, Kawachi I, Levine S, et al. Social networks,. Because the current study is crosssectional, it is very difficult to accurately establish the relationship between QOL and workplace conditions. In addition, there is no. stress and health-related quality of life. Qual Life Res 1998;7:735-50. 4. Coburn D. Work and general psychological and physical well-being. Int J Health Serv 1978;8:415-35. 5.. baseline data with which to compare our data.. between pain and discomfort and quality of life,. Future studies may be compared with the results of the current study to show the. using the WHOQOL. Pain 1998;76:395-406. 6. Demestoy N, Brouillette L, De Courval LP. Stress and residents' lifestyle. Survey of family medicine. effectiveness of future government policies or. residents at McGill University. Can Fam Physician. programs related to health and safety. Another limitation is the use of questionnaires which. Skevington SM. Investigating the relationship. 1993;39:1576-80. 7. Liang WM, Kuo HW, Wang CB, et al. Development of. may not accurately reflect the workers'. an. exposure to hazards in the workplace. Despite. epidemiological study. Taiwan IOSH88-M301, 1999.. these limitations, the results of this study are. 8.. Group.. Quality. population. The of. World. Life. for. Health. Assessment. properties. Soc Sci Med 1998;46:1569-85. 9.. The WHOQOL Group. Development of the World Health Organization WHOQOL-BREF quality of life. safety conditions. In conclusion, our findings show that males and females employ different coping strategies and that there are different causes of stress and anxiety for both sexes. Only 13.5% of males and 12.5% of females reported that poor workplace conditions caused stress and anxiety. Workplace conditions (such as number. referent. (WHOQOL): development and general psychometric. be a reference used by Taiwan's Council of. perceived. WHOQOL. Organization. very consistent. Furthermore, our data could Labor to monitor and improve health and. The. occupation. of. hazards. in. the. workplace, safety and health conditions, level of stress and anxiety) were significantly. assessment. Psychol Med 1998;28:551-8. 10. Lin ML, Yao KP, Hwang JS, et al. Scale descriptor selection for Taiwan-version of questionnaire of World Health Organization quality of life. Taiwan Public Health Assoc J 1999;18:262-70. 11. SAS/STAT, User's Guide. Release 6.12, SAS Cary, N.C., 1992. 12. Chang CK. Introduction of assessment and selfevaluation in hazardous workplace based on regulation of inspection. Bull Work Safety and Health (Taiwan) 1994;7:6-7. 13. Pugliesi K. Work and well-being: gender differences.
(8) Wen-Miin Liang, et al.. in the psychological consequences of employment. J Health Soc Behav 1995;36:57-71. 14. Frone MR. Interpersonnal conflict at work and psychological outcomes: testing a model among young workers. J Occup Health Psychol 2000;5: 246-55.. 213. 16. Bergman B, Carlsson SG, Wright I. Women's work experiences and health in a male-dominated industry. A longitudinal study. J Occup Environ Med 1996;38:663-72. 17. Elovainio. M,. Kivimaki. M,. Steen. N,. et. al.. Organizational and individual factors affecting. 15. Cheung CK, Scherling SA. Job satisfaction, work. mental health and job satisfaction: a multilevel. values, and sex differences in Taiwan's organization.. analysis of job control and personality. J Occup. J Psychol 1999;133:563-75.. Health Psychol 2000;5:269-77..
(9) 214. 7,597,386. 2002;7:206-14. 404 7/30/2002 10/22/2002. 91 10/21/2002. 1,726.
(10)
數據
相關文件
2.28 With the full implementation of the all-graduate teaching force policy, all teachers, including those in the basic rank, could have opportunities to take
The relief fresco "Stories of the Buddha's Life" embody the advancement of life education: a profound outlook on life, religion and life and death, ultimate care, life
% Urban university professors 93 Skilled printers 52 Mathematicians 91 Paper workers 42 Physicists 89 Skilled auto workers 41 Biologists 89 Skilled steelworkers 41 Chemists 86
files Controller Controller Parser Parser.
Among them, service quality and sex, age, level of education, marital status, average month income and class Present notable difference... Job Pressure and service quality of
In the second phase, quality characteristics optimization- to meet the target under the adjustment of control factors’ levels via ANOVA analysis, and using the quality characteristic
Our major findings are: (1)The sex of consumers have significant effects on reverse product design but the remaining factors.(2)The mar- riage status of consumers
Hampton, G.,(1993).“Gap Analysis of College Student Satisfaction as a Measure of ProfessionService Quality,”Journal of Professional Service Marketing, Vol.9.,P.P.115-128.
