Identifying a Design Management Package to Support
Concurrent Design in Building Wafer Fabrication Facilities
Ren-Jye Dzeng
1Abstract: Concurrent design is commonly used in building a semiconductor wafer fabrication facilities to shorten projects. Current practice in managing a design schedule involves preset milestones that represent percentages of completion. Such a simple control scheme does not provide sufficient information to support concurrent design. This study presents an analytical model that applies a cluster identification algorithm to separate the work of designing a multisystem project into management packages that support concurrent design. Tasks within a package have strong informational dependency relationships on each other, and are not suited for concurrent design. Tasks of different packages have weak dependency relationships on each other, and are suited for concurrent design. Tendering design work based on these packages may reduce the number of design interfaces between participating design firms. Possible application of the model includes the management of design schedule, design contract tendering, and design information flow.
DOI: 10.1061/共ASCE兲0733-9364共2006兲132:6共606兲
CE Database subject headings: Construction management; Interfaces; Algorithms; Design.
Introduction
Accelerating a product’s time to market offers several advantages to manufacturers in the highly competitive semiconductor wafer industry, including reduced time to recover the investment, and increased profit. According to the SIA technology roadmap共SIA 2003兲, for high-demand products, volume production typically continues to ramp to semiconductor wafer fabrication facilities 共FABs兲 design capacity within 12 months. Minimizing a facility’s ramp-up time requires accelerating its design, construction, and startup. When a new wafer FAB is required, typically driven by capacity need or technological innovation to reduce production costs, such as during the inevitable transition to 300 mm wafers using 130 nm processing technology at the beginning of the new millennium 共Jansen 2000兲, delivering the FAB according to an aggressive schedule becomes critical to the success of the invest-ment. Chasey and Merchant 共2000兲 also identified project deliv-ery methods associated with a compressed schedule as a key issue of research for the construction of a 300 mm FAB.
Concurrent engineering has been adopted widely to develop a new product by integrating activities and data of multiple func-tional departments; it has proved to be effective in reducing product development time共Turtle 1994兲. Several methods of con-current design are available for developing new products. Quality Function Deployment 共QFD兲 共Akao 1990兲 identifies a product’s customers, and quantitatively measures their needs and
weight-ings of these needs before setting the product design parameters accordingly. QFD can reduce the number of required engineering changes and design uncertainty, and ensure that the product meets the customers’ needs.
Design for assembly共DFA兲 共Boothroyd and Dewhurst 1991兲 is a structured analysis technique that gives design teams the infor-mation they need to reduce product costs by reducing the number of parts, simplifying parts handling, and improving product as-sembly by carrying out analyses on a graphical chart. Following DFA analysis, manufacturing analysis 共MA兲 共Baudin 1990兲 may be applied to optimize the manufacturing process of each indi-vidual component by selecting the most cost-effective process and material at an early design stage. Such cost comparison during the concept design stage promotes cost-effective component design. Failure mode and effect analysis共FMEA兲 共Gordon and Isenhour 1990兲 is a bottom-up process for analyzing potential reliability problems early in the development cycle when such issues can be relatively easily overcome, thereby enhancing the reliability of the design.
QFD, DFA, MA, and FMEA are all concerned with improving the integration and communication of information between the stages of product development. None of these methods provides a systematic approach to breaking down a product into systems. The lack of such an approach may not represent a problem in the development of a product in which the interfaces among compo-nents can be clearly and quantitatively specified. However, it is a problem for designing and constructing a wafer FAB.
A wafer FAB is a complex fabrication plant that consists of various systems, including the architecture, the structure, the me-chanics, and the clean room. These systems are designed not only by multiple functional departments within a single engineering firm, but also, very often, by multiple engineering firms. Some systems共e.g., the structure兲 may be delivered by the design-bid-build approach, and others共e.g., the clean room兲 may be deliv-ered by the design-build approach. Properly breaking down the FAB into systems and identifying the interfaces between these systems helps the owner to manage and tender the design work by reducing the number of interorganizational interfaces.
1
Professor, Dept. of Civil Engineering, National Chiao-Tung Univ., 1001 Ta-Hsieu Rd., Hsinchu, Taiwan 30050, Republic of China. E-mail: [email protected]
Note. Discussion open until November 1, 2006. Separate discussions must be submitted for individual papers. To extend the closing date by one month, a written request must be filed with the ASCE Managing Editor. The manuscript for this paper was submitted for review and pos-sible publication on June 3, 2003; approved on June 22, 2005. This paper is part of the Journal of Construction Engineering and Management, Vol. 132, No. 6, June 1, 2006. ©ASCE, ISSN 0733-9364/2006/6-606– 614/$25.00.
Steward 共1981兲 used a matrix to represent dependency rela-tionships or interfaces between design activities, and developed design structure matrix analysis, which also was referred to as dependency structure matrix 共DSM兲. DSM subsequently devel-oped broader applications in other areas such as organizational structuring based on team interfaces 共Browning 1998兲 and se-quencing the determination of design parameters with minimized iteration共Black et al. 1990; Rask and Sunnersjö 1998兲.
Peña-Mora and Li共2001兲 applied DSM in their proposed plan-ning methodology for a design/build fast-track construction project, an integration method combining the concepts of axiom-atic design, concurrent engineering, graphical evaluation and re-view technique 共GERT兲, and system dynamics. Construction alternatives were evaluated by identifying coupled dependency among activities using DSM, and were selected according to the axiomatic design concept共Suh 1990, 1995兲. The schedule of the chosen alternative was compressed to achieve the concurrent en-gineering goal by overlapping certain activities based on their product rates, production reliability of upstream activity, and sen-sitivity to error of downstream activity.
Browning 共2001兲 also reviewed four types of DSMs being applied in three types of systems, including designing product architecture, process structure, and organization structure. Component-based DSM models system architecture according to components and their interrelationships. Team-based DSM mod-els organization structures based on human interactions. Activity-based DSM models processes and activity networks Activity-based on activities and their information flow and other dependencies. Parameter-based DSM models low-level relationships between design decisions and parameters.
Unlike most building projects where the architect coordinates specialty engineering/design firms, many FAB owners coordinate specialty design firms themselves because they, as manufacturers, have better knowledge about facility systems. While activity-based DSM improves design efficiency by minimizing design process iterations, a FAB owner may still encounter the challenge of how to tender design work so that more design contracts can proceed concurrently with minimal increase in management load. While the activity-based DSM minimizes the iteration of design activities, this work concentrates on the predesign phase with a higher-level view from the perspective of project owner.
Model for Concurrent Design Planning
The proposed analytical model consists of a four-step process for preplanning concurrent design, including system breakdown, sys-tem interface identification, management package identification, and concurrent design planning. The first step is to break down the design project into systems, based on a document review or an expert interview. The document review approach is suitable for designing a familiar facility for which a previous breakdown of the structure is available. For example, the civil/structure/ architecture 共CSA兲 design may include plans, elevations, land-scape, interior, and the specifications of other subsystems共e.g., of a clean room of class 100兲. When a designer is uncertain about the breakdown, interviews with experts, such as experienced project managers or system planners, may be necessary.
The second step is to identify the design interfaces among the systems. These design interfaces determine the sequential depen-dency among design tasks. Experts, such as experienced project managers or system planners, are helpful in this step. The depen-dencies among design tasks may be represented by a matrix
whose columns represent predecessors and whose rows represent successors. The matrix clearly identifies sequential relationships among the design tasks.
The third step is to separate the systems into independent groups. Fuzzy clustering analysis共FCA兲 共Hoppner 1999兲 and the cluster identification algorithm 共CIA兲 共Kusiak and Chow 1987兲 constitute two methods for completing this task. Cluster analysis involves grouping objects into homogenous groups, based on some of their features. It has been applied in a wide range of areas, including biology, data reorganization, medicine, pattern recognition, groupings parts of automated systems, production flow analysis, race mixture studies, task selection, control engi-neering, and expert systems共Kusiak and Chow 1987兲.
FCA is a method for partitioning a data set into clusters or classes, such that similar data are assigned to a single cluster, whereas dissimilar data are assigned to different clusters. The fuzzy approach is suitable for clusters among which no sharp boundaries exist. Fuzzy clustering uses degrees of membership between zero and one, rather than crisp assignments of data to clusters. The method involves three steps—establishing a fuzzy similarity measurement scheme and measuring the data, calculat-ing the similarity among the data, and clustercalculat-ing the data based on their similarity. The dependencies among the design tasks are often ambiguous. However, FCA provides no obvious way to rep-resent the sequential relationships among data.
The proposed model uses the CIA. The CIA, originally devel-oped by Kusiak and Chow 共1987兲, is based on a binary object-feature incidence matrix, whose columns represent objects and rows represent features. The algorithm finds mutually separable clusters, in each of which objects share the same features. Unlike the FCA, with a little adaptation, the CIA can be used to process the dependency relationships among data.
In the third step, the CIA helps to group dependent systems into management packages. Systems that belong to the same package cannot be designed concurrently. Conversely, systems that belong to different packages can be designed concurrently. CIA will be detailed in a later section.
The final step is to represent the management packages in a network schedule. The schedule may be represented using the precedence diagramming method or probabilistically using pro-gramming evaluation and review technique共PERT兲 共Ahuja et al. 1994兲. When simulation analysis is desired, GERT may be used to model alternative branches of activity looping in the schedule as illustrated by Peña-Mora and Li共2001兲 in their reservoir excava-tion example.
Another simulation alternative is Petri Nets, which is a formal and graphical language that is suitable for modeling systems with concurrency 共Reisig 1992兲. Petri Nets has been under develop-ment共Esparza and Lakos 2002兲 since the beginning of the 1960s, when Petri first defined the language. An effort to create an inter-national standard for high-level Petri Nets is also under way under the so-called 7.19.3共Petri net Techniques兲 project, a sub-project of 7.19共Diagrams for Software Engineering兲, by the stan-dards group called ISO/IEC JTC1/SC7/WG11 共ISO/IEC JTC1/ SC7 2004兲. Several Petri-net-based software applications, such as ALPHA/Sim 共ALPHATECH 1999兲, are available to analyze the concurrency and resolve resource conflicts among the activities in the network. This study uses Petri nets to represent the design plan because they are widely adopted in concurrent engineering and a broad selection of commercial software is available. Read-ers may refer to Reisig共1992兲 for the fundamentals of Petri nets. The following conceptual example illustrates each step in detail.
System Breakdown
Assume that a design project is divided into seven systems 共S1,
S2, S3, S4, S5, S6, and S7兲, based on a review of past documents
and interviews with experts.
Interface Identification
Assume that the interfaces of the systems are identified and rep-resented by a binary successor-predecessor matrix, matrix 共1兲. Columns represent successors and rows represent predecessors. A cell with a value of one specifies that the design of the corre-sponding successor depends on the design of the correcorre-sponding predecessor. A cell without a value indicates that the correspond-ing successor does not depend on the predecessor. For example, matrix共1兲 states that S1should be designed before S2
A = S1 S2 S3 S4 S5 S6 S7 Dp
冢
S1 S2 S3 S4 S5 S6 S7 1 1 1 1 1 1 1 1 1 1 1 1 1 1 1 1 3 2 2 2 3 2冣
Ds 7 1 2 1 2 1 1 共1兲Management Package Identification
After the interfaces among the systems have been identified, the CIA must be used to divide the systems into groups, such that no interfaces exist between the groups and the groups can be per-formed concurrently. Systems within a single group must be performed sequentially. Such groups are termed management packages because they can be used as a basis for tendering and managing design work.
The CIA can help to explore a diagonal structure of the matrix, and thereby decompose the matrix into mutually separable sub-matrices. Adapting the CIA originally proposed by Kusiak and Chow共1987兲, the object–feature matrix was herein changed into an object–object共i.e., successor–predecessor兲 matrix, because this study is concerned with grouping objects based not on similarities among features but rather on whether the objects exhibit any dependency.
Additionally, finding a separable cluster that includes a system coupled with most of the other systems may not be always pos-sible. Considering such a system when applying the algorithm may yield fewer clusters than would have been obtained were system to have not been considered initially. Some users may wish to remove any such overdependent system before perform-ing the matrix analysis. Therefore, the followperform-ing terms are defined in this research.
The cluster dependency threshold共T兲 is determined by the user to control the cluster size. The dependency sum 共D兲 of a system is the number of other systems that have dependent rela-tionships with the system. Ds of a system is the number of its
succeeding systems, and can be determined by summing the num-bers in its row in the successor-predecessor matrix. Dp of a
system is the number of its preceding systems, and can be deter-mined by summing the numbers of its column in the matrix. D is
the maximum of Ds and Dp. Matrix共1兲 displays Dsand Dp for
each of the systems.
The following two sections first describe the proposed version of the CIA algorithm, and then uses the previously described seven systems to demonstrate the algorithm.
Cluster Identification Algorithm
1. Determine the cluster dependency threshold T.
2. Remove from matrix A the systems whose dependency sum D exceeds T, and store these systems in matrix A*.
3. Set the iteration number, k = 1.
4. Select any row i of the matrix A共k兲共where A共k兲denotes matrix A at iteration k兲 and draw a horizontal line hithrough it. 5. For each entry 1 on the intersection with the horizontal line
hi, draw a vertical linej.
6. For each entry crossed by the vertical line j, draw a
hori-zontal line hi.
7. Repeat steps 5 and 6 until no singly crossed entries 1 remain. 8. Transform matrix A共k兲into A共k+1兲by removing all the twice-crossed entries 1. Add all the twice-twice-crossed entries 1 to A*.
9. If matrix A共k+1兲= 0 共i.e., all its elements equal zero兲, stop; otherwise, set k = k + 1 and go to step 4. Iterations from step 4 to 9 are called the matrix analysis.
Each system whose D exceeds T is removed in step 1, and be-comes a separated cluster, itself, being uninvolved in the follow-ing matrix analysis. A T that is too high may result in too few clusters, such that each cluster is too large共comprising too many systems兲. Conversely, a T that is too low may result in too many clusters, such that each cluster is too small. Both situations con-tradict the purpose of using the CIA. The appropriate T depends on the user and the configuration of the matrix. Half of the total number of systems is a recommended starting value for T.
Illustrative Example
Suppose that 3.5 共half of seven systems兲 is used as the cluster dependency threshold. The following steps show how the CIA processes the example with seven systems关matrix 共1兲兴.
1. Set T = 3.5.
2. S1is the only system whose D 共Ds兲 exceeds 3.5. Thus,
re-move S1from A, and store it in A*. A*now comprises兵S 1其.
3. Set the iteration number k = 1.
4–7. Select row S2 of matrix A共1兲; draw horizontal line h2
through it, and then draw a vertical line2. Entry 1 at cell
共S2, S3兲 is crossed only once. Thus, draw h3and then3
A共1兲= S2 S3 S4 S5 S6 S7
冢
S2 S3 S4 S5 S6 S7 1 1 1 1 1 1 1 1 v2 v3冣
h2 h3 共2兲8–9. Removing 兵S2, S3其 from matrix A共1兲 yields matrix A共2兲. A*
now comprises兵S1其 and 兵S2, S3其.
4–7. Select row S4 of matrix A共2兲; draw a horizontal line h4
through it, and then draw vertical line4
A共2兲= S4 S5 S6 S7
冢
S4 S5 S6 S7 1 1 1 1 1 v4冣
h4 共3兲8–9. Removing兵S4其 from matrix A共2兲yields matrix A共3兲. A*now
comprises兵S1其, 兵S2, S3其 and 兵S4其.
4–7. Select row S5 of matrix A共3兲, draw horizontal line h5 through it, and then draw vertical line5and6. Entry 1 at
cell共S6, S6兲 is crossed only once. Thus, draw h6
A共3兲= S5 S6 S7
冢
S5 S6 S7 1 1 1 1 v5 v6冣
h5 h6 共4兲8–9. Remove 兵S5, S6其 from matrix A共3兲. A*now comprises兵S1其,
兵S2, S3其, 兵S4其, and 兵S5, S6其.
4–7. Select row S7 of matrix A共4兲; draw horizontal line h7
through it, and then draw vertical line7
A共4兲= S7
冢
S71 v7
冣
h7 共5兲
8–9. Remove 兵S7其 from matrix A共4兲. A* now comprises 兵S 1其,
兵S2, S3其, 兵S4其, 兵S5, S6其, and 兵S7其. Since A共4兲= 0, stop.
Fig. 1 presents the final clustering result. The system can be de-composed into five clusters, represented by blocks. Except for cluster S1, all clusters are mutually independent. These clusters
are management packages for concurrent design. Concurrent Design Preplanning
Fig. 2 is a Petri net that shows the concurrent management
pack-ages 共represented by dotted blocks兲, based on the decomposed clusters derived in the preceding section. To transform clusters into sequenced activities, activities of different clusters are first separated in different rows. Second, subnetworks showing prece-dence relationships between activities of each cluster can be re-constructed. Finally, redundant precedence relationships may be removed, and subnetworks integrated as a single network as shown in Fig. 2.
Dealing with Dependency Relationships
The previously described matrix contains only binary values. It suffices for designing a manufactured product with distinct parts 共e.g., screws and bearings兲, the designs of which either are inde-pendent of, or precede each other with a finish–start relationship. In the design of a wafer FAB, dependencies among systems are more complex, and cannot be neglected because they significantly affect the total design duration. For example, the design of a clean room affects the design of parts of the CSA system共cellular beam and architecture兲, but not of all of it. Restated, their dependency cannot be characterized as a finish–start relationship.
When a dependency is not binary, it may be described or mea-sured in several ways, such as the percentage overlap of the ac-tivities, the network logic共e.g., start–start relationship兲 as defined in the critical path method 共CPM兲, the amount of dependent in-formation 共e.g., the number of drawings or documents兲, or the required number of coordination meetings. In any case, the de-pendency must be quantified and dichotomized so the matrix analysis can be performed.
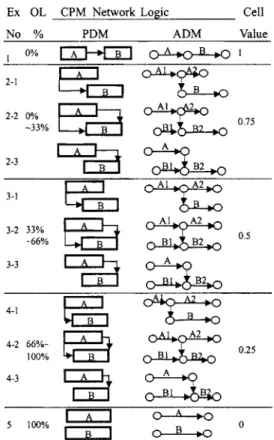
Fig. 3 presents examples of measuring dependency. From top
Fig. 1. Clustering result of illustrative example
Fig. 2. Example of concurrent design plan
Fig. 3. Measurement of dependency relationships between design
activities
row to the bottom, examples 1, 2-1, 2-2, 2-3, 3-1, 3-2, 3-3, 4-1, 4-2, 4-3, and 5 show increasing degree of overlapping between two activities. Column “OL%” measures the dependency as a percentage of overlap of activities. Columns “PDM” and “ADM” show the corresponding time-scaled network schedule, based on the precedence diagramming method 共PDM兲 and the arrow dia-gramming method共ADM兲 共Popescu and Charoenngam 1995兲, re-spectively. Although PDM is more commonly used in today’s scheduling software, such as Primavera Project Planner 共Primav-era 1999兲, ADM is also presented because it clarifies which part of an activity precedes which part of a succeeding activity. In addition to the proposed five-point scale of dependency strengths, the three- 共Smith and Eppinger 1993兲 共Austin et al. 1996兲 and seven-point scales共Rogers and Bloebaum 1994兲 can also be used. If an activity can start only when its preceding activity has been completed共Example 1兲, the two activities will not overlap; thus, their dependency is maximal, and the value in the corre-sponding cell of the matrix is one. If an activity can start only when a large fraction of the preceding activity has been per-formed共Example 2-1兲, then overlap of the activities can be con-sidered to be small; thus, their dependency is strong, and the value in the corresponding cell is 0.75. If an activity can start after a small fraction of its preceding activity has been performed 共Example 4-1兲, then the overlap can be considered to be large; thus, the dependency is weak, and the value in the corresponding cell is 0.25. If the activities are not related共Example 5兲, then the value in the corresponding cell is zero. The value in a cell repre-sents the strength of a dependency between the corresponding predecessor and successor.
Overlapping activities may also have other types of relation-ships as described by Examples 2-2, 2-3, 3-2, 3-3, 4-2, and 4-3. When activities have a start–start, both a start–start and a finish– finish, or just a finish–finish relationship, they may overlap. The percentage of the overlap depends on the lead time of the link, determined from the duration of the early part of the preceding activity 共e.g., Activity A1 in Column “ADM”兲 and/or the later part of the succeeding activity共e.g., Activity B2兲.
The matrix analysis requires that the cell values are binary, so the user must determine a threshold共between 0 and 1兲 to differ-entiate strong relationships from weak ones. Values above the
threshold will be replaced by one, and the others will be replaced by zero. This process is referred to as deoxidization.
Case Study
The case presented here is a 300 mm 共12 in.兲 semiconductor wafer FAB in the Scientific Research Park, Hsinchu, Taiwan. The total construction cost is US$160 million, including the cost of the FAB’s structure, mechanics, electrical system, and clean room, but excluding that of the production equipment, which rep-resents alone takes approximately 90% of the total investment in a FAB. The cost of the CSA is US$64 million. The total duration of the project is 13 months, including seven months of design. The project is implemented by the fast-track approach to meet the client’s compressed schedule; i.e., the construction starts before the design is completely finished.
The design is contracted out to several specialty engineering firms. All firms have contracts directly with the client. The client is the designated, single window through which design informa-tion is exchanged among the firms. The client uses “design start,” and 30, 60, 80, and 100% of design completion as milestones to control the schedule. All firms must submit their designs to the client for approval or modification. The client’s project manage-ment team is responsible for coordinating all the design tasks of the various firms. The management team, led by a chief engineer-ing consultant and consistengineer-ing mainly of production engineers, has great expertise in designing and operating production lines, but only limited experience of managing a construction project. Con-sequently, the team may frequently pass information to incorrect parties or fail to pass information that must be passed on, because the team is not familiar with each design area.
This case will be used to illustrate the application of the pro-posed model.
System Breakdown
The FAB is broken down into nine systems according to the ten-dering structure of the design tasks, including CSA, mechanical/ electrical/plumbing 共MEP兲, clean room 共CR兲, and special
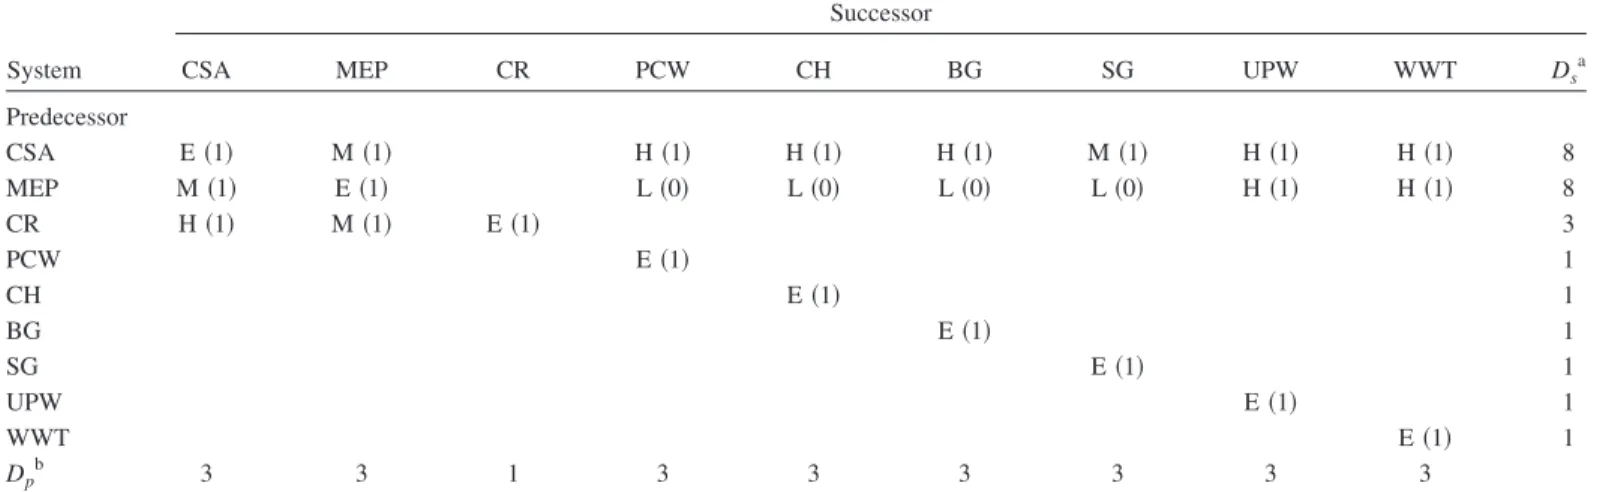
sys-Table 1. Measurement of Dependency Relationships between Design Activities
System
Successor
CSA MEP CR PCW CH BG SG UPW WWT Ds
a Predecessor CSA E共1兲 M共1兲 H共1兲 H共1兲 H共1兲 M共1兲 H共1兲 H共1兲 8 MEP M共1兲 E共1兲 L共0兲 L共0兲 L共0兲 L共0兲 H共1兲 H共1兲 8 CR H共1兲 M共1兲 E共1兲 3 PCW E共1兲 1 CH E共1兲 1 BG E共1兲 1 SG E共1兲 1 UPW E共1兲 1 WWT E共1兲 1 Dp b 3 3 1 3 3 3 3 3 3
Note: Strength of dependency: E共extremely兲, M 共mostly兲, H 共half兲, L 共little兲, N 共not兲 dependent; Threshold value: M 共0.75兲
CSA共civil/structure/architecture兲; MEP 共mechanical/electrical/plumbing兲; CR 共clean room兲; PCW 共process cooling water兲; CH 共chemical handling兲; BG共bulk gas兲; SG 共special gas兲; UPW 共ultra pure water兲; WWT 共waste water treatment兲
a
Ds= the number of the activity’s succeeding systems.
b
Dp= the number of the activity’s preceding systems.
tems. The special systems include process cooling water共PCW兲, ultrapure water共UPW兲, waste water treatment 共WWT兲, bulk gas 共BG兲, special gas 共SG兲, and chemical handling 共CH兲 systems. The interfaces among the design firms can be identified and managed by using the design breakdown structure based on the design contracts.
Interface Identification
Two managers from the chief engineering firm in the project help to identify the dependencies among the nine systems, as summa-rized in Table 1. The dependency is categosumma-rized into five degrees-extremely 共E兲, mostly 共M兲, half 共H兲, little 共L兲, and not 共N兲 dependent. For example, CSA is half dependent on CR because the design of CR affects about half of the design work of CSA. For example, the required consideration of microvibrations for CR affects CSA’s structural and architectural layout subsystems. MEP is mostly dependent on CR because the design of CR affects more than half of the design work of MEP. For example, the design of CR affects MEP’s ice water, product gas, general elec-tricity, HVAC, and fire prevention subsystems.
The binary value in each cell is represented by the numbers in parentheses in the table, using “half dependent” as the threshold. Column “Ds” shows the sum of dependencies of successors for
each system. The bottom row “Dp” shows the sum of
dependen-cies of predecessors for each system in the first row. According to the table, CSA and MEP have the highest dependency sums共8兲.
Management Package Identification
If the cluster dependency threshold T is set to five 共half of the nine systems兲, then CSA and MEP are removed before the matrix analysis is performed. The blocks in Table 1 show the clustering results of the CIA. Fig. 4 represents the concurrent design plan. Notably, CSA depends on MEP and MEP depends on CSA. The cyclical nature of the dependency between CSA and MEP sug-gests that the two systems should be tendered in a single package, and that they may have to be broken down further.
The further breakdown of a system with a high dependency sum may separate its subsystems with high dependency sums from those with low dependency sums. Such separation isolates the part of the system that is not appropriate for concurrent de-sign, so that the remaining subsystems may be designed concur-rently. For example, CSA can be further broken down into four subsystems, including CSA1 共architectural structure兲, CSA2 共ar-chitectural layout兲, CSA3共architectural exterior wall兲, and CSA4
共architectural landscape兲. MEP can be further broken down into nine subsystems, including MEP1 共chiller equipment兲, MEP2
共process exhaust system, including general exhaust, acid exhaust, and volatile organic compounds exhaust subsystems兲, MEP3
共electrical equipment兲, MEP4 共high-voltage equipment兲, MEP5
共heating ventilation and air conditioning兲, MEP6 共fire protection
system兲, MEP7 共grounding system兲, MEP8共closed circuit
televi-sion video equipment兲, and MEP9共plumbing system兲.
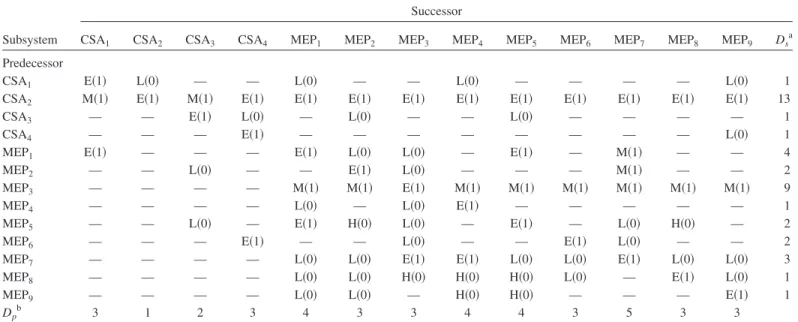
Table 2 displays the strength of dependency relationships among the decomposed subsystems, as assessed by experts, in five degrees as in Table 1. Since from the client’s management viewpoint, only significant dependencies need to be captured
Table 2. Professional’s Assessment of Dependency among CSA and MEP Systems
Subsystem
Successor
CSA1 CSA2 CSA3 CSA4 MEP1 MEP2 MEP3 MEP4 MEP5 MEP6 MEP7 MEP8 MEP9 Ds
a Predecessor CSA1 E共1兲 L共0兲 — — L共0兲 — — L共0兲 — — — — L共0兲 1 CSA2 M共1兲 E共1兲 M共1兲 E共1兲 E共1兲 E共1兲 E共1兲 E共1兲 E共1兲 E共1兲 E共1兲 E共1兲 E共1兲 13 CSA3 — — E共1兲 L共0兲 — L共0兲 — — L共0兲 — — — — 1 CSA4 — — — E共1兲 — — — — — — — — L共0兲 1 MEP1 E共1兲 — — — E共1兲 L共0兲 L共0兲 — E共1兲 — M共1兲 — — 4 MEP2 — — L共0兲 — — E共1兲 L共0兲 — — — M共1兲 — — 2 MEP3 — — — — M共1兲 M共1兲 E共1兲 M共1兲 M共1兲 M共1兲 M共1兲 M共1兲 M共1兲 9 MEP4 — — — — L共0兲 — L共0兲 E共1兲 — — — — — 1 MEP5 — — L共0兲 — E共1兲 H共0兲 L共0兲 — E共1兲 — L共0兲 H共0兲 — 2 MEP6 — — — E共1兲 — — L共0兲 — — E共1兲 L共0兲 — — 2 MEP7 — — — — L共0兲 L共0兲 E共1兲 E共1兲 L共0兲 L共0兲 E共1兲 L共0兲 L共0兲 3 MEP8 — — — — L共0兲 L共0兲 H共0兲 H共0兲 H共0兲 L共0兲 — E共1兲 L共0兲 1 MEP9 — — — — L共0兲 L共0兲 — H共0兲 H共0兲 — — — E共1兲 1 Dp b 3 1 2 3 4 3 3 4 4 3 5 3 3
Note: Strength of dependency: E共extremely兲, M 共mostly兲, H 共half兲, L 共little兲, N 共not兲 dependent; Threshold value: M 共0.75兲 a
Ds= the number of the activity’s succeeding systems.
b
Dp= the number of the activity’s preceding systems.
Fig. 4. Initial concurrent design plan for case study
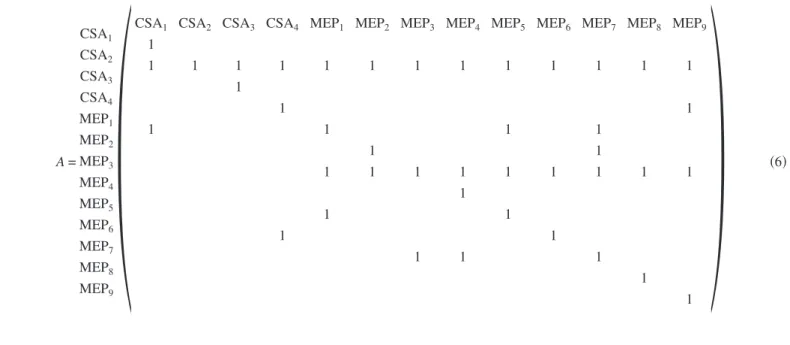
hence avoiding too many coupled subsystems during the matrix analysis, the threshold for deoxidization is set to M. Thus, depen-dencies identified as E or M will be transformed to 1 and those as H, L, or N will be transformed to 0. For example, although MEP3
is “little” dependent on MEP1 and MEP2 共e.g., the sizing of MEP3 depends on the sizing of MEP1 and MEP2兲, the depen-dency will be ignored in the matrix analysis. The deoxidized re-sult is presented by Matrix共6兲
A = CSA1 CSA2 CSA3 CSA4 MEP1 MEP2 MEP3 MEP4 MEP5 MEP6 MEP7 MEP8 MEP9
冢
CSA1 CSA2 CSA3 CSA4 MEP1 MEP2 MEP3 MEP4 MEP5 MEP6 MEP7 MEP8 MEP9
1 1 1 1 1 1 1 1 1 1 1 1 1 1 1 1 1 1 1 1 1 1 1 1 1 1 1 1 1 1 1 1 1 1 1 1 1 1 1 1 1 1
冣
共6兲The blocks in Fig. 5 show the clusters derived from the CIA. The decomposed clusters are共CSA2兲, 共MEP3兲, 共CSA1, MEP1, MEP2,
MEP4, MEP5, MEP7兲, 共CSA3兲, 共CSA4, MEP6兲, 共MEP8兲, 共MEP9兲. In Fig. 6, each dotted block represents a management package that is based on the decomposed clusters. These packages identify groups of tasks that can be performed concurrently, as well as those that cannot. Their dependency relationships among sequen-tial tasks are also identified. For example, suppose that different firms design CSA and MEP. The package共e.g., CSA1 and MEP1兲 that crosses more than one system should receive considerable management attention because it involves an interface between at least two organizations. The dependency between the two pack-ages within a single system indicates that work interfaces may only exist between different engineers, design teams, or divisions within an organization.
Based on Fig. 4, system CR precedes CSA and MEP, which precede the remaining systems. Matrix 共7兲 displays the depen-dency relationships between CR and each subsystem of CSA and MEP. Matrix 共8兲 displays the dependency relationships among each subsystem of CSA and MEP, and the other systems. For
example, the special consideration of the micro vibration associ-ated with CR governs the design of the box girders in CSA1. The
location of the platform for the CR equipment also governs the
Fig. 5. Clusters derived from cluster identification algorithm Fig. 6. Concurrent design plan of CSA’s and MEP’s subsystems
layout of CSA2. However, the design of PCW requires information on the loading capacity of the slabs and the layout of structural
elements and spaces; accordingly, PCW should precede CSA1and CSA2. The dependency relationships among each subsystem and all
systems are annotated by bold, dashed lines in Fig. 6. For example, both CSA2and MEP3precede PCW, CH, BG, SG, UPW, and WWT
A = CR
冉
CSA1 CSA2 CSA3 CSA4 MEP1 MEP2 MEP3 MEP4 MEP5 MEP6 MEP7 MEP8 MEP91 1 1 1 1 1 1
冊
共7兲 A = CSA1 CSA2 CSA3 CSA4 MEP1 MEP2 MEP3 MEP4 MEP5 MEP6 MEP7 MEP8 MEP9 PCW CH BG SG UPW WWT冢
1 1 1 1 1 1 1 1 1 1 1 1 1 1 1 1 1 1 1 1 1 1 1 1 1 1 1 1 1 1 1 1 1冣
共8兲Resource conflicts may also prevent two processes from running concurrently. The Petri-Net representation enables the plan to be sent to Petri-Net-based simulation tools to verify further the avail-ability of critical resources. For example, some enhanced version of Petri-Net tools 共Jensen 1992兲, 共Meta Software Corporation 1993兲 provide colored tokens to differentiate resources with different attributes and allow dynamic allocation of resources 共i.e., a resource may conditionally serve several activities when available兲.
Discussions
This research was conducted during the design–construction phase of a FAB. Although the analytical results presented above were not actually used to manage the design tasks, the participat-ing design engineers and the client’s representatives all appreci-ated the proposed analytical model and results. They proposed three directions in which the model could be applied; they are in managing design schedule, contract tenders, and information flow.
The concurrent design plan provides a project manager with a reference for estimating quickly the duration of the design phase, and developing a master schedule. For example, suppose that the design of each of the CR, PCW, CH, BG, SG, UPW, and WWT systems requires 30 days, and that the design of each of the CSA1, CSA2, CSA3, CSA4, MEP1, MEP2, MEP3, MEP4, MEP5, MEP6, MEP7, MEP8, and MEP9 subsystems requires 20 days. The longest path associated with the subsystems of CSA and MEP, including four activities, CSA2, CSA3, CSA4 and MEP9共see Fig. 5兲, has a duration of 80 days 共20⫻4兲. Inte-grating Figs. 4 and 6 yields a total design duration of 120 days 共20+80+20兲.
The project manager may also break down the project into tendering packages, based on the management packages identified in the concurrent design plan. The idea is to combine systems/
subsystems that involve the same type of work and have depen-dency relationships into a single tendering package. Thus, the work interfaces managed by the client in the concurrent design phase can be reduced. For example, MEP1 precedes PCW, and both systems are designed by design firms in the same specialty. Therefore, they can be contracted to a single firm. However, CSA1also precedes PCW, but they are designed by firms in
dif-ferent specialties. Even though they are combined into a single tendering package, these tasks will still be subcontracted out by the firm to which the contract is awarded and interfaces still exist between two firms. The difference between tendering the design of such two systems in two separated contracts or a single con-tract is that the burden of interface management has shifted from the client to the firm to which the pertinent contract has been awarded. The combination of such systems into a single package is not recommended. Nevertheless, the identified interface should still receive considerable attention from the management, regard-less of the approach taken.
The concurrent design plan may also support the management of the flow of design information, especially in a situation like that of the studied case, in which all design firms have direct contracts with a client that is unfamiliar with the design process. The arrows in the concurrent design plan indicate the information dependencies. The design activity at an arrow head requires in-formation from the activity at the opposite end of that arrow. Consequently, during the design phase, the client should forward pass the design information of an activity to the firm responsible for the activity’s successor when part of the design is completed. When a design change order is initiated for an activity, the client should backward pass the change information to the firm respon-sible for the activity’s predecessor to confirm the feasibility of the change. After the change has been made, the new design should be forward passed to the firm responsible for the activity’s suc-cessor to realize consequential impacts thereon.
Conclusions
This paper presents an analytical model that supports concurrent design planning. The model involves four steps-system break-down, system interface identification, management package iden-tification, and concurrent design preplanning. The model supports concurrent design planning by clearly identifying the dependen-cies among design tasks, and whenever possible, grouping the tasks into distinct management packages, among which is no in-terface, using the revised CIA. Tasks within a single management package exhibit strong information dependency relationships between each other, and thus are unsuited to be designed concur-rently. Tasks in different management packages have weak depen-dency relationships with each other, and thus can be designed concurrently to shorten the project.
This study also uses a semiconductor wafer FAB to demon-strate the feasibility of applying the proposed model. The
pating professionals proposed three directions in which the model can be applied, including the management of design schedule, design contract tendering, and design information flow.
Acknowledgments
The author would like to thank his colleague, Professor W. C. Wang, for his inspiration and input to this research. The following are also appreciated for their participation in our interviews and verification of the case demonstration: C. T. Huang, C. H. Wu, and L. S. Chen 共Vice Presidents兲; Y. P. Hung and W. M. Chen 共Directors兲; S. L. Chiang, C. K. Tang, and S. Y. Yu 共Section Managers兲 at J. J. Pan and Partners, Architects and Planners; and also W. C. Chang共Director兲, Y. J. Chen, W. C. Tsai, and S. C. Fang 共Engineers兲 at Powerchip Semiconductor Corporation. The writer’s graduate student, S. M. Hsieh, is also appreciated for his diligent efforts in coordinating and recording these activities.
References
Ahuja, H. N., Dozzi, S. P., and Abourizk, S. M.共1994兲. Project
manage-ment: Technique in planning and controlling construction projects,
Chaps. 7 and 15, Wiley, New York.
Akao, Y.共1990兲. Quality function deployment: Integrating customer
re-quirements into product design, Productivity Press, Cambridge, Mass.
ALPHATECH, Inc. 共1999兲. “New release—ALPHA/Sim for Windows NT: The essential tool for building high quality, complex models is here.” 具http://www.alphatech.com/secondary/techpro/alphasim/ alphasim.html典 共May 20, 2003兲.
Austin, S., Baldwin, A., and Newton, A.共1996兲. “A data flow model to plan and manage the building design process.” Mach. Learn., 7共1兲, 3–25.
Baudin, M.共1990兲. Manufacturing systems analysis with application to
production scheduling, Prentice-Hall, Englewood Cliffs, N.J.
Black, T. A., Fine, C. F., and Sachs, E. M.共1990兲. “A method for systems design using precedence relationships: An application to automotive brake systems.” Paper 3208–90, MIT Sloan School of Management, MIT, Cambridge, Mass.
Boothroyd, G., and Dewhurst, P.共1991兲. Product design for assembly, Boothroyd Dewhurst Inc., Wakefield, R.I.
Browning, T. R.共1998兲. “Integrative mechanisms for multiteam integra-tion: Findings from five case studies.” J. Syst. Eng., 1, 95–112. Browning, T. R.共2001兲. “Applying the design structure matrix to system
decomposition and integration problems: A review and new direc-tions.” IEEE Trans. Eng. Manage., 48共3兲, 292–306.
Chasey, A. D., and Merchant, S. 共2000兲. “Issues for construction of 300-mm Fab.” J. Constr. Eng. Manage., 126共6兲, 451–457.
Esparza, J., and Lakos, C., eds.共2002兲. “Application and theory of Petri nets 2002.” Proc., 23rd Int. Conf.: Application and Theory of Petri
Nets, ICATPN 2002, Adelaide, Australia, Springer, New York.
Gordon, F., and Isenhour, R.共1990兲. “Simultaneous engineering.”
Simul-taneous engineering integrating manufacturing and design, Society of
Manufacturing Engineering, Dearborn, Mich.
Hoppner, F. 共1999兲. Fuzzy cluster analysis: Methods for classification,
data analysis and image recognition, Wiley, New York.
ISO/IEC JTC1/SC7 共2004兲. “Official ISO/IEC JTC1/SC7 web site.” 具http://www.jtc1-sc7.org/典 共July 25, 2004兲.
Jansen, R.共2000兲. “The 300 mm FAB—A major paradigm shift.”
Semi-conductor FABTEC, IGC Publishers, London, 113–120.
Jensen, K.共1992兲. Coloured Petri nets. Basic concepts, analysis methods
and practical use, Vol. 1, Springer, Berlin.
Kusiak, A., and Chow, W. S.共1987兲. “An efficient cluster identification algorithm.” IEEE Trans. Syst. Man Cybern., SMC-17共4兲, 696–699. Meta Software Corporation共1993兲. Design/CPN, Meta Software
Corpo-ration, Cambridge, Mass.
Peña-Mora, F., and Li, M.共2001兲. “Dynamic planning and control meth-odology for design/build fast-track construction projects.” J. Constr.
Eng. Manage., 127共1兲, 1–17.
Popescu, C. M., and Charoenngam, C.共1995兲. Project planning,
sched-uling, and control in construction: An encyclopedia of terms and ap-plications, Wiley, New York.
Primavera Systems, Inc.共1999兲. Primavera Project Planner 3.0 reference
manual, Bala Cynwyd, Pa.
Rask, I., and Sunnersjö, S. 共1998兲. “Design structure matrices for the planning of rule-based engineering systems.” Proc., Europe Conf. on
Integration in Manufacturing, Chalmers Univ. of Technology,
Göte-borg, Sweden, 158–165.
Reisig, W.共1992兲. A primer in Petri net design, Springer, Berlin. Rogers, J. L., and Bloebaum, C. L.共1994兲. “Ordering design tasks based
on coupling strengths.” Paper 94–4326, American Institute of Aero-nautics and AstroAero-nautics, Reston, Va.
Semiconductor Industry Association共SIA兲. 共2003兲. National technology
roadmap for semiconductor technology needs, SEMATECH, Inc.,
Austin, Tex.
Smith, R. P., and Eppinger, S. D.共1993兲. “Characteristics and models of iteration in engineering design.” Proc., Int. Conf. on Engineering
De-sign共ICED’93兲, The Hague, The Netherlands, 564–571.
Steward, D. V.共1981兲. “The design structure system: A method for man-aging the design of complex systems.” IEEE Trans. Eng. Manage.,
28, 71–74.
Suh, N. P.共1990兲. The principle of design, Oxford University Press, New York.
Suh, N. P.共1995兲. “Axiomatic design of mechanical systems.” Trans. Am.
Soc. Civ. Eng., 117, 2–10.
Turtle, Q. 共1994兲. Implementing concurrent project management, Prentice–Hall, Englewood Cliffs, N.J.