地理研究 第 71 期 民國 108 年 11 月
Journal of Geographical Research No.71, November 2019 DOI: 10.6234/JGR.201911_(71).0004
深度學習影像分類應用於福衛二號衛星影像之崩塌地自動判釋
An Application of Deep Learning Image Classification on Landslide
Automated Detection with FORMOSAT-2 Satellite Imagery
蔡詠名
a張國楨
b陳俊愷
c周學政
dYung-Ming Tsai Kuo-Chen Chang Chun-Kai Chen Hseuh-Cheng Chou
摘 要
臺灣易遭受各種自然災害侵襲,如地震或颱風。山區容易發生崩塌,造成生命財產安全的損害。 使用遙測技術監測崩塌地的發生是政府機關的年度任務。然而,這個任務暨需求大量人力,且花費許 多時間。為了解決這個問題,本研究提出應用深度學習進行全自動化衛星影像崩塌地分類的方法,以 獲得更準確並可靠的分類結果。 所採用之分類模型是基於U-Net 卷積類神經網路,以 CNTK 深度學習工具進行開發。此模型以一 對衛星影像與地真資料做為模型輸入,輸出預測的分類結果。使用多對福衛二號影像與地真資料進行 模型訓練。地真資料共分五類:植被、河床、崩塌地、水體與其他地物類別。為了更準確分辨崩塌地 與其他易混淆類別如河床與農地,衛星影像中加入坡度圖層做為分類資訊。 本研究所產出的分類模型相當可靠,能夠清楚從衛星影像上判釋崩塌地。模型本身可以重複使用, 而且過程完全自動化,並可改善崩塌地監測與繪製崩塌地目錄的工作流程,對環境災害監測與災害潛 勢繪製將有所助益。 關鍵詞:崩塌地、影像分類、深度學習、衛星影像、U-netAbstract
Taiwan is subject to severe natural hazards like earthquakes and typhoons, which often cause landslides
a 國立臺灣師範大學地理學系碩士研究生
Master student, Department of Geography, National Taiwan Normal University
b 國立臺灣師範大學地理學系教授,通訊作者(email: [email protected])
Professor, Department of Geography, National Taiwan Normal University. Corresponding author.
c 中興工程顧問社防災科技研究中心正研究員
Researcher, Disaster Prevention Technology Center, Sinotech Engineering Consultants, Inc.
d 國立臺灣師範大學地理學系副教授
in mountainous area, destroying crops and properties or even lives. Monitoring the occurrence of landslides using remote sensing imagery is an annual task for government institutions. However, the task had been extremely labor-intensive and time consuming. In order to solve the problem, this study proposes a deep learning technique for automatic landslide classification from satellite imagery in order to get more accurate and robust classification results.
The classification model is based on the U-Net convolutional neural network. The model takes pairs of satellite imagery and ground truth label as the input and produces predicted classified labels as the output. The model is trained on pairs of FORMOSAT-2 imagery and ground truth labels. The ground truth is classified into 5 classes: vegetation, riverbed, landslides, water and miscellaneous. To best separate landslides from other unclear land cover like riverbed and farmlands, slope degree is added to satellite imagery to distinguish and recognize information for classification.
The study’s results produce a robust classification model that is able to distinguish landslides from the satellite imagery with an automatic workflow. We expect that the model will be useful for landslides monitoring and inventory mapping, which are elementary tasks for hazard mitigation and susceptibility mapping.
Keywords: landslide, image classification, deep learning, satellite imagery, U-net
Introduction
Taiwan is a mountainous environment, with approximately 70 percent of the island being mountains. Given the limited flat areas, settlements and agricultural activities often occur in mountainous areas. The residents are exposed to the risk of hazardous landslides due to the frequency of earthquakes, typhoons and strong rainfalls. Landslide events often claim serious casualty and property loss. To monitor the landslide events for the sake of hazard mitigation, landslides inventory mapping is an annual routine for the authority.
Remote sensing techniques have been used widely for the purpose of landslide monitoring and inventory mapping. The task of landslide mapping can be done successfully with remote sensing data sources like aerial photographs and Very High Resolution (VHR) satellite imagery (Van Western, 2000). The mapping process can be done with manual interpretation. However, manual interpretation is both labor intensive and time consuming. Several techniques have been proposed for automatic or semi-automatic landslides image detection or classification. Research suggests that change detection analysis with optical satellite imagery can identify land cover changes caused by landslide events (Hervás et al., 2003). Change detection analysis requires time sequential imagery that are geometrically rectified and radiometrically normalized, so multiple images can be compared pixel by pixel. Study also shows the integration of DTM data can help the extraction of landslides (Cheng et al., 2004).
Other studies have adopted image classification techniques to tackle the problems. Borghuis et al. (2007) compared the performance of automated image classification using maximum likelihood classifier with manual mapping. The results of unsupervised classifier using SPOT-5 imagery and slope filter shows a
concordance of 63% with manual mapping results. The classifier shows less omission on small landslides than manual mapping, but larger commission to the classification of farmlands, riverbeds and road. A common approach currently for image classification is object-based image analysis (OBIA). Researchers have grown strong interest in OBIA, and the paradigm of pixel-based analysis has shifted to object-based analysis (Blaschke, 2010). OBIA solves the “salt and pepper effect” of pixel-based classification. Furthermore, OBIA can extract more information from the imagery, providing extra spectrum statistical information like mean value or standard deviation, along with other object features like size, shape, texture or location. Object-based image classification usually involves with two processes, image segmentation and object classification. Aksoy and Ercanoglu (2012) uses object-based image analysis for landslide identification. Multiresolution segmentation is used as the image segmentation algorithm. Multiresolution segmentation (Baätz and Schäpe, 2000) is a bottom-up approach for segmentation that groups homogeneous pixels into a same object, and hence producing a more meaningful object segmentation. This algorithm is used in object-based image classification software like eCognition. For object classification, fuzzy classification is used in this study. Aside from spectral information, other variables like NDVI, slope, plan curvature, brightness, shape, texture and neighboring are also used for classification. The results are similar to the one mapped by experts. Classifiers like random forest are alternative options for classification (Stumpf and Kerle, 2011).
OBIA have been used extensively in the task of image classification, yet there are some drawbacks for it. First, in supervised object-based classification, the selection of training sites is very crucial, and have direct impact on the results. Training selection will require human operations, so the process cannot be fully automized. The involvement of human operation also adds uncertainty to the model, and the results of classification will be inconsistent when operated by different people. To produce consistent results, we will need a classifier that can be reused. Currently, neural network with multiple hidden layers structures, also known as deep learning, is the trend. Deep learning has been used widely on the task of classification for multiple applications. Most deep learning approaches for image object detection or classification are based on convolutional neural network (CNN). CNN can perform different tasks of image recognition. Image classification, like ImageNet (Krizhevsky et al., 2012), classifies images into different categories. Object detection finds the location of objects in the image and produce the bounding box of the objects. Common object detection algorithms are Fast R-CNN (Girshick, 2015), Faster R-CNN (Ren et al., 2015) and YOLO. (Redmon et al., 2016) Semantic segmentation classifies each pixel of the image into different classes. U-net is a semantic segmentation deep learning framework, which is originally designed for biomedical image segmentation (Ronneberger et al., 2015). U-net is also adopted widely in satellite imagery analysis for different purposes like land cover mapping (Iglovikov et al., 2017; Rakhlin et al., 2018). Zhang, Liu and Wang (2018) proposed a deep residual U-net framework for road extraction, combining ResNet and the original U-net. The algorithm is also implemented in the GeoAI platform from Microsoft for pixel level land cover classification (Microsoft, 2018). Bai, Mas and Koshimura (2018) utilities the GeoAI platform to
perform damage-mapping from satellite imagery. U-Net has been proofed to be able to do semantic classification with air photo or satellite imagery. The results are generally accurate.
This paper proposes a reusable image classifier using U-net deep learning framework for accurate and fast landslides mapping from satellite imagery.
Data Sources
In this study, FORMOSAT-2 satellite imagery is used as the sources of training data. FORMOSAT-2 is an optical satellite, with four multispectral bands: red, green, blue and near infra-red. The spatial resolution of the panchromatic band is 2-meter, while that of the multispectral bands is 8-meter. The radiometric resolution of the imagery is 8-bits.
The data used in this study is pansharpened, meaning the imagery is multispectral imagery with red, green, blue and near infra-red bands, and the spatial resolution of the imagery is 2-meter. Pansharpened imagery can keep the details from panchromatic image while keeping the spectral information from multispectral bands. A total of 250 imagery is used as training data and 25 imagery as test sets. The size of each image is 1,000 m × 1,000 m. Each imagery contains 250,000 pixels.
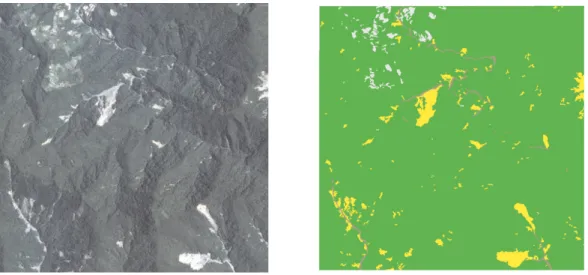
Each imagery is paired with a land cover map. A land cover map serves as the ground truth labels of the data. It determines the real class of each pixel in the image. The land cover mapping is done manually from each image. Land cover is classified into five categories for this model: vegetation, water, riverbed, landslides and miscellaneous land use like farm or buildings. The land cover maps are presented in raster format, with a resolution of 2-meter in corresponding to the satellite imagery.
Figure 1 Samples for Formosat 2 imagery and the corresponding land cover mapping (Green: vegetation, Yellow: landslide, Brown: riverbed, Gray: miscellaneous)
from open data platform of the government with the resolution of 20 m.
Methodology
This study proposes a U-Net classification model that takes satellite imagery as the input and produces outputs with five classes: vegetation, water, landslide, riverbed and miscellaneous land cover. The figure below is the flowchart of the study design.
Red
Band Green Band BandBlue BandNIR DTM Calculate Slope Slope Resample Combine Bands Train Model Land Cover Map Test Sets Apply Model To New Image Model Evaluation Results Validated Not Validated
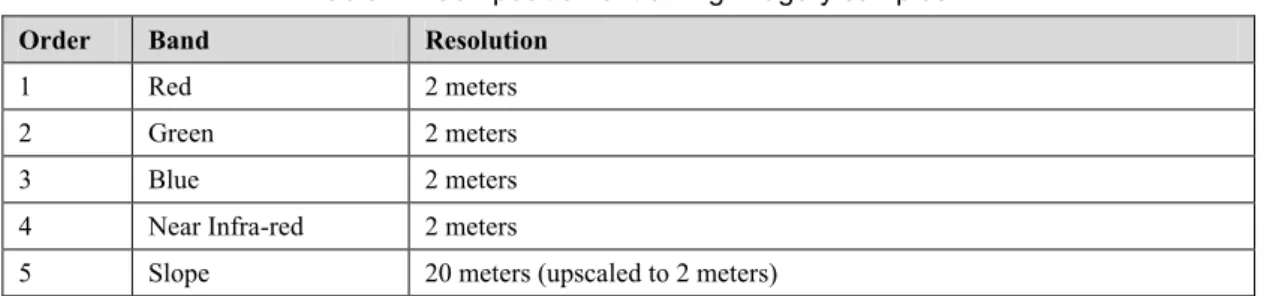
The model takes all four bands from the satellite imagery. The satellite imagery is orthorectified and pansharpened using UNB PANSHARP algorithm (Zhang, 2002). In order to better distinguish landslides from riverbed and farmland, slope derived from 20x20 meters DTM is added as additional input. To match the resolution of satellite imagery, the slope layer is resampled to 2-meter resolution using nearest neighbor resampling methods. Satellite imagery and slope are combined, forming a 5-band imagery. Land cover maps are manually digitized from the corresponding satellite imagery and stored as GeoTiff with 2-meter resolution.
Table 1 Composition of training imagery samples
Order Band Resolution
1 Red 2 meters
2 Green 2 meters
3 Blue 2 meters
4 Near Infra-red 2 meters
5 Slope 20 meters (upscaled to 2 meters)
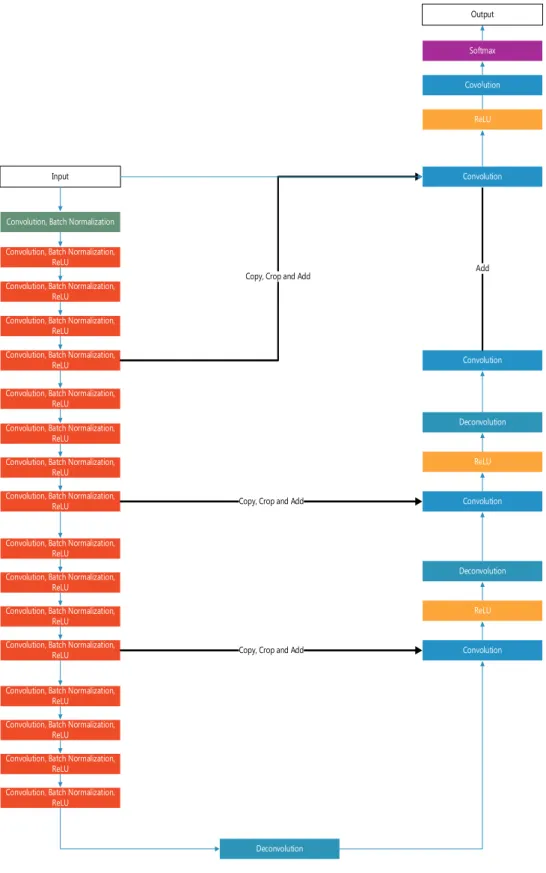
The deep learning framework used for the study is the Deep Residual U-net framework developed by Microsoft in cooperated with ESRI for the GeoAI platform. The model is originally designed for land cover mapping using air photo with four bands: red, green, blue and near infra-red. For the model to take slope information as inputs, the input layer is altered for inputting 5 bands. The input for the model is a pair of satellite imagery and its corresponding land cover map, each with sizes at 1000 * 1000 meters. Batch normalization is adopted in model. The ReLU function is used as the activation function. Figure 3 below shows the framework of the deep learning model. The model is a combination of ResNet framework and U-net framework. The framework is a U-shaped structure consists of three parts, the image encoding process on the left-hand side with stacks of convolution layers, the bridge, and the image decoding process on the right-hand size with stacks of deconvolution layers.
In the training phase, we use 250 imagery as the input. The model was trained with 500 epochs with 2000 minibatches per epoch. RMSProp is used as the optimization algorithm for learning. The model is implemented with Python language interface and Microsoft Cognitive Toolkit (CNTK). CNTK enables multiple GPU parallel processing for faster training performance.
The output of the model can be evaluated using ESRI ArcGIS Pro. The model can be applied to a new imagery that is not seen by the model during training. The results of the evaluation will be a raster layer with 5 predicted classes from the classification. Producer accuracy and user accuracy of landslide class can then be calculated to evaluate the performance of the classification.
Convolution, Batch Normalization Convolution, Batch Normalization,
ReLU Convolution, Batch Normalization,
ReLU Convolution, Batch Normalization,
ReLU Convolution, Batch Normalization,
ReLU Convolution, Batch Normalization,
ReLU Convolution, Batch Normalization,
ReLU Convolution, Batch Normalization,
ReLU Convolution, Batch Normalization,
ReLU Convolution
Convolution, Batch Normalization, ReLU Convolution, Batch Normalization,
ReLU Convolution, Batch Normalization,
ReLU Convolution, Batch Normalization,
ReLU Convolution, Batch Normalization,
ReLU Convolution, Batch Normalization,
ReLU Convolution, Batch Normalization,
ReLU Convolution, Batch Normalization,
ReLU
Deconvolution
Deconvolution
Convolution
Copy, Crop and Add
Copy, Crop and Add
ReLU Covolution
Softmax
Output
Input
Copy, Crop and Add
ReLU Convolution Deconvolution ReLU Add Convolution
Results and Discussion
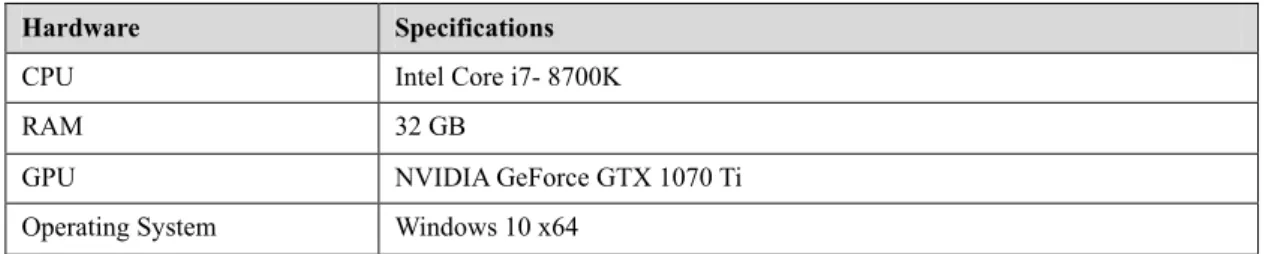
The training progress in this study is done under a single workstation environment. The configuration of the workstation is as follows. The CPU is a hexa-core CPU with the base clock of 3.70 GHz. The capacity of RAM is 32 GB. The GPU is a NVIDIA GeForce GTX 1070 Ti with 8 GB of video memory.
Table 2 Specifications of workstation environment for model training
Hardware Specifications
CPU Intel Core i7- 8700K
RAM 32 GB
GPU NVIDIA GeForce GTX 1070 Ti
Operating System Windows 10 x64
The model is trained for 500 epochs with 2000 minibatches per epoch. It takes approximately 4.8 hours to finish the training using GPU parallel processing. The training loss of each epoch is shown in Figure 4.
Figure 4 Training loss of each epochs
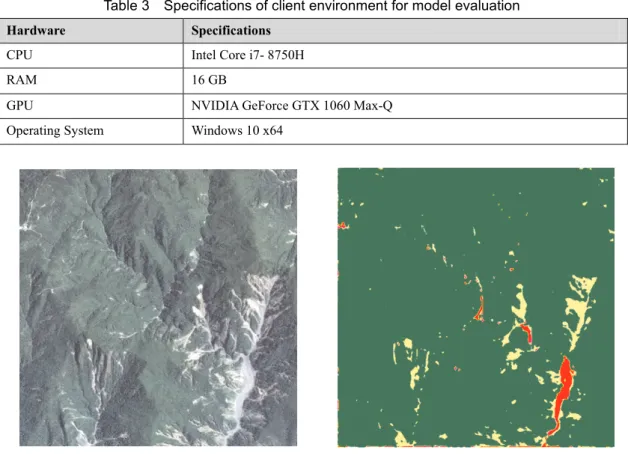
The model is applied to a set of new imagery that the model has never seen before during training. The evaluation process is done under a client environment. The environment is a laptop configured with a hexa-core CPU with the base clock of 2.20 GHz, a 16 GB RAM and a Max-Q design NVIDIA GeForce GTX 1060 with 6 GB of video memory. It takes approximately 5 seconds to apply classification to an imagery with 2500 * 2500 pixels. The classification results are in Figure 6. The confusion matrix is calculated by using 500 randomly generated checkpoints and verified by manual review. The matrix is shown in Table 4. As shown in the results, the classifier performs well on distinguishing landslides. The producer accuracy and user accuracy of landslides mapping are approximately 0.862 and 0.926 respectively. The classifier successfully distinguished landslides from riverbeds, which are easily confused with each other when using traditional
0 0.01 0.02 0.03 0.04 0.05 0.06 0.07 0.08 0.090.1 0 50 100 150 200 250 300 350 400 450 500 Lo ss Epoch
image classification methods. The classifier performs relatively poor on darker regions. Also, border effect is presented in the results. Pixels around the corner tends to be classified incorrectly. Tiling the imagery could solve the problem of border effect.
Table 3 Specifications of client environment for model evaluation
Hardware Specifications
CPU Intel Core i7- 8750H
RAM 16 GB
GPU NVIDIA GeForce GTX 1060 Max-Q
Operating System Windows 10 x64
Figure 5 Classification results of FORMOSAT-2
(Dark Green: vegetation, Light Green: landslide, Red: riverbed, Magenta: Miscellaneous) Table 4 Confusion matrix of FORMOSAT-2 classification based on 500 checkpoints
Ground Truth Class
Landslides Non-Landslides
Classified Class Landslides 50 4
Non- Landslides 8 438
Producer Accuracy: 0.862 User Accuracy: 0.926
Based on the results, we can claim that U-Net classifier is capable of preforming the task of landslides mapping. There are several advantages of adopting U-Net deep learning framework to the classification workflow. First, the classification workflow is fast. The workflow can be completely automatic. Without the need for manually providing training sites and parameters, the classification results are consistent every time
given the exact same inputs and models. Once the model is trained, it takes approximately 5 seconds for the model to fully automated classify a 2-meter resolution image with an area of 5000 by 5000 meters. In contrast to common object-based image classification, it takes around 33 seconds to perform multi-resolution segmentation and 0.1 second to perform nearest neighbor classification to the same image under the exact same environment. Time spent on manual training sites selection is not included, which depends on the experience of the operators. Second, the model is more tolerant towards incorrect ground truth. In traditional supervised classification, selecting training sites is crucial for the classification results. Bad selection will cause poor classification. For the deep learning model, small error from the ground truth is more tolerant as long as there are enough samples to train. Third, the classification model is relatively accessible. The model only requires few data input to perform. Multispectral satellite imagery, with the combination of red, green, blue and near infra-red bands, is common for most optical sensors. Slope can be calculated from DTM, which can be easily accessed from open data platform. No need for extra topographic or lithographic information. The classifier produces relatively good results. Comparing to pixel-based supervised classification, the deep learning framework produces less “salt and pepper” effect. It can also identify the border between landslides and riverbeds. The additional slope layer provides important information to distinguish landslides from different bared soil classes like riverbed. Finally, the model is robust and can be reused on different images. The model is trained on multiple imagery with different lighting conditions, and it is tested on another set of imagery independent to the training data. The classification results show that the model can perform well on data that it has not seen before without the need to retrain the model, which means that the model is not overfitting to the training data. This is an improvement from common object-based image classification, of which training sites need to be selected and models need to be trained scene by scene.
Conclusion
This study proposes a deep learning model for landslides detection from satellite imagery. Deep Residual U-Net framework is used as a classifier. FORMOSAT-2 satellite imagery is used as the training data. The model takes ground truth label and satellite imagery with 5 bands as inputs. The 5 bands are red, green, blue, near infra-red and slope respectively. The output is classification results of 5 classes: vegetation, water, landslides, riverbed and miscellaneous land cover.
A total of 250 imagery is used as inputs. The model is trained for 500 epochs, with 2,000 minibatches per epoch. The timespan of training is around 4.8 hours under a single GPU workstation environment. The classifier successfully identifies landslides, with the producer accuracy and user accuracy of landslides mapping being approximately 0.862 and 0.926 respectively when tested on FORMOSAT-2 imagery.
The model improves the workflow of landslides inventory mapping. Without human operation, the process requires less labor and expertise, and the results are much more consistent each time. Compared to the common object-based image classification workflow, the time costs for the deep learning model is
considerably faster. The model can be applied to new dataset without the need to retrain it. The model is more tolerant to incorrect ground truth, so that outdated land cover maps will not affect the overall performance of the classification. The model is very accessible, with less data required. All the model need is satellite imagery with the common four bands combination, and slope data derived from DTM. The model is also sensor independent if the imagery is scaled to the same image depth. The model can be easily adopted into workflow without the concern of niche data sources that are difficult to acquire.
The model will be useful on landslides monitoring and inventory mapping, which are elementary task for hazard mitigation and susceptibility mapping. For future work, we will seek to adapt the model to more land cover types and hazardous landscapes. Also, the effect of different spatial resolution and radiometric resolution will be discussed to pursue a sensor independent model.
Reference
Aksoy, B. and Ercanoglu, M. (2012). Landslide identification and classification by object-based image analysis and fuzzy logic: An example from the Azdavay region (Kastamonu, Turkey). Computers & Geosciences, 38(1): 87-98.
Baätz, M., Schäpe, A., Strobl, J., Blaschke, T. and Griesebner, G. (2000). Multiresolution segmentation: An optimization approach for high quality multi-scale image segmentation. Angewandte Geographische Informations-Verarbeitung XII: 12-23.
Bai, Y., Mas, E. and Koshimura, S. (2018). Towards operational satellite-based damage-mapping using U-net convolutional network: a case study of 2011 Tohoku Earthquake-Tsunami. Remote Sensing, 10(10): 1626.
Blaschke, T. (2010). Object based image analysis for remote sensing. ISPRS journal of photogrammetry and
remote sensing, 65(1): 2-16.
Borghuis, A.M., Chang, K. and Lee, H.Y. (2007). Comparison between automated and manual mapping of typhoon‐triggered landslides from SPOT‐5 imagery. International Journal of Remote Sensing, 28(8): 1843-1856.
Cheng, K.S., Wei, C. and Chang, S.C. (2004). Locating landslides using multi-temporal satellite images. Advances in Space Research, 33(3): 296-301.
Girshick, R. (2015): Fast r-cnn. In Proceedings of the IEEE international conference on computer vision: 1440-1448.
Hervás, J., Barredo, J. I., Rosin, P. L., Pasuto, A., Mantovani, F. and Silvano, S. (2003): Monitoring landslides from optical remotely sensed imagery: the case history of Tessina landslide, Italy. Geomorphology, 54(1-2): 63-75.
Iglovikov, V., Mushinskiy, S. and Osin, V. (2017). Satellite imagery feature detection using deep convolutional neural network: A kaggle competition. arXiv preprint arXiv:1706.06169.
Krizhevsky, A., Sutskever, I. and Hinton, G. E. (2012). Imagenet classification with deep convolutional neural networks. In Advances in neural information processing systems: 1097-1105.
Rakhlin, A., Davydow, A. and Nikolenko, S. I. (2018, June). Land Cover Classification From Satellite Imagery With U-Net and Lovasz-Softmax Loss. In CVPR Workshops: 262-266.
Redmon, J., Divvala, S., Girshick, R. and Farhadi, A. (2016). You only look once: Unified, real-time object detection. In Proceedings of the IEEE conference on computer vision and pattern recognition: 779-788. Ren, S., He, K., Girshick, R. and Sun, J. (2015). Faster r-cnn: Towards real-time object detection with region
proposal networks. In Advances in neural information processing systems: 91-99.
Ronneberger, O., Fischer, P. and Brox, T. (2015, October). U-net: Convolutional networks for biomedical image segmentation. In International Conference on Medical image computing and computer-assisted
intervention: 234-241. Springer, Cham.
Stumpf, A. and Kerle, N. (2011). Object-oriented mapping of landslides using Random Forests. Remote
sensing of environment, 115(10): 2564-2577.
Van Western, C. J. (2000). Remote sensing for natural disaster management. International archives of photogrammetry and remote sensing, 33: 1609-1617.
Zhang, Y. (2002, June). A new automatic approach for effectively fusing Landsat 7 as well as IKONOS images. In IEEE International Geoscience and Remote Sensing Symposium (Vol. 4, pp. 2429-2431). IEEE.
Zhang, Z., Liu, Q. and Wang, Y. (2018). Road extraction by deep residual u-net. IEEE Geoscience and
Remote Sensing Letters, 15(5): 749-753.
投稿日期:108 年 10 月 04 日 修正日期:108 年 11 月 02 日 接受日期:108 年 11 月 14 日