Raman Study of the Phase Transition in [N(C
2H
5)
4]
2ZnCl
4Single Crystals
Tsai-Shia Jung, Hsiang-Lin Liu and Jiang-Tsu Yu
Institute of Physics, National Taiwan Normal University, Taipei, Taiwan 116, R.O.C.
(Received April 10, 2001)
Polarized Raman spectra of oriented single crystals [N(C2H5)4]2ZnCl4 (TEAZ) have been recorded from 320 K to 40 K during both cooling and heating cycles, covering the known phase transitions. The temperature dependence of the internal vibration of the ZnCl¡ 24 ion and C-C bond is explained in terms of the motional narrowing due to the disordering CH3 group in TEAZ, which results in the splitting of the ZnCl¡ 24 and C-C lines in the internal mode region. Our Raman data shows that the phase transition is associated with the onset of the CH3group disordering. We have also observed that the phase transition exhibits thermal hysteresis.
PACS. 78.30.–j – Infrared and Raman spectra and scattering.
PACS. 61.50.Ks – Crystallographic aspects of polymorphic and order-disorder transformations.
I. Introduction
First-row transition metal compounds of the form [N(C2H5)4]2MCl4(in which M represents Mn, Fe, Co, Ni, Cu or Zn) have attracted much interest due to various structural transformations, related to the dynamics of the organic cations and inorganic anions, which they undergo. For any [N(C2H5)4]2MCl4-type crystals, no structural analysis has been performed even at room temperature. It was predicted by Wolthuis et al., on the basis of the measured lattice constants, that the compounds MnCl4 and ZnCl4 are isostructural with [N(C2H5)4]2NiCl4 [1]. But the symmetry and structure below the transition temperature has not been determined. It was reported by Melia et al., based on the results of DSC (differential scanning calorimetry) measurements, that there exist two phase transitions at temperatures between 213 K and 218 K in [N(C2H5)4]2ZnCl4 during cooling, and one phase transition at 227 K on heating [2]. Up to now, investigations of nuclear magnetic resonance (NMR) and dielectric measurements [1], heat capacity [2, 3], dielectric dispersion [4], EPR spectrum [5, 6] have been reported for these materials. In this paper we present the results of a polarized Raman scattering investigation of a [N(C2H5)4]2ZnCl4 single crystal.
II. Experimental
Single crystals of [N(C2H5)4]2ZnCl4(TEAZ: tetraethyl-ammonium tetrachlorozincate) were grown by mixing ethanolic solutions containing stoichiometric amounts of tetraethylammonium chloride and zinc chloride. TEAZ exhibits tetragonal symmetry, the space group is P42/nmc with Z = 2, cell constants are a = 9.04 Å and c = 14.99 Å at room temperature [1]. The crystals we
344 ° 2001 THE PHYSICAL SOCIETYc
According to Torgashev et al., [7], the Raman spectrum of a TEAZ single crystal can be divided into three parts: (1) the external vibration modes below 100 cm¡ 1; (2) the vibrational modes of the ZnCl24¡ anion at 100» 350 cm¡ 1; and (3) the vibrational modes of the TEA+cation at above 350 cm¡ 1. We will discuss our experimental results according to this classification. III-1. External modes
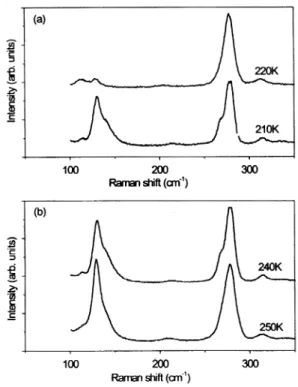
Figures 1(a) and 1(b) show, respectively, the Raman spectra of the external modes in the (ZZ) polarization on cooling and on heating. On cooling, changes in the spectrum were observed between 220 K and 210 K, while on heating they occurred between 240 K and 250 K. This thermal hysteresis in the external modes agrees very well with other observations [1, 5, 6], and can be taken as a consequence of the occurrence of a phase transition. On cooling, the Raman profiles of the external modes changes abruptly, and no soft modes were observed. These lead us to believe that the phase transition in the TEAZ crystals belongs to the order-disorder type. Concurrent with the onset of this type of phase transition, changes in the profiles of the internal modes are usually observed [8], and this is indeed the case for TEAZ crystals.
III-2. Internal modes (a) Vibration of the anions
Figures 2(a) and 2(b) show, respectively, the Raman spectra of the internal modes in the (ZZ) polarization on cooling and on heating. Clearly observable changes in the spectra were recorded at around 130 cm¡ 1and 278 cm¡ 1. A splitting of the spectrum was observed concurrent with the onset of the phase transition. According to previous reports [7, 9], the peaks at 130 cm¡ 1 and 278 cm¡ 1 can be respectively assigned as the F2 and A1 vibration modes of the ZnCl42¡ anion.
(b) Vibration of the cations
Figure 3 shows the spectrum of the cation at 600 » 1200 cm¡ 1 in the (XZ) and (ZZ) polarizations, at room temperature. It can be noted that the 1183 cm¡ 1 vibration mode, which was observed in the (XZ) polarization, is not observed in the (ZZ) polarization; while the 1008 cm¡ 1vibration mode observed in the (ZZ) polarizations is absent in the (XZ) polarization. Figure 4 shows the spectra of the anion in the (XZ) and (ZZ) polarizations, at a temperature below the phase transition. Two additional vibration modes were observed at temperatures below the phase transition. Furthermore, the profiles of the 900 cm¡ 1 and 1073 cm¡ 1 peaks exhibit splitting. In Table I, the vibration modes and the symmetries of three compounds containing TEA ion are listed, for those modes with frequencies at around 900 cm¡ 1and 1073 cm¡ 1[10, 11]. It can be
FIG. 1. Temperature dependence of the Raman spectra of the TEAZ crystal in the (ZZ) scattering geometry below 100 cm¡ 1. (a) on cooling, (b) on heating.
FIG. 2. Temperature dependence of the Raman spectra of the TEAZ crystal in the (ZZ) scattering geometry between 100» 350 cm¡ 1. (a) on cooling, (b) on heating.
FIG. 3. Raman spectra in the (XZ) and (ZZ) configurations between 600 and 1200 cm¡ 1 at 300 K.
FIG. 4. Raman spectra in the (XZ) and (ZZ) configurations between 600 and 1200 cm¡ 1 at 210 K. Two additional modes at 1008 cm¡ 1and 1183 cm¡ 1were ob-werved.
noted from the data shown in Table I that these two vibration modes observed below the phase transition are the rock modes of the CH3molecule, and that the modes that exhibit splitting belong to the C-C vibration modes.
º31 1073 cm¡ 1 1068 cm¡ 1 1066 cm¡ 1 F2, (C-C)
Wolthuis et al. [1] considered the motion of the TEA+ ion as being comprised of the following four parts: the rotation of the outermost CH3molecular groups; the rotation of the CH2 molecules; the rotation of the whole TEA+ molecule about its fourfold axis; and the rotation of the whole molecule about all possible orientations. As the time span of interaction between a photon and a molecule is shorter than the period of the molecular flipping, microregions and short-term disorders in molecular arrangements can then be detected in Raman experiments [12]. It is due to this kind of momentary disorder that causes the CH3 molecular groups to lose its center of symmetry, and makes all of its vibration modes Raman active [13]. The rock modes of the CH3 molecular groups we have observed in TEAZ in the (XZ) and (ZZ) polarizations can be explained as such. A similar situation has been observed in NaNO2as well [14].
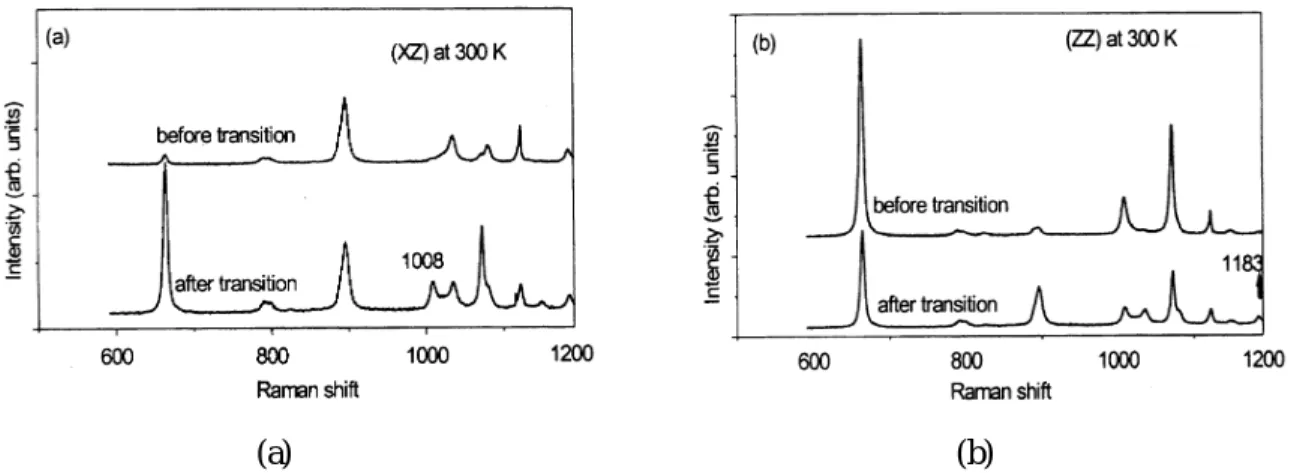
The splittings observed in the F2 and A1 vibration modes of the ZnCl42¡ ion and the C-C vibration mode of the TEA+ ion can be explained by the motional narrowing theory [15]. This theory argues that when the motional velocity of the nearby molecules is smaller than a certain value, a single peak in the NMR spectrum will split. This theory has been successfully used to explain the mode splittings observed in Raman spectra [8, 16]. This splitting occurs because a time-varying field accompanies the molecular motion of the nearby polar molecules. In TEAZ crystals, it is likely that the rotational disorder of the CH3 molecular groups at temperatures below the phase transition creates a time-varying field for its nearby molecules, which causes the vibration modes of the C-C bond and the ZnCl42¡ ions to split. Figure 5(a) shows the Raman spectrum of TEAZ crystals in the (XZ) polarization at 300 K; the lower pattern was observed after the crystal had been cycled through the phase transition. Figure 5(b) shows a similar spectrum for the (ZZ) polarization. It can be noted that the splitting of the C-C vibration mode persists at 300 K for sample crystals that have been thermally cycled through the phase transition. This suggests that once a crystal has been cooled to reach its molecular ordered state, it would not immediately return to the disordered state in subsequent heating.
IV. Conclusion
The Raman spectra were measured in TEAZ single crystals in the temperature range above and below the transition temperature. It was found that the 278 cm¡ 1, 900 cm¡ 1and 1073 cm¡ 1
(a) (b)
FIG. 5. Raman spectra between 600 and 1200 cm¡ 1 at 300 K before and after transition. (a) in the (XZ) configuration, (b) in the (ZZ) configuration.
bands split as the temperature was decreased to below the transition temperature. This behavior can be understood according to the motional narrowing theory. This may imply that the transition is likely to be triggered by the disordering CH3group on going in TEAZ. We have also observed that the Raman spectra of the crystals exhibiting hysteresis ongoing through the reported phase transition temperature.
References
[ 1 ] A. J. Wolthuis et al., Physica. 142B, 301 (1986).
[ 2 ] T. P. Melia, and R. Merrifield, J. Chem. Soc. A, 1166 (1970).
[ 3 ] A. Bencini, C. Benelli, and D. Gatteschi, Inorg. Chem 19, 1632 (1980). [ 4 ] G. E. Shankle et al., J. Chem. Phys. 56, 3750 (1972).
[ 5 ] C. P. Landee and E. F. Jr. Westrum, J. Chem. Thermodynamics 11, 247 (1979). [ 6 ] M. Iwata and Y. Ishibashi, J. Phys. Soc. Jpn. 60, 3245 (1991).
[ 7 ] V. I. Torgashev et al., Phys. Stat. Sol. (b) 165, 305 (1991).
[ 8 ] R. Sobiestianskas, K. Abe, and T. Shigenari, J. Phys. Soc. Jpn. 65, 3146 (1996). [ 9 ] S. H. Tang, E. C. Looi, and S. Radhakrishna, Phys. Stat. Sol. (b) 135, 519 (1986).
[10] W. H. J. de Beer and A. H. Heyns, Spectrochim Acta 37A, 1099 (1981). [11] M. A. Hooper and D. W. James, Aust. J. Chem. 24, 1331 (197I). [12] Y. Yamada, Y. Fujii, and I. Hatta. J. Phys. Soc. Jpn 24, 1053 (1968).
[13] E. Whalley and J. E. Bertie, J. Chem Phys. 46, 1264 (1967); 46, 1271 (1967). [14] C. M. Hartwig, E. Wiener-Avnear, and S. P. S. Porto, Phys. Rev. B5, 79 (1972).
[15] A. Abragam, The Principles of Nuclear Magnetism, (Oxford University Press, London, 1961), Ch. X. [16] P. Kaung, M. Kasahara, and T. Yagi, J. Phys. Soc. Jpn. 65, 1114 (1996).