國
立
交
通
大
學
管理科學系
博 士 論 文
No. 026
經營績效評估之綜合管理架構研究-
應用於國軍零售供應站
A COMPREHENSIVE MANAGERIAL FRAMEWORK
FOR OPERATING PERFORMANCE MEASUREMENT:
Application in Taiwan’s Military Welfare Department
研 究 生:王宗誠
指導教授:楊 千 教授
國 立 交 通 大 學
管理科學系
博 士 論 文
No. 026
經營績效評估之綜合管理架構研究-
應用於國軍零售供應站
A COMPREHENSIVE MANAGERIAL FRAMEWORK
FOR OPERATING PERFORMANCE MEASUREMENT:
Application in Taiwan’s Military Welfare Department
研 究 生:王宗誠
研究指導委員會:李經遠 教授
王耀德 教授
指導教授:楊 千 教授
經營績效評估之綜合管理架構研究-
應用於國軍零售供應站
A COMPREHENSIVE MANAGERIAL FRAMEWORK
FOR OPERATING PERFORMANCE MEASUREMENT:
Application in Taiwan’s Military Welfare Department
研 究 生:王宗誠 Student:Tsung-cheng Wang
指導教授:楊 千 Advisor:Chyan Yang
國 立 交 通 大 學
管理科學系
博 士 論 文
A DissertationSubmitted to Department of Management Science College of Management
National Chiao Tung University in Partial Fulfillment of the Requirements for the Degree of Doctor of Philosophy In Management
December 2006
Hsin-Chu, Taiwan, Republic of China
經營績效評估之綜合管理架構研究-
應用於國軍零售供應站
研究生:王宗誠
指導教授
:楊千
國立交通大學管理科學系博士班
摘
要
本論文主要以探索台灣國軍零售福利站之營運效率並擘劃運用標竿學習法指導營 運效率不佳之零售店,學習經營效率極佳之福利站。 幾項實際之營運經驗法則分述如 下: (1) 台灣國軍零售福利站之技術無效率,其主要由純技術無效率造成,而非規模 無效率。 本研究同時也建議福利站之營運經理應先聚焦於純技術無效率之改革,而非 先改進其規模無效率。 (2) 位於北部地區之零售福利站平均營運績效優於位於中 部、南部、及東部之零售福利站。 由上述發現顯示零售福利站所處區域在影響營運績 效上扮演一關鍵性腳色。 (3) 在不同層級對服務滿意度之零售福利站經營績效,確實 有非常明顯之影響。 (4) 對顧客吸引力測度顯示,新營零售福利站為最具吸引力之福 利站,如具全球化經營觀點之管理者。 同時,不論用何種評審標準與流程顯示台東零 售福利站與其他福利站相比較,均不具競爭力。(5) 用資料包絡分析法(DEA) 相互關 連性可顯示出零售福利站之標竿學習路徑,使吾等可得知如何改進無效率之零售福利 站與確認何者是最具績效福利站。故本研究運用 DEA 評估國軍零售福利站之經營效率 為重要實務之運用。 關鍵字:資料包絡分析法; 背景依賴資料包絡分析法; 吸引力測度; 進步測度; 零售店; 分層資料包絡分析法.
A COMPREHENSIVE MANAGERIAL FRAMEWORK
FOR OPERATING PERFORMANCE MEASUREMENT:
Application in Taiwan’s Military Welfare Department
ABSTRACT
A comprehensive framework of performance measurement is developed and illustrated through application to in Taiwan’s Military Welfare Department. This dissertation aims to explore the operating efficiency and the benchmark-learning roadmap of retail stores for the General Welfare Service Ministry (GWSM) in Taiwan. Several empirical results are shown: (1) the overall technical inefficiencies of GWSM retail stores are primarily due to the pure technical inefficiencies rather than the scale inefficiencies. This also suggests that managers should focus on removing the pure technical inefficiency of retail stores, before improving their scale efficiencies; (2) the retail stores located on north on the average operate better than those on the other three regions. The findings show that the retail store’s region plays key role which affects its operating performance; (3) the service-satisfaction levels do have a very significant influence upon retail store’s performance; (4) the attractiveness measure shows that Hsinying retail store is the most attractive retail store, i.e. global leader, no matter which evaluation context is chosen, and the progress measure shows that Taitung retail store is the worst retail store; (5) the context-dependent DEA successfully draws the GWSM retail stores’ benchmark-learning roadmap to improve the inefficient retail stores progressively and can identify the best retail store. The potential applications and strengths of DEA in assessing the military retail stores are highlighted.
Keywords: Data envelopment analysis; context-dependent DEA; attractiveness measure;
ACKNOWLEDGEMENT
Several people were instrumental in the completion of this research. First and foremost, I would like to express my gratitude to Professor Yang, Chyan who participated in this research as my dissertation advisor. He provides excellent support and guidance in the domain of doctoral learning sanctuary which let me undergo the learning experience.
In writing this dissertation I had a great deal of help from others. First, I want to thank Lu ,Wen-min for giving me a lot of help and direction to find the information of this research. I also want to thank orals committee professor providing Li, Jing-yuan, Huang, Ren-hong and associate professor Hsu, Kung-hua and Zuo, Jie-guan giving me very valuable comments for my dissertation. Further, Dr. Craig Brand Dean of Academic Affairs, Defense Institute of Security Assistance Management in U.S., provided me the General Welfare Service Ministry information of the U.S. With their help, I can fully understand the current GWSM situation in the whole world. Finally, I especially want to thank my wife Kuei-Chu, and my sons Wen-Yu, Wen-Shen and Wen-Mao to support and accompany me in going through these couple years in National Chiao Tung University
TABLE LIST
Table 1. Literature survey of the DEA model on the retail industry………. Table 2. Descriptive statistics for the 31 GWSM retail stores in Taiwan………. Table 3. Correlation coefficients among inputs and outputs………. Table 4. Efficiency scores of the 31GWSM retail stores……….. Table 5. Non-parametric statistical analysis of location for the 31 GWSM retail
stores
Table 6. Levels of efficient frontiers………. Table 7. Attractive and progress scores for the retail stores in different……….
evaluation context 8 12 13 28 29 34 35
Figure List
Figure 1. The Organization of Military Welfare Department……… Figure 2. Research Flow Chart……….. Figure 3. Managerial Performance Model………. Figure 4 Graphical Illustration of Measuring Technical Efficiency………….. Figure 5. Service-satisfaction index/pure technical efficiency cross-tabulation Figure 6. Context-DEA Figure………... Figure 7. Attractiveness/progress score for the retail stores in the………
second-level
Figure 8. Map of GWSM”s RTS and Location………. 2 5 12 15 31 33 37 40
ACRONYMS AND ABBREVIATIONS
BLR- Benchmark-Learning Roadmap
BCC- Banker, Charnes, and Coope Model (1984) CCR- Charnes, Cooper, and Rhodes Model, (1978) CRS- Constant Return to Scale
DEA- Data Envelopment Analysis DMU- Decision Making Unit DRS- Decreasing Returns to Scale
GWSM- General Welfare Service Ministry IRS- Increasing Returns to Scale PTE- Pure Technical Efficiency R.O.C.- Republic of China
SE- Scale of Efficiency
SFA- Stochastic Frontier Model TE- Technical Efficiency
CONTENTS
中文摘要……….... i Abstract………... ii Acknowledgement………..iii Table List………...iv Figure List……….. vAcronyms and Abbreviations……….vi
Chapter 1. Introduction 1.1 History………... 1
1.2 Organization and Employee……….. 1
1.3 Principles of Management………...3
1.4 Research Motivation………..…3
1.5 Research Purposes...………..3
1.6 Organization of Dissertation………..4
Chapter 2. Literature Review 2.1 Literature Survey………6
2.2 Data Selection and Description………...6
Chapter 3. Methodology 3.1 Technical Efficiency Measure………...10
3.2 Context-Dependent DEA………...13
3.2.1 Stratification DEA Method ...………...13
3.2.2 Multiplier Model of the CCR/BCC Model………...15
3.2.3 The Dual Program of the CCR/BCC Model………...18
3.2.4 The Slack-Adjusted CCR/BCC Model………. .19
3.2.6 Context-Dependent DEA………..22
Chapter 4. Empirical Results and Analysis 4.1 Performance of GWSM Retail Stores………..25
4.2 Analysis of Managerial Decision-Making Matrix………...29
4.3 Constructing a Benchmark-Learning Roadmap………...31
4.4 Discussion………38
Chapter 5. Conclusion Remarks 5.1 Conclusion………....41
5.2 Suggestion………42
Reference………..44
Appendix………..50
Chapter 1. Introduction
1.1 History
In 1955 the President Chiang Kai-shek established Military Welfare Enterprise Management Division in Combined Service Forces. In 1964 it was renamed Military Welfare Department and was then officially under the supervision of Ministry of National Defense (MND) of R.O.C. In 1975 it expanded its service to government employees and staffs of public schools in addition to the welfare supplies in the military. In 1981, it provided additional service to veterans and their dependents. In 1989, its service to government employees and staffs of public schools was cancelled as ordered. Since then it has been in charge of the supply of supplementary foods and products in the military.
Up to now, there are 31 supply stations for daily necessities. General Welfare Service Ministry (GWSM) retail stores provide many benefits. For some Taiwanese military personnel, they remain the only affordable and accessible source of familiar products. For service members, MND's policy of selling goods at below-market prices makes its stores important nonbenefit. The prices of commissary goods are about 10 to 20 percent below commercial market levels.
1.2 Organization and Employees
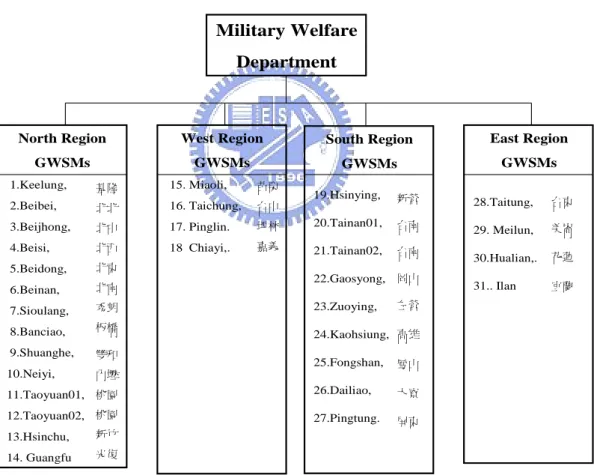
According to the General Welfare Service Ministry (GWSM) annual report in 2003, the Taiwan’s Military Welfare Department (TMWD) in MND has 788 employees and takes charge of controlling over GWSM’s operation efficiencies. The TMWD divides into North, West, South and East four management divisions. (As in Figure. 1)
z In North region, it has 14 GWSMs such as: Keelung, Beibei,Beijhong, Beisi, Beidong, Beinan, Sioulang, Banciao, Shuanghe, Neiyi, Taoyuan01, Taoyuan02, Guangfu,and Hsinchu.
z In West region, it has 4 GWSMs such as Miaoli, Chiayi, Taichung, and Pinglin. z In South region, it has 9 GWSMs such as Hsinying, Tainan01, Tainan02, Gaosyong,
Zuoying, Kaohsiung, Fongshan, Dailiao, and Pingtung.
z In East region, it has 4 GWSMs such as Taitung, Ilan, Hualian, and Meilun.
Military Welfare Department South Region GWSMs 19.Hsinying, 20.Tainan01, 21.Tainan02, 22.Gaosyong, 23.Zuoying, 24.Kaohsiung, 25.Fongshan, 26.Dailiao, 27.Pingtung. North Region GWSMs 1.Keelung, 2.Beibei, 3.Beijhong, West Region GWSMs 15. Miaoli, 16. Taichung, 17. Pinglin. 18 Chiayi,. East Region GWSMs 28.Taitung, 29. Meilun, 30.Hualian,. 31.. Ilan 基隆 北北 北中 北西 北東 北南 秀朗 板橋 雙和 內壢 桃園 桃園 新竹 光復 苗栗 台中 坪林 嘉義 新營 台南 台南 岡山 左營 高雄 鳳山 大寮 屏東 台東 美崙 花蓮 宜蘭 4.Beisi, 5.Beidong, 6.Beinan, 7.Sioulang, 8.Banciao, 9.Shuanghe, 10.Neiyi, 11.Taoyuan01, 12.Taoyuan02, 13.Hsinchu, 14. Guangfu
1.3 Principles of Management
GWSM retail store is a nonprofit organization, so it creates the following rules for supporting Soldiers (including cadets in military academies), reservists, veterans and their dependents. GWSM made the following rules as their operating principles.
1. Customers first, Quality products first, Quality service first. 2. Meet the needs of the customers.
3. Enhance the service to improve the welfare of the performance.
1.4 Research Motivation
Facing the ‘Two Defense Acts’ of the MND (i.e. the reorganization of MND), a military base closure program, a reduction in the proportion of defense budget in the total central government budget, and a decrease in national defense manpower, the GWSM urgently requires a performance benchmarking analysis to enhance its operational management within the GWSM retail stores and to allocate its scare defense resources. To date, studies undertaken by the GWSM are few to help managers or officers identify how a management system can be changed to improve crucial factors underlying the efficiency of retail store operations. However, since a retail store’s performance is a complex phenomenon requiring more than a single criterion to characterize it, traditional performance measurement techniques (Bush et al.,1990) have often also been criticized for being inadequate and not taking into account of mix and nature of services provided (Good, 1984). For about reasons, it motivates author try to find an effective evaluation method to solve those problems and provide some realistic suggestions to GWSM manager.
1.5 Research Purpose
is therefore to address the issues related to the performance benchmarking analysis and the potential applications and strengths of DEA in assessing the GWSM. This study should provide additional managerial insights into retail store in Taiwan. The purposes of this study are as follows:
The first purpose of this study is to provide a benchmarking analysis based on DEA to investigate GWSM in Taiwan and assist the managers in improving the operational management of these retail stores. The second, we also design a decision-making matrix to identify the position of the 31 retail stores, which help the manager and/or authorities to improve their operating efficiencies; Furthermore, we implement the context-dependent DEA to draw the GWSM retail stores’ benchmark-learning roadmap to improve the inefficient retail stores progressively and can identify the best retail store.
1.6 Framework of the Dissertation
This dissertation is organized in the following manner as Figure 2 shows: Chapter 1 presents the motives and purposes of the study, and briefly introduces the structure of this work. Prior studies which have influenced this study are discussed in Chapter 2. Chapter 3 proposes a research design that includes the criteria for performance evaluation, the data selection and description, and the introduction of DEA methodology. The empirical results and interpretations are provided in Chapter 4. Finally, Chapter 5 concludes this dissertation.
Chapter 1.
Introduction History Principles of Management Research Motivation Research Purpose Organization of the DissertationChapter 2.
Literature Review
Data Selection and Description
Chapter 3.
Methodology
Technical Efficiency Measure Context-Dependent DEA
Chapter 4.
Empirical Results and Analysis
Performance of the GWSM Retail Stores
Analysis of managerial decision-making matrix
Constructing a Benchmark-Learning Roadmap
Chapter 5.
Conclusion Remarks
Chapter 2. Literature Review
2.1 Literature Survey
According to the main purposes mentioned above, DEA has been used to measure the retail store performance over the last decade. DEA has many desirable features (Charens et al., 1994) which may explain why researchers are interested in using it to investigate the efficiency of converting multiple inputs into multiple outputs. Furthermore, DEA is also a theory-based, transparent, and reproducible computational procedure. In comparison to the traditional approaches such as ratio analysis and regression analysis (Sherman, 1986), DEA has gained several more advantages. These characteristics include (Lewin et al., 1982):
y capable of deriving a single aggregate measure of the relative efficiencies of units in terms of their utilization of input factors to produce desired outputs;
y able to handle non-commensurate multiple outputs and multiple input factors; y able to adjust for factors outside the control of the unit being evaluated;
y not dependent on a set of a priori weights or prices for the inputs or the outputs; y able to handle qualitative factors such as consumer satisfaction, quality of
employees, etc.;
y able to provide insights on the possibilities for increasing outputs and/or conserving inputs for the inefficient unit to become efficient;
y able to maintain equity in performance assessment.
2.2 Data Selection and Description
evaluation in terms of both the number of research papers published and the number of applications to real world problems (Seiford, 1997; Gattoufi et al., 2004). Previous studies that used DEA to investigate the relative efficiency of the retail industry are now described as follows.
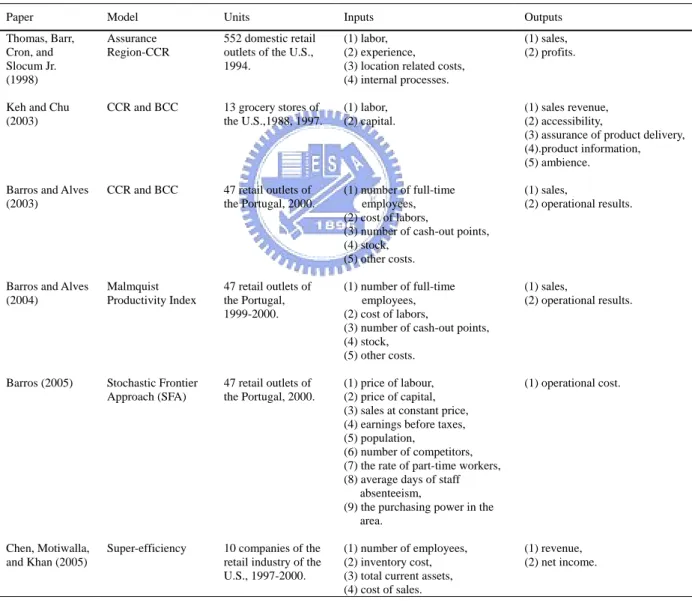
According to the former chapter mention about the requirements, we need to find an effective method to satisfy the requirements. Because of the attributes of requirements, DEA has been used extensively for benchmarking analysis ever since its introduction by Charnes et al. (1978). DEA has many desirable features (Charnes et al., 1994) which may explain why researchers are interested in using it to investigate the efficiency of converting multiple inputs into multiple outputs. The previous studies that have used DEA as related to retail industry field are now described as follows. Thomas et al. (1998) implemented DEA to probe the intra-comparative efficiency using 500 domestic retail outlets of a leading specialist retailer in U.S. This study showed that DEA not only helped make sense of the data in deriving an overall efficiency index, but also identified the best practice stores within the organization by focusing on the efficiency frontier. By using the DEA approach, Keh and Chu (2003) adopted a three–stage transformation process to assess the operating efficiency of 13 grocery stores in the U.S. for the years 1988 through 1997. The finding showed that there were increasing returns to scale in grocery retailing.
Barros and Alves (2003) implemented DEA to explore operating efficiency for a Portuguese retail store. This study showed competitiveness should be based on benchmarking the retail outlets which composed the chain. Barros and Alves (2004) estimated total productivity change for a Portuguese retail store chain with the DEA-Malmquist productivity index for the period 1999-2000. This study reported that there is room for improvement in the management of the stores. Barros (2005) utilized the stochastic frontier model (SFA) to assess the technical efficiency of a Portuguese hypermarket
retail chain. This study proposed a modification of management procedures in order to enable efficiency to be increased, based on a governance-environment framework. Chen et al. (2005) assessed 13 companies in the retail industry by using the super-efficiency DEA. This analysis indicated that the EB companies performed better in some areas than their non-EB counterpart. Table 1 presents the characteristics of these main previous studies using DEA.
Table 1. Literature survey of the DEA model on the retail industry
Paper Model Units Inputs Outputs
Thomas, Barr, Cron, and Slocum Jr. (1998) Assurance Region-CCR 552 domestic retail outlets of the U.S., 1994.
(1) labor, (2) experience, (3) location related costs, (4) internal processes.
(1) sales, (2) profits.
Keh and Chu (2003)
CCR and BCC 13 grocery stores of the U.S.,1988, 1997.
(1) labor, (2) capital.
(1) sales revenue, (2) accessibility,
(3) assurance of product delivery, (4).product information, (5) ambience. Barros and Alves
(2003)
CCR and BCC 47 retail outlets of the Portugal, 2000.
(1) number of full-time employees, (2) cost of labors,
(3) number of cash-out points, (4) stock,
(5) other costs.
(1) sales,
(2) operational results.
Barros and Alves (2004) Malmquist Productivity Index 47 retail outlets of the Portugal, 1999-2000. (1) number of full-time employees, (2) cost of labors,
(3) number of cash-out points, (4) stock,
(5) other costs.
(1) sales,
(2) operational results.
Barros (2005) Stochastic Frontier Approach (SFA)
47 retail outlets of the Portugal, 2000.
(1) price of labour, (2) price of capital, (3) sales at constant price, (4) earnings before taxes, (5) population,
(6) number of competitors, (7) the rate of part-time workers, (8) average days of staff
absenteeism,
(9) the purchasing power in the area.
(1) operational cost.
Chen, Motiwalla, and Khan (2005)
Super-efficiency 10 companies of the retail industry of the U.S., 1997-2000.
(1) number of employees, (2) inventory cost, (3) total current assets, (4) cost of sales.
(1) revenue, (2) net income.
To summarize the above studies, few research studies about the retail industry have been conducted in emerging countries (such as Taiwan) while applications of DEA for the
evaluation of retail stores have been very limited in the military. The main interest of this study is to address the issues related to the performance benchmarking analysis and to illustrate the use of a context-dependent DEA for evaluating GWSM retail stores, which should provide additional managerial insights into GWSM. The important contributions of this study include: (1) to provide a milestone analysis based on DEA to investigate Taiwan and assist the MND in improving the operational management of GWSM; (2) to design a decision-making matrix to identify the position of the 31 retail stores, which help the manager and/or authorities to improve their operating efficiencies; and (3) to implement the context-dependent DEA to draw the GWSM retail stores’ benchmark-learning roadmap to improve the inefficient retail stores progressively and can identify the best retail store.
Chapter 3. Research Design
3.1 Data Selection and Description
GWSM is in charge of the supply of supplementary foods and products in the military and provides its service to the soldiers, veterans, and their dependents. From a system perspective, organizational activities refer to the conversion of inputs in various resources to output. Output is a concrete measurement that an organization has reached its objectives. This study uses the production approach to design the performance model. The performance model measures the performance of retail stores in using four inputs to produce four outputs.
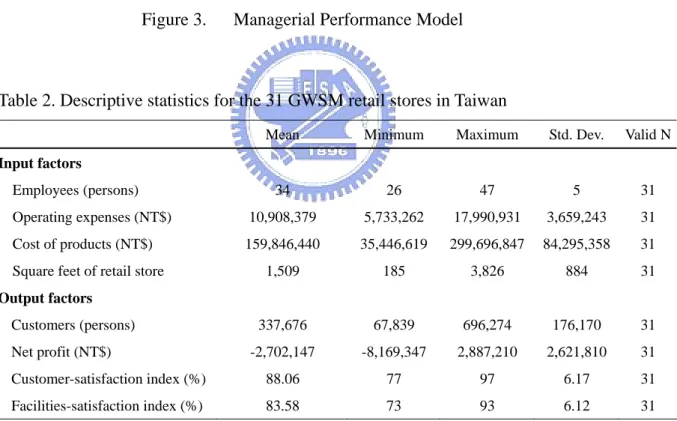
The four input factors are namely the number of full-time employees (in persons), operating expenses (in NT$), cost of products (in NT$), and area of the retail store (in square meters). The employee factor is composed of businessmen, administrators, guards, drivers, and affair employees. These employees keep retail stores operating normally. The cost regarding maintenance, marketing, and administration makes up a so-called operating expense factor which is a necessary input for maintaining operations. The cost of products is used to purchase product so as to provide supplementary foods and products to the soldiers, veterans, and their dependents. The area of the retail store refers to the total floor space used by the operational units of the retail store, measured in square feet. The service outputs are measured in terms of quantitative outputs (number of customers and net profit) and qualitative outputs (consumer-satisfaction index and facilities-satisfaction index) which are the result of a brief questionnaire set to guests after shopping (as in figure 3).
This study investigates thirty-one GWSM retail stores in Taiwan based on the retail stores’ operation data shown in the period 2003. Each of these retail stores is treated as a decision making unit (DMU) in the DEA analysis. The 31 retail stores of various
geographical dispersion are selected since they are in charge of the supply of supplementary foods and products. The performances of the retail stores are accessed based on the data obtained for the year 2003. The data are extracted from the annual report of the GWSM except for consumer-satisfaction index and the facilities-satisfaction index. The service-satisfaction index can divide into consumer-satisfaction index and the facilities-satisfaction index two parts. We traveled to the 31 GWSM stores and asked for one thousand one hundred and seventeen customers to fill in the Service-Satisfaction Questionnaire (as in appendix A) in two months. We combined consumer-satisfaction index and the facilities-satisfaction index and divided by two which can get the service-satisfaction index. Table 2 presents descriptive statistics for our dataset. In table 2, we can find the mean of net profit is negative that means the general GWSM stores have poor operation performance. This is another reason why we need to do this research for improving the GWSM stores efficiency. Because of the reorganization in MND, the circumstance and Data are dynamic for each year. We only can select the data from the recent published document; otherwise it can not match the real situation. Input/output data are reported as the total number throughout the year and can be found in The Operating Report of General Welfare Service Ministry in Taiwan published by the GWSM in November 2004, the most recent published document.
Input Factors
1.the number of employees :
•businessmen, •administrators, •guards, drivers, • affair employees
.
Output Factors
1.Quantitative : • number of customers • net profit 2.Qualitative : •consumer-satisfaction index •facilities-satisfaction index Production Transfer , 2, operating expenses : •maintenance, •marketing, •administration 3,cost of products:provide supplementary foods / product
4,area of the retail store:
total floor square feet
Figure 3. Managerial Performance Model
Table 2. Descriptive statistics for the 31 GWSM retail stores in Taiwan
Mean Minimum Maximum Std. Dev. Valid N
Input factors
Employees (persons) 34 26 47 5 31 Operating expenses (NT$) 10,908,379 5,733,262 17,990,931 3,659,243 31 Cost of products (NT$) 159,846,440 35,446,619 299,696,847 84,295,358 31 Square feet of retail store 1,509 185 3,826 884 31
Output factors
Customers (persons) 337,676 67,839 696,274 176,170 31 Net profit (NT$) -2,702,147 -8,169,347 2,887,210 2,621,810 31 Customer-satisfaction index (%) 88.06 77 97 6.17 31 Facilities-satisfaction index (%) 83.58 73 93 6.12 31
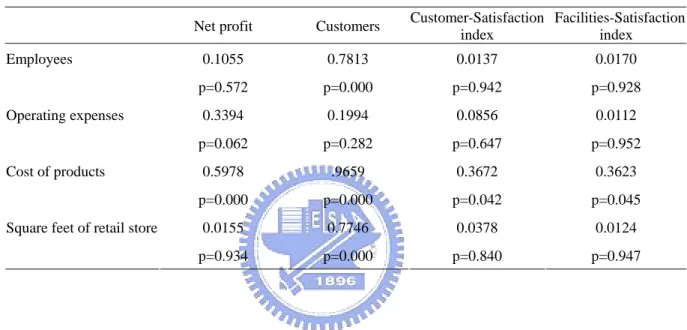
Table 3 shows the correlation matrix of inputs x and outputsi y . Notice that all the i
correlation coefficients are positive. Therefore, these inputs and outputs hold ‘isotonicity’ relations, and thus these variables are justified to be included in the model. Cooper et al. (2001) suggested that the number of retail stores should be at least triple to the number of
inputs and outputs considered. In this study the number of retail stores is 31, which is larger than triple the number of inputs (4)/outputs(4), or 31>3(4+4) = 24. It can conform to Golany & Roll experience rules the number of retail stores is larger than triple the number of inputs plus outputs. Consequently, the developed DEA model should hold high construct validity in this study.
Table 3. Correlation coefficients among inputs and outputs
Net profit Customers Customer-Satisfaction index Facilities-Satisfaction index 0.1055 0.7813 0.0137 0.0170 Employees p=0.572 p=0.000 p=0.942 p=0.928 0.3394 0.1994 0.0856 0.0112 Operating expenses p=0.062 p=0.282 p=0.647 p=0.952 0.5978 .9659 0.3672 0.3623 Cost of products p=0.000 p=0.000 p=0.042 p=0.045 0.0155 0.7746 0.0378 0.0124 Square feet of retail store
p=0.934 p=0.000 p=0.840 p=0.947
3.2 Methodology: Data Envelopment Analysis Model
3.2.1 Efficiency Measurement Concepts
DEA is known as a mathematical programming method for assessing the comparative efficiencies of a decision making unit (DMU). DEA is a non-parametric method that allows for an efficient measurement, without specifying either the production functional form or weights on different inputs and outputs. This methodology defines a non-parametric best practice frontier that can be used as a reference for efficiency measurement which can be found in Cooper et al. (2000).
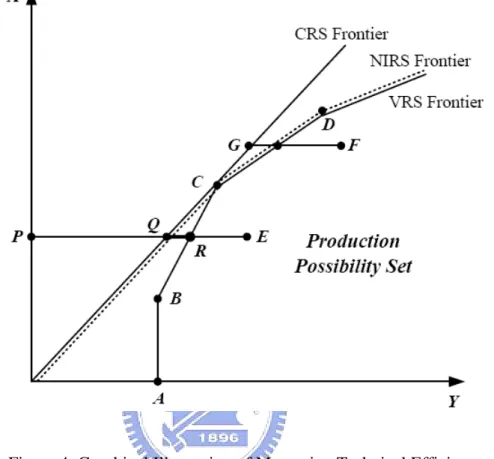
The input-oriented technical efficiency implies “by how much can input quantities be proportionally reduced without changing the output quantities produced?” The efficiency frontier presents that each DMU minimizes its inputs, keeping the output level constant. DMUs on the frontier are efficient, while DMUs inside the frontier are inefficient. Consider the case of a single input x and a single output . In Figure 4, the constant returns to scale (CRS) frontier is a simple ray (ray 0C) through the origin that envelops the data. The efficient DMU at point C lies on this frontier and its technical efficiency (TE) score equals one. The other four DMU stores (B, E, D, F) operating inside the frontier are inefficient. The TE score for the DMU operating at point E is defined by
y
PQ PE . However, the CRS
assumption is only appropriate when all DMU stores are operating at an optimal scale. Many realistic factors, such as imperfect competition, financial constraints, etc., may cause a DMU not to operate at optimal scale. Thus, there is also a variable returns to scale (VRS) DEA model. In Figure 4, the VRS frontier is the piecewise linear frontier ABCD. This
general form envelops the data more closely. The DMUs at B, C, and D lying on this
frontier are efficient with a score of one. The relative inefficient DMU E is given by a pure
technical efficiency (PTE) score (PR PE ). The TE is decomposed into PTE and scale
efficiency (SE). The SE can be estimated by dividing PTE into TE.
To investigate the current operating region to scale inefficient DMU stores, this may be determined by running an additional DEA problem with non-increasing returns to scale (NIRS)
imposed. This may be determined by running an additional DEA problem with non-increasing returns to scale (NIRS) imposed. The NIRS DEA frontier is also plotted in
Figure 4. The nature of the scale inefficiencies (i.e. due to increasing or decreasing returns to scale) for a particular DMU can be determined by seeing whether the NIRS TE score is
4), then increasing returns to scale (IRS) exist for the DMU. If they are equal (as is the case
for point F in Figure 4), then decreasing returns to scale (DRS) apply.
Figure 4. Graphical Illustration of Measuring Technical Efficiency (Input-Oriented DEA Using a Single Input to Produce a Single Output)
3.2.2 Multiplier Model of the CCR/BCC Model
DEA is a mathematical model that measures the relative efficiency of decision-making units with multiple inputs and outputs but with no obvious production function to aggregate the data in its entirety. Relative efficiency is defined as the ratio of total weighted output to total weighted input. By comparing n units with outputs denoted by s y , ro r= … , 1, ,s
and m inputs denoted by x , ,io i= …,m, the efficiency measure ho for the target ( ) is
o
DMU
1, ,
1 1 s r ro r o m i io i u y h Max v x = = =
∑
∑
,where the weights, and , are non-negative. A second set of constraints requires that the same weights, when applied to all DMUs, do not provide any unit with efficiency greater than one. This condition appears in the following set of constraints:
r u vi 1 1 1 s r rj r m i ij i u y v x = = ≤
∑
∑
, for j= … . 1, ,nThe efficiency ratio ranges from zero to one, with the target being considered relatively efficient if it receives a score of one. Thus, each unit will choose weights so as to maximize self-efficiency, given the constraints. The result of the DEA is the determination of the hyper planes that define an envelope surface or Pareto frontier. DMUs that lie on the surface determine the envelope and are deemed efficient, whilst those that do not are deemed inefficient. The formulation described above can be translated into a linear program, which can be solved relatively easily and a complete DEA solves linear programs, one for each DMU. o DMU n 1 1 1 1 . . 1, 0, 1, , , , 0; 1, , ; 1, , s o r ro r m i io i s m r rj i ij r i r i h Max u y s t v x u y v x j n u v i m r s = = = = = = − ≤ = … ≥ = … = …
∑
∑
∑
∑
(1)Eq. (1), often referred to as the CCR model (Charnes et al., 1978), assumes that the production function exhibits constant returns to scale. The BCC model (Banker et al., 1984) adds an additional constant variable, uo, in order to permit variable returns to scale:
1 1 1 1 . . 1, 0, 1, , , free in sign, , 0; 1, , ; 1, . o r ro o r m i io i s m r rj i ij o r i o r i h Max u y u s t v x u y v x u j n u u v i m r s = = = = = − = − − ≤ = … ≥ = … = …
∑
∑
∑
∑
s (2)It should be noted that the results of the CCR input-minimized or output-maximized formulations are the same, which is not the case in the BCC model. Thus, in the output-oriented BCC model, the formulation maximizes the outputs given the inputs and vice versa.
3.2.3 The Dual Program of the CCR/BCC Model
If a DMU proves to be inefficient, a combination of other efficient units can produce either greater output for the same composite of inputs; use fewer inputs to produce the same composite of outputs or some combination of the two. A hypothetical decision making unit can be composed as an aggregate of the efficient units, referred to as the efficient reference set for inefficient . The solution to the dual problem of the linear program directly computes the multipliers required to compile efficient units. The pure technical efficiency (PTE) of the target ( ) in the BCC model can be computed as a solution to the following linear programming (LP) problem.
o DMU o DMU o= … n1, , 1 1 1 . . , 1, , , , 1, , , 1, 1, , , , 0; . o n j ij o io j n j rj ro j n j j o j Min s t x x i m y y r s j n i and r θ λ θ λ λ θ λ = = = ≤ = ≥ = = = ≥ ∀
∑
∑
∑
… … … (3)In the case of an efficient DMU, all dual variables will equal zero except for λo and o
θ , which reflect the ’s efficiency, both of which will equal one. If is inefficient,
o
DMU DMUo
o
θ will equal the ratio solution of the primal problem. The remaining variables, j
λ , if positive, represent the multiples by which ’s inputs and outputs should be multiplied in order to compute the composite efficient DMU. If
o DMU 1 1 n j j= λ =
∑
is dropped from Eq.(3), then the technology is said to exhibit constant returns to scale (CRS). The technical efficiency (TE) of the target DMUo is defined as TE = θo under the input-oriented CRS model (Charnes et al., 1978).3.2.4 The Slack-Adjusted CCR/BCC Model
In the slack-adjusted DEA models, see for example model (3), a weakly efficient DMU will now be evaluated as inefficient, due to the presence of input and output oriented slacks
and , respectively. The pure technical efficiency (PTE) of the target
( ) in the BCC model can be computed as a solution to the following linear programming (LP) problem. i s− sr+ DMUo 1, , o= … n 1 1 1 1 1 . . , 1, , , , 1, , , 1, , , , 0; 0; . m s o i r i r n j ij i o io j n j rj r ro j n j j o j i r Min s s s t x s x i m y s y r s s s i and r θ ε λ θ λ λ θ λ ε − + = = − = + = = − + ⎛ ⎞ − ⎜ + ⎟ ⎝ ⎠ + = = − = = = ≥ > ∀
∑
∑
∑
∑
∑
… … (4)The PTE of the target DMUo is defined as PTE= . By varying the index θo ' '
over all DMUs, we arrive at the PTE in each DMU. If
o
PTE= and all input and output 1 slacks, and , are equal to zero, then the is technically efficient. If PTE is smaller than one, then is technically inefficient. The solution value of
s− s+ DMUo
o
DMU λj
indicates whether DMUj serves as a role model or peer for DMUo. If λj = , then 0 is not a peer. However, if
j
DMU λj > , say 0 λj =0.4, then is a peer DMU with a 40 percent weight placed on deriving the target efficient output and input levels for
. For an inefficient , we have the expression in Eq. (5). j
DMU
o
1 1 , 1, , , , r 1, , , n o io ij j i j n ro rj j r j x x s i m y y s s θ λ λ ∗ −∗ = ∗ +∗ = = + = = − =
∑
∑
… … (5) where θjo, ,si−∗ sr+∗ and λ∗j are optimal slacks and weights obtained from Eq. (4). Thecan be improved and become efficient by deleting its excess input and augmenting the shortfall output as follows:
(
, o io ro DMU x y)
1 1 ˆ , 1, , , ˆ = , r 1, , . n io o io i ij j j n ro ro r rj j j x x s x i m y y s y s θ λ λ −∗ ∗ = +∗ ∗ = = − = = = + =∑
∑
… … (6)This operation is called BCC-projection.
If is dropped from Eq.(4), then the technology is said to exhibit constant returns to scale (CRS). The technical efficiency (TE) of the target is defined as
= 1 1 n j j= λ =
∑
o DMUTE θo under the input-oriented CRS model (Charnes et al., 1978). The scale efficiency (SE) for the target DMUo is then obtained as.
/
SE=TE PTE. (7) The represents the proportion of inputs that can be further reduced after pure technical inefficiency is eliminated if scale adjustments are possible. It has a value of less than or equal to one. If the target has a value equal to one, then it is operating at
the constant returns to scale size. If is less than one, then the target is scale
inefficient and there is potential input savings through the adjustment of its operational scale. Whether the scale inefficient should be either downsizing or expanding depends on its current operating scale.
SE o DMU SE DMUo o DMU
3.2.5 Returns to Scale
There are at least three different basic methods of testing a DMU's returns to scale (RTS) nature which have appeared in the DEA literature. Banker (1984) shows that the CCR model can be employed to test for DMUs' RTS using the concept of most productive scale size (MPSS), i.e. the sum of the CCR optimal lambda values can determine the RTS classification. This method is called the CCR RTS method. Banker et al. (1984) report that a new free BCC dual variable ( ) estimates RTS by allowing variable returns to scale (VRS) for the CCR model, i.e. the sign of determines the RTS. We call this method the BCC RTS method. Finally, Färe et al. (1985) provide the scale efficiency index method for the determination of RTS using DEA. These three RTS methods, in fact, are equivalent but different presentations (Banker et al., 1996; Färe et al., 1994; Zhu et al., 1995).
o
u
o
u
The three basic RTS methods have been widely employed in real world situations (Byrnes et al., 1984; Charnes et al., 1989; Zhu, 1996a). However, it has been noted that the CCR and BCC RTS methods may fail when DEA models have alternate optima, i.e. the original CCR and BCC RTS methods assume unique optimal solutions to the DEA formulations. In contrast to the CCR and BCC RTS methods, the scale efficiency index method does not require information on the primal and dual variables and, in particular, is robust even when there exist multiple optima. Since it may be impossible or at least unreasonable to generate all possible multiple optima in many real world applications, a number of modifications or extensions of the original CCR and BCC methods have been developed to deal with multiple optima.
Banker and Thrall (1992) generalize the BCC RTS method by exploring all alternate optima in the BCC dual model, i.e. RTS in their extended technique is measured by intervals for uo. Banker et al. (1995) further modified the technique to avoid the need for examining
all alternate optima. Using the same technique, Banker et al. (1996) introduce a modification to the CCR RTS method by determining the maximum and minimum values of
1
n j j= λ
∑
in the CCR model in order to reach a decision. On the other hand, by the scale efficiency index method, Zhu and Shen (1995) suggest a remedy for the CCR RTS method under possible multiple optima.According to the recent result of Zhu and Shen (1995), one can easily estimate the returns to scale (RTS) by the CCR and BCC scores and
∑
nj=1λj in any optimal solution to the CCR model without exploring all possible multiple optimal solutions. That is, if CCR score is equal to the BCC score, then CRS (constant return to scale) prevails; otherwise, if the CCR and BCC scores are not equal, then1 1
n j j= λ <
∑
indicates IRS (increasing returns to scale) and indicates DRS (decreasing returns to scale).1 1 n j j=λ >
∑
3.2.6 Context-Dependent DEA 1. Stratification DEA MethodThe context-dependent DEA (Seiford and Zhu, 2003) is introduced as follows. Let
{
}
1
, 1, , j
J = DMU j = … n (the set of all ) and interactively define where n DMUs Jl+1 = Jl − l E
( )
{
,}
l l kE = DMU ∈J φ l k , and φ
( )
l k, is the optimal value to the following LP when DMUk is under evaluation.( )
( )
( )
( ) ( )( )
( )
, , , . . , , , , , 0; , j l l l k j ij ik j F J j rj rk j F J l j Min l k s t x l k x y y l k i and r j F J λ φ φ λ φ λ φ λ ∈ ∈ ≤ ≥ ≥ ∀ ∈∑
∑
,)
(8)Where j∈F J
(
l means DMUj∈Jl, i.e., F( )
. represents the correspondence from a set to the corresponding subscript index set. WhenDMU l =1, Eq.(8) becomes the
original input-oriented CCR model, Eq.(1), and consists of all the frontier . These in set define the first-level best-practice frontier. When , Eq. (8) gives the second-level best-practice frontier after the exclusion of the first-level frontier . And so on. In this manner, we identify several levels of best-practice frontiers. We call the best practice frontier. The following algorithm accomplishes the identification of these best-practice frontiers by Eq.(8).
1 E DMUs DMUs E1 l=2 DMUs l E lth-level
y Step 1: Setl =1. Evaluate the entire set of , , by Eq.(8) to obtain the first-level frontier , set ( the first-level best-practice frontier).
DMUs J1
DMUs E1
y Step 2: Exclude the frontier from future DEA runs. . (If then stop).
DMUs Jl+1 = Jl −El
1
l
J + = ∅
y Step 3: Evaluate the new subset of ‘inefficient’DMUs,Jl+1, by Eq.(8) to obtain a new set of efficient DMUs El+1 (the new best-practice frontier).
y Step 4: Letl = +l 1. Go to step2.
2. Attractiveness Measure
Now, based upon these evaluation contexts l (
E l =1,…,L−1), we can obtain the relative attractiveness measure by the following LP:
( )
( )( )
( )
( ) ( )( )
(
)
* , , 1, , , . . , 1, , , , 1, , , , 0; , , j q lod lod o q q H d j ij q iq j F E j rj rq j F E l d q j H d Min H d d L l s t x H d x i m y y r s H d i and r j F E λ λ λ λ + + ∈ ∈ + = = ≤ = ≥ = ≥ ∀ ∈∑
∑
… … … o −)
q (9)where DMUq =
(
xiq,yr is from a specific level Elo,{
1, , 1}
ol ∈ … L− . In Eq.(4), each best-practice frontier of represents an evaluation context for measuring the relative attractiveness of in . The larger the value of , the more attractive the is. Because this makes itself more distinctive from the evaluation context . We are able to rank the in based upon their attractiveness scores and identify the best one.
o l d E + DMUs Elo *( ) q H d q DMU DMUq o l d E + DMUs Elo 3. Progress Measure
To obtain the progress measure for specificDMUq =
(
xiq,yrq)
∈Elo, lo∈{
2,...,L}
, we use the following LP:( )
( )( )
( )
( ) ( )( )
(
)
* , , 1, , 1, . . , 1, , , , 1, , , , 0; , . j q log log o q q G g j ij q iq j F E j rj rq j F E l g q j G g Min G g g l s t x G g x i m y y r s G g i and r j F E λ λ λ λ − − ∈ ∈ − = = ≤ = ≥ = ≥ ∀ ∈∑
∑
… … … o− (10)Each efficient frontier, , contains a possible target for a specific in to improve its performance. The progress measure here is a level-by level improvement. For a larger o l g E − DMU Elo
( )
*1 Gq g , more progress is expected for DMUq. Thus, a smaller value of
( )
*Chapter 4. Empirical Results and Analysis
4.1. Performance of the GWSM Retail Stores
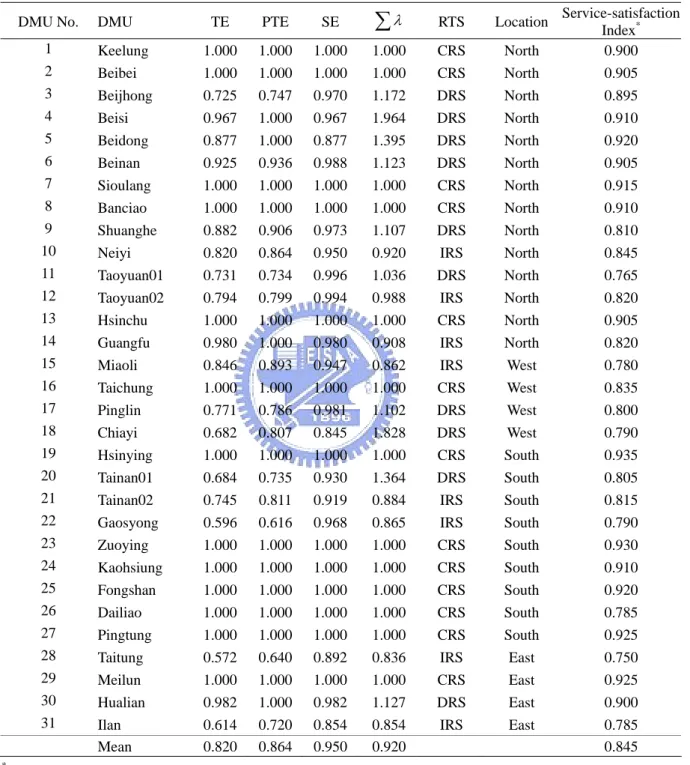
An input-orientated DEA model is chosen to calculate the overall technical efficiency scores for 31 retail stores because the objective of the GWSM is to provide fine effective service with least input resources to soldiers , reservists, veterans, and their dependents. The technical efficiency (TE, Mean=0.820) is decomposed into pure technical efficiency (PTE, Mean=0.864) and scale efficiency (SE, Mean=0.950), and the nature of returns to scale (RTS) is reproduced in Table 4. The result reveals that the overall technical inefficiencies of the GWSM retail stores are primarily due to the pure technical inefficiencies rather than the scale inefficiencies, because mean of SE equal 0.95 close to 1. It is mean that SE has a little tolerance to improve non the less mean of PTE only equal 0.864 has a lot tolerance to improve. This also suggests that managers should focus firstly on removing the technical inefficiency of retail stores, and then retail stores can be subject to improving their scale efficiencies.
As regards to the pure technical efficiency (PTE), it is found that, on average, retail stores can produce the same level of measured output with 13.60% less inputs, holding the current input ratios constant. Using a t-test, we reject the null hypothesis that the sample mean is one at the 5% level of significance. Approximately 45.16% of retail stores need to reduce their inputs if they are to become efficient. The rest of the retail stores are regarded as efficient. This indicates that overall retail stores still have room for improving their pure technical efficiencies.
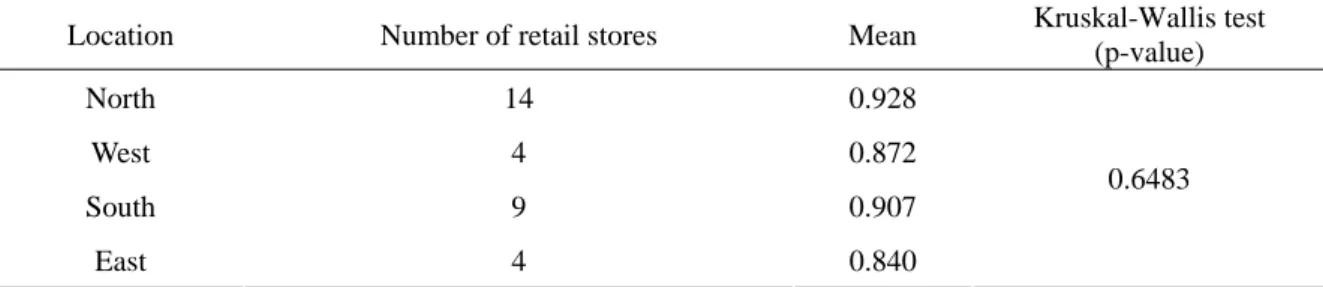
We further investigate the relationship between efficient score and region of retail stores. There are four regions for the GWSM retail stores: North, West, South, and East. To
determine whether differences exist in region characteristic, a non-parametric statistical analysis (Kruskal-Wallis test) is used (Brockett et al., 1996) for unknown distribution scores. A non-parametric statistical analysis is presented in Table 5. Table 5 reveals that those retail stores located on north region perform better on average than the other three regions in pure technical efficiency. The findings show that retail stores located on north region are more competitive and they should provide examples of operating practice. Using a Kruskal-Wallis test shows no significant difference in pure technical efficiency at the 5 percent level for the four regions.
The scale efficiency is defined by the ratio of a TE score to a PTE score. If the ratio is equal to one, then a retail store is scale efficient; otherwise, if the ratio is less than one, then a retail store is scale inefficient. This t-test indicates that the scale efficiency ratios are significantly less than one, which means that serious scale inefficiencies occur in these 31 retail stores. This is evidence showing that a scale problem really does exist in the GWSM retail stores, which can be treated as support for future mergers and acquisitions between retail stores.
This study further investigates the status of returns to scale for retail stores. From Table 4 we observe that the average scale efficiency of 0.950 suggests further potential input savings of 5% if it is possible for a retail store to operate at the constant returns to scale technology. Approximately 41.5% of the retail stores are constant returns to scale (CRS). There are nearly 32.3% of the retail stores that operate at decreasing returns to scale (DRS). The DRS retail stores represent stores need to be reduced in size and become efficient stores. On the other hand, about one-third of the retail stores operate at increasing returns to scale (IRS). The IRS stores in the latter group could be consolidated with other small units to achieve the optimal size. However, an across-the-board policy for downsizing these retail stores is not recommended because those retail stores are on different resource basis and
location. It is more appropriate to consider the retail stores on a case-by-case basis before any restructuring policy is implemented.
Table 4. Efficiency scores of the 31GWSM retail stores
DMU No. DMU TE PTE SE
∑
λ RTS Location Service-satisfaction Index* 1 Keelung 1.000 1.000 1.000 1.000 CRS North 0.900 2 Beibei 1.000 1.000 1.000 1.000 CRS North 0.905 3 Beijhong 0.725 0.747 0.970 1.172 DRS North 0.895 4 Beisi 0.967 1.000 0.967 1.964 DRS North 0.910 5 Beidong 0.877 1.000 0.877 1.395 DRS North 0.920 6 Beinan 0.925 0.936 0.988 1.123 DRS North 0.905 7 Sioulang 1.000 1.000 1.000 1.000 CRS North 0.915 8 Banciao 1.000 1.000 1.000 1.000 CRS North 0.910 9 Shuanghe 0.882 0.906 0.973 1.107 DRS North 0.810 10 Neiyi 0.820 0.864 0.950 0.920 IRS North 0.845 11 Taoyuan01 0.731 0.734 0.996 1.036 DRS North 0.765 12 Taoyuan02 0.794 0.799 0.994 0.988 IRS North 0.820 13 Hsinchu 1.000 1.000 1.000 1.000 CRS North 0.905 14 Guangfu 0.980 1.000 0.980 0.908 IRS North 0.820 15 Miaoli 0.846 0.893 0.947 0.862 IRS West 0.780 16 Taichung 1.000 1.000 1.000 1.000 CRS West 0.835 17 Pinglin 0.771 0.786 0.981 1.102 DRS West 0.800 18 Chiayi 0.682 0.807 0.845 1.828 DRS West 0.790 19 Hsinying 1.000 1.000 1.000 1.000 CRS South 0.935 20 Tainan01 0.684 0.735 0.930 1.364 DRS South 0.805 21 Tainan02 0.745 0.811 0.919 0.884 IRS South 0.815 22 Gaosyong 0.596 0.616 0.968 0.865 IRS South 0.790 23 Zuoying 1.000 1.000 1.000 1.000 CRS South 0.930 24 Kaohsiung 1.000 1.000 1.000 1.000 CRS South 0.910 25 Fongshan 1.000 1.000 1.000 1.000 CRS South 0.920 26 Dailiao 1.000 1.000 1.000 1.000 CRS South 0.785 27 Pingtung 1.000 1.000 1.000 1.000 CRS South 0.925 28 Taitung 0.572 0.640 0.892 0.836 IRS East 0.750 29 Meilun 1.000 1.000 1.000 1.000 CRS East 0.925 30 Hualian 0.982 1.000 0.982 1.127 DRS East 0.90031 Ilan 0.614 0.720 0.854 0.854 IRS East 0.785 Mean 0.820 0.864 0.950 0.920 0.845
*
Service-satisfaction index = (Customer-satisfaction index + Facilities-satisfaction index)/2
Table 5. Non-parametric statistical analysis of location for the 31 GWSM retail stores
Location Number of retail stores Mean Kruskal-Wallis test (p-value) North 14 0.928 West 4 0.872 South 9 0.907 East 4 0.840 0.6483
4.2. Analysis of managerial decision-making matrix
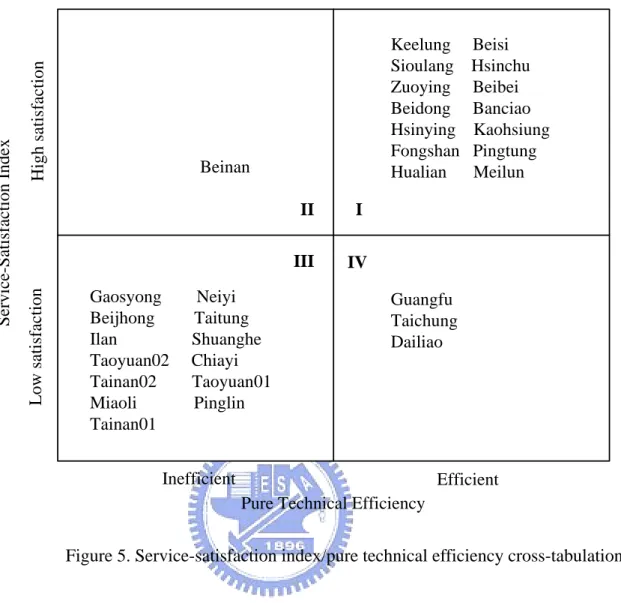
By combining the results of pure technical efficiency and service-satisfaction index, we design a decision-making matrix to identify the position of the 31 retail stores, which help the managers and/or authorities to improve their operating efficiencies. A pure technical efficiency/ satisfaction index matrix of retail store is presented in Fig. 5. All retail stores fall into four zones: I, II, III, and IV. Each retail store is classified into a zone by examining (1) whether the pure technical efficiency is equal to or less than 1, (2) whether the satisfaction index is greater than or smaller than 0.9. This matrix can act as a managerial decision-making matrix for further improving efforts that is contributive to managers. Retail stores located in the four zones are described below.
Zone I: Those retail stores enjoy high level in both pure technical efficiency and satisfaction index dimensions. Fourteen retail stores are included here: Keelung, Beisi, Sioulang, Hsinchu, Zuoying, Beibei, Beidong, Banciao, Hsinying, Kaohsiung, Meilun, Fongshan, Pingtung, and Hualian retail stores. These retail stores appear to be good role model, which can be treated as benchmarks to others. The findings also show that the retail stores located on Zone I have better competitive advantage than the other ones.
technical efficiency. Beinan retail store is included. It is suggested that Beinan should place more emphasis on activities of improving operating efficiency.
Zone III: Those retail stores which perform inferior both in satisfaction-index and pure technical efficiency. Thirteen retail stores, Gaosyong, Neiyi, Taitung, Ilan, Shuanghe, Taoyuan02, Chiayi, Tainan02, Taoyuan01, Miaoli, Pinglin, Beijhong, and Tainan01 retail stores, are classified here. This suggests that managers should focus firstly on improving the service quality of retail stores, and then retail stores can be subject to improving operating efficiency.
Zone IV: Those retail stores which have high pure technical efficiency, but low satisfaction-index. Three retail stores are included here: Guangfu, Taichung, and Dailiao retail stores. It is suggested that these retail stores should place more emphasis on activities of improving the service quality of retail stores.
Looking at all the retail stores the correlation coefficient between pure technical efficiency and satisfaction index is 0.737 which is significant at the 5% level. Thus there is significant association between pure technical efficiency and service-satisfaction index, indicating a strong tendency for relatively high satisfaction index to go with good pure technical efficiency. This indicates that the customer/facilities satisfaction levels do have a very significant influence upon retail store’s performance. Therefore, managers should expect to spend most of their efforts in this area for inefficient retail stores.
Keelung Beisi Sioulang Hsinchu Zuoying Beibei Beidong Banciao Hsinying Kaohsiung Fongshan Pingtung Hualian Meilun Beinan Guangfu Taichung Dailiao Gaosyong Neiyi Beijhong Taitung Ilan Shuanghe Taoyuan02 Chiayi Tainan02 Taoyuan01 Miaoli Pinglin Tainan01 I II III IV Efficient Inefficient Hi gh sat isfaction Lo w sat isfactio n
Pure Technical Efficiency
Se rv ice-Satisfaction Ind e x
Figure 5. Service-satisfaction index/pure technical efficiency cross-tabulation
4.3. Constructing a Benchmark-Learning Roadmap
After identifying the efficient , the role it plays in being benchmarked by other inefficient is also important. Previously, various efforts have been devoted to develop methods without priority information to identify the benchmark in DEA. One way to accomplish such a task is to count the number of times a particular efficient DMU acts as a reference DMU (Smith and Mayston, 1987). Andersen and Petersen (1993) presented the procedure referred to as the super-efficiency CCR model for ranking efficient units. Their basic idea is to compare the under evaluation with all other in the sample, i.e., the itself is excluded. Seiford and Zhu (1999) offered a super-efficiency BCC
DMU DMUs
DMU DMUs
model in which increasing, constant, and decreasing returns to scale are allowed. The model is based on a reference technology constructed from all other DMUs. Li and Reeves (1999) proposed a multiple criteria approach that is called Multiple Criteria DEA, which focuses on solving two key problems: a lack of discrimination and inappropriate weighting schemes. To identify the inputs/outputs that are most important or to distinguish those efficient
which can be treated as benchmarks, the reference-share measure (Zhu 2000) is defined as a ranking measure by combining the factor-specific measure and BCC model. Tone (2002) wrote a super-efficiency model using the slacks-based measure of efficiency. The detail description for above methodologies can check in appendix A. To summarize the above previous studies, the benchmarks derived from the proposed methods above can possibly become unimitable or unattainable goals for the inefficient immediately. A series of step-by-step benchmarks (or called ‘a benchmark-learning roadmap’) for an inefficient retail store to learn and gradually improve its operating efficiency seems to be more realistic and reasonable.
DMUs
DMUs
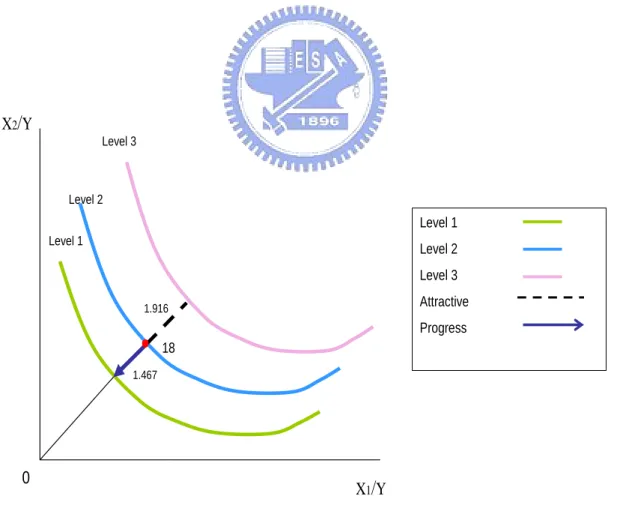
In this section the context-dependent DEA, by incorporating stratification DEA, attractiveness measure, and progress measure, can draw the GWSM retail stores’ benchmark-learning roadmap to improve the inefficient retail stores progressively and can identify the best retail store. By using stratification DEA model, Eq. (3), we can get the first-level best-practice frontier when l=1. When l=2, Eq. (3) gives the second-level best-practice frontier. Then, the third-level frontier when l=3, and so on. Before continued to explain, it needs to make a definition for attractive and progress. Progress meaning the second level or third level needs to catch up the first or second level learning curve distance, in another word, it real means is falling behind degree from level two or three to level one. Attractive meaning the first level which takes the lead level two or level three degree, that is to say, level two or level three needs do their efforts to come up with level one or level three needs to improve it’s performance to catch up with level two’s performance. (as in Figure 6)
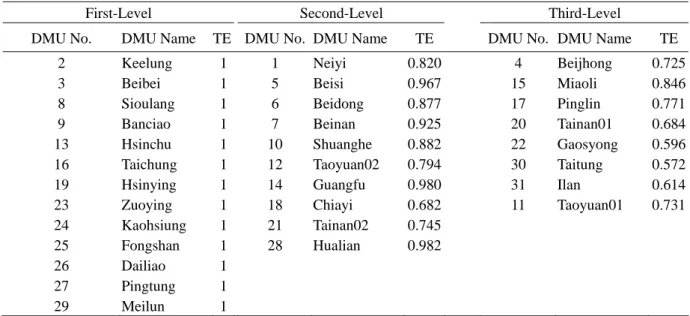
In this research, the three levels of efficient frontiers are reported in Table 6. According to Morita, Hirokawa, and Zhu (2005), the benchmark targets of the inefficient retail stores on level 3 should take retail stores on level 2 as initial targets to improve efficiency in the first stage. In the second stage, after retail stores on level 3 achieve the second-level efficient frontier, these on level 3 can use the first-level efficient frontier as secondary benchmarks for improvement and so on to proceed stage by stage. We call this composition of learning tracks for retail stores in different levels as a ‘benchmark-learning roadmap.’ Note that as pointed out in Chen, Morita, and Zhu (2005), the levels obtained using Eq. (3) do not necessarily follow the order of the TE scores. For instance, five retail stores (Beijhong, Miaoli, Pinglin, Tainan01, and Taoyuan01) on the third-level have a larger TE score than does Chiayi on the second-level.
Level 1 Level 2 Level 3 Attractive Progress 0
‧
18 Level 3 Level 2 Level 1 X2/
Y X1/
Y 1.916 1.467Table 6. Levels of efficient frontiers
First-Level Second-Level Third-Level DMU No. DMU Name TE DMU No. DMU Name TE DMU No. DMU Name TE
2 Keelung 1 1 Neiyi 0.820 4 Beijhong 0.725 3 Beibei 1 5 Beisi 0.967 15 Miaoli 0.846 8 Sioulang 1 6 Beidong 0.877 17 Pinglin 0.771 9 Banciao 1 7 Beinan 0.925 20 Tainan01 0.684 13 Hsinchu 1 10 Shuanghe 0.882 22 Gaosyong 0.596 16 Taichung 1 12 Taoyuan02 0.794 30 Taitung 0.572 19 Hsinying 1 14 Guangfu 0.980 31 Ilan 0.614 23 Zuoying 1 18 Chiayi 0.682 11 Taoyuan01 0.731 24 Kaohsiung 1 21 Tainan02 0.745
25 Fongshan 1 28 Hualian 0.982 26 Dailiao 1
27 Pingtung 1 29 Meilun 1
We now turn to the attractiveness measure and the progress measure (Eqs. 4 and 5) of the 31 retail stores when different efficient frontiers are chosen as evaluation contexts.
Table 7 gives the results. The number of the right of each score indicates the ranking position by the attractiveness measure and progress measure ((1) represent the top-rank position). As regards to the attractiveness measure, when the second-level is chosen as the evaluation context, Hsinying in first-level is the best retail store because it has the largest attractiveness score of 5.196. The retail stores in first-level can be ranked by using attractiveness measure in the order of Hsinying Meilun, Dailiao, Hsinchu, Keelung, Taichung, Pingtung, Kaohsiung, Beibei, Zuoying, Fongshan, Sioulang, and Banciao retail stores. Results also show that 11 out of the 13 retail stores on the first level are located on the north and south regions, indicating that retail stores located on north and south regions are more competitive. When the third-level is chosen as the evaluation context, Hsinying is still the best retail store, as followed by Meilun retail store. The findings show that Hsinying retail
store is the most attractive retail store, i.e. global leader, no matter which evaluation context is chosen.
As regards to the progress measurement, when the first-level is chosen as the evaluation context, Taitung retail store is the worst retail store in the third-level because it has the largest progress score of 1.750. The retail stores in third-level can be ranked by using progress measure. When the second-level is chosen as the evaluation context, Taitung is still the worst retail store in the third-level. The findings show that Taitung retail store is the worst retail store, no matter which evaluation context is chosen. Note that the ranking position is change for Dailiao, Hsinchu, Keelung, Taichung, Pingtung, Kaohsiung, Beibei, Zuoying, Fongshan, Sioulang, and Banciao retail stores in first-level when evaluation context is changed. This demonstrates that the performance of retail stores can be dependent on the evaluation background (Zhu, 2003).
Table 7. Attractive and progress scores for the retail stores in different evaluation context
Evaluation Context Evaluation Context Evaluation Context
Second-Level Third-Level First-Level Third-Level First-Level Second-Level
First-Level DMU 1st-Degreea 2nd-Degreea Second-Level DMU 1st-Degreeb 1st-Degreea Third-Level DMU 1st-Degreeb 2nd-Degreeb
Keelung 1.626 (5) 2.244 (9) Neiyi 1.219 (7) 1.834 (6) Beijhong 1.379 (4) 1.169 (3) Beibei 1.437 (9) 2.122 (11) Beisi 1.034 (3) 2.024 (2) Miaoli 1.182 (1) 1.092 (1) Sioulang 1.306 (12) 2.143 (10) Beidong 1.140 (6) 1.911 (5) Pinglin 1.297 (2) 1.163 (2) Banciao 1.147 (13) 2.712 (6) Beinan 1.081 (4) 1.411 (10) Tainan01 1.463 (5) 1.203 (5) Hsinchu 1.917 (4) 2.632 (7) Shuanghe 1.134 (5) 2.521 (1) Gaosyong 1.678 (7) 1.227 (6) Taichung 1.593 (6) 3.633 (3) Taoyuan02 1.260 (8) 1.565 (8) Taitung 1.750 (8) 1.325 (8)
Hsinying 5.196 (1) 7.412 (1) Guangfu 1.020 (2) 1.932 (3) Ilan 1.628 (6) 1.187 (4) Zuoying 1.399 (10) 1.840 (12) Chiayi 1.467 (10) 1.916 (4) Taoyuan01 1.367 (3) 1.278 (7) Kaohsiung 1.470 (8) 3.355 (4) Tainan02 1.341 (9) 1.640 (7) Fongshan 1.343 (11) 1.633 (13) Hualian 1.019 (1) 1.545 (9) Dailiao 2.234 (3) 2.739 (5) Pingtung 1.585 (7) 2.279 (8) Meilun 3.202 (2) 4.525 (2) Note:
1. aThis represents attractive. 2. bThis represents progress.
3. First level is the best performance then the second level, the third level represents the worst performance. 4. Ranks are given in parenthesis.
According to Seiford and Zhu (2003), for retail stores that are not located on the first or last level of efficient frontier, we can characterize their performance by their attractiveness and progress scores. Each retail store in the second-level is classified into a zone by examining (1) whether the attractiveness score is greater than or less than 1.80, (2) whether the progresses score is greater than or smaller than 1.25. In Figure 7 the attractiveness and progress scores give a two-by-two matrix to classify the retail stores in the second-level. A good performer shows high attractiveness and low progress and, a wrong performer shows low attractiveness and high progress. A high progress indicates that the retail store needs to improve its outputs substantially, and a high attractive indicates that the retail store have better competitive advantage than the other ones. Retail stores have been split subjectively into four groups plotted respectively in the zones of LH, HH, HL, and LL. The retail stores in each group are summarized as follows.
Zone LH: Those retail stores enjoy low progress and high attractiveness scores. Five retail stores are included here: Neiyi, Beisi, Beidong, Shuanghe, and Guangfu retail stores. The findings show that the retail stores located on Zone LH have better competitive advantage than the other ones in the second-level.
Zone HH: The retail store experiences a higher progress and attractiveness scores. Chiayi retail store is included. It is suggested that Chiayi retail store should place more emphasis on activities of improving its outputs substantially.