國 立 交 通 大 學
材料科學與工程學系
博 士 論 文
氧化鋯含量對莫來石/氧化鋯複合材料氧擴散與
導電性之影響
Effect of Zirconia Content on Oxygen Diffusivities and
Electrical Conductivities in Mullite/Zirconia Composites
研 究 生:柯宏達
指導教授:林健正 教授
氧化鋯含量對莫來石/氧化鋯複合材料氧擴散與導電
性之影響
Effect of Zirconia Content on Oxygen Diffusivities and Electrical Conductivities in Mullite/Zirconia Composites
研 究 生:柯宏達 Student:Hong-Da Ko 指導教授:林健正 Advisor:Chien-Cheng Lin 國 立 交 通 大 學 材 料 科 學 與 工 程 學 系 博 士 論 文 A Thesis
Submitted to Department of Materials Science and Engineering National Chiao Tung University
in partial Fulfillment of the Requirements for the Degree of
Doctor of Philosophy In
Materials Science and Engineering September 2009
Hsinchu, Taiwan, Republic of China
中華民國九十八年九月
氧化鋯含量對莫來石/氧化鋯複合材料氧擴散與導電性之影響
研 究 生:柯宏達 指導教授:林健正 國 立 交 通 大 學 材 料 科 學 與 工 程 學 系摘 要
本研究利用三種不同方法測量莫來石/氧化鋯複合材料之氧擴散與電 導。經由 18O-16O 同位素交換反應並利用二次離子質譜儀(SIMS)可測得 莫來石/氧化鋯複合材料的氧擴散係數;使用交流阻抗(AC impedance)量 測莫來石/氧化鋯複合材料的電導;在氧分壓 20.2 到 2.02 kPa 範圍內, 利用電導鬆弛法(conductivity relaxation method)可得到多孔莫來石/氧化 鋯複合材料的氧擴散係數及表面交換係數。 同位素交換反應研究顯示,在溫度從1000°C 到 1350°C 之間,氧化鋯含 量 0 vol%~80 vol%之莫來石/氧化鋯複合材料其氧擴散係數為 10-21~ 10-10 m2/s。在氧化鋯含量 30 vol%與 40 vol%之間,氧擴散係數有著極大 的變化。由於在高氧化鋯含量複合材料中氧化鋯相互連結形成一個快速 路徑,而氧離子可經由此路徑移動。因此高氧化鋯含量複合材有較高的 氧擴散係數。氧擴散之活化能隨著氧化鋯含量增加而有降低的趨勢。在莫來石/氧化鋯複合材料的電導研究中,純氧化鋯與莫來石/氧化鋯複 合材料的阻抗圖譜皆顯示兩個半圓,而此兩半圓分別是由材料中的晶粒 及晶界所貢獻。純莫來石陶瓷的阻抗圖譜顯示一個半圓,而此半圓是由 莫來石之晶粒所貢獻。莫來石/氧化鋯複合材料的電導隨著氧化鋯含量增 加而增加。在交流頻率 1 MHz 測量下的導電度符合 Lichtenecker’s rule 的預測,而在交流頻率1 kHz 測量下的導電度則符合混合方程式(general mixing equation)。 在多孔莫來石/氧化鋯複合材料的研究中,高氧化鋯含量複合材料的表面 交換係數趨近一常數。而低氧化鋯含量複合材的氧擴散與表面交換係數 則隨著氧化鋯含量增加而增加。多孔莫來石/氧化鋯複合材料的表面交換 係數存在一臨界體積分率在氧化鋯含量約40 vol%左右。研究結果顯示 低氧化鋯含量複合材的氧擴散係數與氧分壓無關,此是因為材料的氧擴 散與其氧空孔息息相關,但氧空孔濃度不隨著氧分壓而變動。另外,高 氧化鋯含量複合材料的表面交換係數則隨著氧分壓增加而減少。最後, 經推測氧表面交換反應的速率決定步驟(rate-limiting step)應為電荷轉移 過程(charge-transfer process)。
Effect of Zirconia Content on Oxygen Diffusivities and
Electrical Conductivities in Mullite/Zirconia Composites
Hong-Da Ko, Ph. D.
Department of Materials Science and Engineering,
National Chiao Tung University, Hsinchu, Taiwan
Prof. Chien-Cheng Lin, Advisor
Abstract
Oxygen diffusivities and electrical conductivities in various mullite/PSZ composites were measured by 18O/16O isotope exchange method using secondary ion mass spectrometry and AC impedance spectroscopy, respectively. Additionally, oxygen diffusivities and surface exchange coefficients in various porous mullite/PSZ composites were measured at oxygen partial pressures ranging from 20.2 to 2.02 kPa using the conductivity relaxation method.
Oxygen diffusivities in mullite/PSZ composites exhibited a wide range of values from 10-21 to 10-10 m2/s at temperatures between 1000 and 1350°C in the composites with 0 to 80 vol% PSZ. The percolation threshold occurred between 30 and 40 vol% PSZ, where oxygen diffusivities dramatically changed. There was a clear tendency of the activation energies of oxygen diffusion in composites to decrease with increasing PSZ contents. The large oxygen diffusivities in the high-PSZ composites were attributed to the interconnected channels of PSZ from the microstructural aspect.
For the measurement of electrical conductivities in mullite/PSZ composites, the impedance spectra of monolithic PSZ and mullite/PSZ composites showed two semicircles because of the contributions from grains and grain boundaries, while those of monolithic mullite had one semicircle due to the predominant contribution from grains. This indicates that the conductivities of the mullite/PSZ composites increased with PSZ content. While the conductivities of various composites at 1 MHz were fitted by Lichtenecker’s rule, the general mixing equation could be applied to the conductivities measured at 1 kHz.
For the measurement of oxygen diffusivities and surface exchange coefficients in porous mullite/PSZ composites, oxygen diffusivities and surface exchange coefficients in low-PSZ composites increased with PSZ content, while the surface exchange coefficients in high-PSZ composites were approximately constant. A percolation threshold of the surface exchange coefficients took place at ~40 vol% PSZ for porous mullite/PSZ composites. The oxygen diffusivities in porous low-PSZ composites were independent of the oxygen partial pressure, implying that oxygen diffusion in these composites was related to the migration of oxygen vacancies, of which the concentration was independent of the oxygen partial pressure. The surface exchange coefficients of high-PSZ composites decreased with increasing oxygen partial pressure. Finally, it was found that the rate-limiting step for oxygen surface exchange could be the charge-transfer process.
誌 謝
博士研究生涯中,首先要感謝指導教授林健正老師,在實驗上給予許多 教導與建議,讓學生了解研究該有的態度與想法,並令學生能完成博士 學位。並由衷感謝所有口試委員們在論文的指正與建議。 感謝工研院材料研究所邱國創先生在研究材料電導性上的指導以及儀 器上的協助。感謝所有畢業與在學的實驗室夥伴們,因為有了你們研究 生活才會多采多姿。感謝璞玉計畫小組所有小姐們,你們的加油打氣, 讓我備感窩心,也預祝璞玉計畫順利執行成功。 最後感謝我的家人與好友們,不管是生活或是精神上一直支持我,讓我 的生活不虞匱乏。在大家的鼓勵與幫助下,終於完成了論文,在此獻給 所有關心我及我所關心的朋友們!Contents
Chapter 1
Introduction... 1
1.1 Mullite and Zirconia ... 1
1.2 Mullite/Zirconia Composites ... 2
1.3 Thesis Outline ... 3
Chapter 2 Oxygen Diffusivities in Mullite/Zirconia Composites Measured by 18 O/16O Isotope Exchange and Secondary Ion Mass Spectrometry ... 5
2.1 Introduction... 5
2.2 Experimental Procedures ... 6
2.3 Results and Discussion ... 8
2.3.1 Measured Oxygen Concentration Profiles ... 8
2.3.2 Oxygen Diffusivities versus PSZ Contents... 10
2.3.3 Activation Energies versus PSZ Contents ... 13
2.3.4 Microstructural Characteristics ... 13
2.4 Conclusion ... 14
Chapter 3 Effect of Zirconia Content on Electrical Conductivities of Mullite/Zirconia Composites Measured by Impedance Spectroscopy .. 22
3.1 Introduction... 22
3.2 Experimental Procedures ... 23
3.3 Results and Discussion ... 25
3.3.1 Analyses of Impedance Spectra ... 25
3.3.2 Conductivities and Activation Energies... 28
3.3.3 Conductivity versus PSZ Content ... 31
3.3.4 Microstructural View of Point... 33
3.4 Conclusion ... 34
Chapter 4 Oxygen Diffusivities and Surface Exchange Coefficients in Porous Mullite/Zirconia Composites Measured by the Conductivity Relaxation Method ... 44
4.1 Introduction... 44
4.2 Experimental Procedures ... 45
4.3 Mathematical Background... 47
4.4.1 Conductivities ... 50
4.4.2 Diffusivities and Surface Exchange Coefficients ... 52
4.4.3 Effects of PSZ content... 55
4.4.4 Effect of Oxygen Partial Pressure... 56
4.4.5 Rate-Determining Mechanisms of Oxygen Surface Exchange 57 4.5 Conclusion ... 61
Chapter 5 Summary... 72
Reference... 76
List of Tables
Table 2.1 Designations, compositions, hot-pressing conditions, and relative densities of various mullite/PSZ composites... 16 Table 2.2 Measured oxygen diffusivities (D), surface exchange coefficients (α), and characteristic time constants (τ) in various composites ... 17 Table 2.3 Pre-exponential constants (D0) and activation energies (Q) in
various composites... 18 Table 3.1 Designations, compositions, hot pressing conditions, relative densities, and x-ray phases of various mullite/PSZ composites... 36 Table 4.1 Designations, compositions, sintering conditions, and relative densities of various mullite/PSZ composites... 63 Table 4.2 Ionic transport numbers of mullite/PSZ composites at various temperatures... 63 Table 4.3 Oxygen diffusivities and surface exchange coefficients of low-PSZ composites at various temperatures and oxygen partial pressures 64 Table 4.4 Oxygen surface exchange coefficients of high-PSZ composites at various temperatures and oxygen partial pressures ... 65
List of Figures
Fig. 2.1 The concentration profiles of oxygen isotope 18O after annealing at
1000°C/5 h for (a) mullite, MZY05, MZY15, MZY20, and MZY30; (b) MZY40 and MZY80... 19 Fig. 2.2 The relationships of oxygen diffusivity and PSZ content after
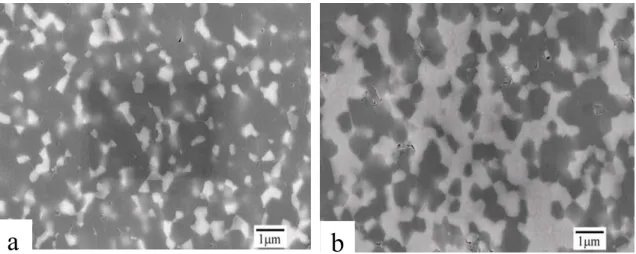
annealing at 1350°C/2 h, 1200°C/3 h and 1000°C/5 h, respectively. ... 20 Fig. 2.3 Arrhenius plots of oxygen diffusivities in the composites with various PSZ contents... 20 Fig. 2.4 Secondary electron images of the as hot-pressed (a) MZY15 and (b)
MZY40. The bright phase is PSZ, while the dark phase is mullite. (Thermal etching at 1300ºC/1 h)... 21 Fig. 3.1 Impedance-measuring system. ... 37 Fig. 3.2 Typical impedance spectra. (a) For MZY10 at temperatures
ranging from 400 to 1000oC; (b) For MZY80 at temperatures
ranging from 200 to 450oC. The enlarged views at low
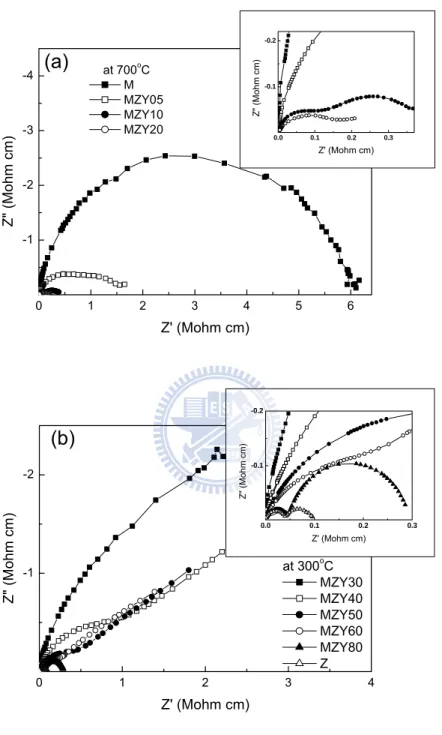
impedances are shown in the inset. ... 38 Fig. 3.3 Impedance spectra of the composites with various PSZ contents: (a)
M, MZY05, MZY10 and MZY20 at 700oC; (b) MZY30, MZY40,
MZY50, MZY60, MZY80 and Z at 300oC. The enlarged views at low impedances are shown in the inset. ... 39 Fig. 3.4 Arrhenius plots of conductivities determined (a) in the
high-frequency region; (b) in the low-frequency region of impedance spectra. ... 40 Fig. 3.5 The activation energy versus PSZ content curves of mullite/PSZ composites in the high-frequency and low-frequency regions, respectively, of the impedance spectra... 41
Fig. 3.6 The real part of conductivity versus PSZ content curve at the frequencies of (a) 1 MHz and (b) 1 KHz at 600oC. The fitting lines in (a) and (b) were determined by Lichtenecker’s rule and the general mixing equation, respectively... 42 Fig. 3.7 Scanning electron micrographs of mullite/PSZ composites: (a)
MZY05; (b) MZY30; (c) MZY80. The dark phase is mullite and the bright phase is PSZ... 43 Fig. 4.1 Schematic diagram of the conductivity-measuring system... 66
Fig. 4.2 Electrical resistance as a function of time for MZY80 at 750oC
when the oxygen partial pressure was changed stepwise from 6.07 to 2.02 kPa... 66 Fig. 4.3 Conductivity vs. oxygen partial pressure curves for (a) mullite at
1100oC and low-PSZ composites at 1000oC; (b) high-PSZ composites at 800oC. ... 67 Fig. 4.4 Plots of the normalized conductivity g(t) versus time for (a) M and
MZY05 at 1100oC; (b) MZY10, MZY20, and MZY30 at 1000oC; (c) MZY40, MZY50, MZY60, MZY80 and Z at 750oC with the oxygen partial pressure switched from 6.07 to 2.02 kPa . The fitting lines in (a) and (b) were based on Eqn. (4.1), and those in (c) were based on Eqn. (4.7)... 68 Fig. 4.5 The plot of the activation energy versus PSZ content in
mullite/PSZ composites for (a) diffusion coefficients and (b) surface exchange coefficients... 69 Fig. 4.6 The relationship between surface exchange coefficient and PSZ content at 800oC. The data of low-PSZ composites with error bars were obtained from the extrapolation... 70 Fig. 4.7 The diffusivity vs. oxygen partial pressure curves for monolithic
mullite at 1100oC and low-PSZ composites at 1000oC... 70 Fig. 4.8 The surface exchange coefficient vs. oxygen partial pressure
1000oC; (b) high-PSZ composites at 800oC. A slope of -1/4 is presented with the solid line... 71
Chapter 1
Introduction
1.1 Mullite and Zirconia
Mullite has become a potential material for advanced structural and functional ceramic because of its outstanding properties: low thermal expansion coefficient, good electrical insulation, high creep resistance, good high-temperature strength, and good chemical stability.1, 2 There are wide applications for mullite and mullite-related composites in industry, since they are used as refractory materials, high-temperature engineering materials, electronic packaging materials, optical materials, etc.1
Mullite is the only stable crystalline phase in the SiO2-Al2O3 binary system
under atmospheric conditions. The lattice type of mullite is orthorhombic (space group Pbam) and lattice constants are a = 0.755 nm, b = 0.768 nm, c = 0.288 nm.1 The chemical formula of mullite can be expressed as Al2[Al2+2xSi2-2x]O10-x, where x (0.17≤ x≤ 0.59) is the number of missing
oxygen atoms per unit cell. The formula represents the composition of sillimanite (Al2O3·SiO2) for x = 0, while the formula shows the composition
of stoichiometric mullite (3Al2O3·2SiO2) for x = 0.25.
Pure zirconia (ZrO2) has three crystalline forms: monoclinic (T < 1200°C),
tetragonal (1200°C < T < 2370°C) and cubic (T > 2370°C). The high temperature phases can be stabilized at room temperature by doped aliovalent oxides (e.g., Y2O3, MgO, CaO, etc.) to create fully stabilized
only stabilize the cubic and tetragonal structures but also create oxygen vacancies as following equation:
o o O o ' Zr 2 3 2O 2Y 3O V Y ⎯ZrO⎯ →⎯ + × + (1.1)
A large number of oxygen vacancies will cause high oxygen-ion mobility in stabilized ZrO2, because oxygen ionic conduction takes place by the
movement of oxygen ions through oxygen vacancies. Therefore, ZrO2
doped with aliovalent oxides has been attracted a great deal of attention for technological applications such as high temperature solid oxide fuel cells, oxygen sensors, and electrochemical oxygen pumps.3, 4
1.2 Mullite/Zirconia Composites
In order to enhance the mechanical properties of mullite ceramics, various mullite-matrix composites have been studied.5-7 It is well known that the major toughening mechanism in ZrO2-toughened mullite composite is the
stress-induced phase transformation toughening.8 Besides, the silicon carbide(SiC)-whisker is also the excellent reinforcement to improve the mechanical properties of mullite ceramics.7, 9 However, the oxidation of SiC in mullite ceramics could cause the degradation of their mechanical properties under high-temperature oxidizing environments.
Two oxidation modes of SiC-reinforced mullite/ZrO2 composites were
described by Lin et al.10 They proposed various oxidation modes based upon the relationship of the silica layer thickness and the depth of corresponding SiC whisker below the outermost surface in mullite/ZrO2
composites at elevated temperatures. The oxidation behavior of ceramic-matrix composites closely depends upon the composition of the matrix in the composites. Tsai et al.11, 12 reported that the oxidation behavior of SiC/ZrO2/mullite composites depended upon the ZrO2 content.
When volume fraction of ZrO2 in the matrix was smaller than a threshold
value, the oxygen diffusivity was much slower in the matrix than in the SiO2
layer and these composites morphologically showed a thinner oxidation zone. Conversely, the oxygen diffusivity was faster in the matrix than in the SiO2
layer and these composites morphologically displayed a large oxidation zone when volume fraction of ZrO2 was larger than the threshold value.
1.3 Thesis Outline
The oxidation behavior of SiC/ZrO2/mullite composites correlates closely
with the oxygen diffusion in the mullite/zirconia matrix. However, the investigation of oxygen diffusion in mullite/zirconia composites has not been presented to date. At first, the oxygen diffusivities in mullite/ZrO2
composites were measured by 18O/16O isotope exchange method using secondary ion mass spectrometry (SIMS) and the effect of ZrO2 content on
oxygen diffusivities of mullite/ZrO2 composites will be elucidated in
Chapter 2.
The existence of oxygen vacancies in mullite and ZrO2 can cause the oxygen
ions to transport via oxygen vacancies. As a result, mullite and ZrO2 can
be applied as the solid electrolyte.4, 13, 14 Because the physical properties of composite materials could be modified by a second phase, mullite/ZrO2
composites should be considered as a potential solid electrolyte at elevated temperatures. The measurement of electrical properties in mullite/ZrO2
composites is desirable. The electrical conductivities in mullite/ZrO2
composites were measured by impedance spectroscopy and the influence of ZrO2 content on electrical conductivity will be presented in Chapter 3.
For the reason that porous composites could be used in hot gas filtration environments, the influence of ZrO2 content on diffusion and/or surface
exchange rate in porous mullite/ZrO2 composites is a notable subject. Few
studies have been conducted on the character of mass transfer in porous mullite/ZrO2 composites to date. The diffusivities and surface exchange
coefficients of porous mullite/ZrO2 composites with various ZrO2 contents
were measured by the conductivity relaxation method in this study. The effects of ZrO2 content and oxygen partial pressure on the diffusivities and
surface exchange coefficients of porous mullite/ZrO2 composites will be
explored in Chapter 4.
Chapter 2
Oxygen diffusivities in mullite/zirconia composites
measured by
18O/
16O isotope exchange and secondary
ion mass spectrometry
2.1 Introduction
Mullite-matrix composites are good candidates for high-temperature structural applications among ceramic-matrix composites, because of their low thermal expansion coefficient, excellent strength and creep resistance at high temperatures, and good thermal shock resistance. Previous studies have reported that PSZ and SiC effectively improved the mechanical properties of mullite-matrix composites.5-7, 9 However, the oxidation of the SiC constituent would deteriorate the mechanical properties of such composites under high-temperature oxidizing environments. Moreover, the oxidation resistance of SiC-reinforced ceramic-matrix composites could be severely degraded because of the incorporation of PSZ into the matrix.
Several investigations on the oxidation behavior of mullite/PSZ/SiC composites have been carried out.10-12, 15-17 In a pioneering study, Lin et al.10 first phenomenologically proposed two distinct oxidation modes, designated as Mode I and Mode II, of mullite/PSZ/SiC composites at elevated temperatures: Mode I was based upon the assumption that oxygen diffusion in the silica layer was much faster than in the mullite/ZrO2 matrix,
and Mode II operated in opposite manner. However, oxygen diffusivities in various mullite/PSZ composites have not been available to date.
All the measurements of oxygen diffusivities in previous studies were conducted on monolithic ceramics.18-20 Using SIMS, Fielitz et al.18 measured oxygen diffusivities in 2/1-mullite and reported that oxygen diffusivities ranged from 5×10-20 to 9×10-18 m2/s at temperatures ranging from 1250 to 1525ºC. Ikuma et al.19 determined oxygen diffusivities in single crystal mullite to be between 1×10-21 and 8×10-20 m2/s at 1100 to 1300ºC. Kim et al.20 measured oxygen diffusivities in 2.8 mol% Y2O3-ZrO2 as 3.5×10⁻¹¹ m2/s at 1000ºC using Raman spectroscopy combined
with the 18O-16O isotope exchange technique. In this study, oxygen diffusivities in mullite/ZrO2 composites with various ZrO2 contents were
measured by the 18O/16O isotope exchange method using SIMS, to supplement the existing data base of oxygen diffusivities in ceramic materials. The relationship among oxygen diffusivity, composition, and microstructure for various mullite/ZrO2 composites is elucidated.
2.2 Experimental Procedures
The starting materials were commercial mullite powder (particle size = 0.2 µm in average, KM-mullite, Kyoritsu Ceramic Material Co., Nagoya, Japan) and 3 mol% Y2O3-doped PSZ powder (particle size = 0.3 µm in average,
TZ-3Y, Toyo Soda Mfg., Co., Tokyo, Japan). The mullite powder was mixed with various amounts of PSZ. The compositions and designations of the composites are listed in Table 2.1.
The powder mixtures were hot pressed at 1600ºC, except at 1675ºC for the monolithic mullite, in an argon (Ar) atmosphere and a uniaxial pressure of 30 MPa for 45 min using a hot press (model HP50-HTG-7010, Thermal
Technology, Inc., Santa Rosa, CA). Oxygen-deficient PSZ was formed in the as-hot-pressed samples. To avoid the inaccuracy, the samples were preannealed in air at 1360ºC for 4 hours after ultrasonic cleaning in acetone so that stoichiometric ZrO2 was obtained.
Hot-pressed samples were cut into pieces with dimensions of approximately 10 mm × 6 mm × 3 mm. All of the pieces were ground with a 15-µm diamond matted disc and then polished with 3-µm diamond paste using a precision polishing machine (model Minimet 1000, Buehler Ltd, Lake Bluff, IL). Then microstructures were observed by a field emission scanning electron microscope (FE-SEM, Model JSM-6500F, JEOL, Tokyo, Japan) with an acceleration voltage of 15 kV. To avoid charging, the samples were coated with gold using an ion coater.
The isotope-exchange method was applied using the rare stable isotope 18O (99 at%, Isotec Inc., Miamisburg, OH, USA) as tracer. Prior to annealing, the samples were rinsed ultrasonically in an acetone bath and distilled water. Then the chamber was evacuated, and a mixture of Ar and 18O with the ratio of 4:1 was introduced. The isotope exchange annealing was carried out at 1000°C/5 h, 1200°C/3 h, and 1350°C/2 h, respectively.
The isotope concentration profiles were analyzed using SIMS (Model Quad 6600, PHI, Chanhassen, MN, USA) with Cs ion (5 keV, 100 nA) as the primary beam. The rastered area was 300 µm × 300 µm, and the diameter of the analyzed zone was 75 µm. For the composites with a low-PSZ content (i.e., less than 30 vol% PSZ in this study), the diffusion depth of 18O isotope was quite small, and the 18O concentrations at various depths were
measured by sputtering with the Cs ion beam. In the case of the composites with a high-PSZ content (i.e., larger than 40 vol% PSZ in this study), the oxygen isotope penetrated deeply into the sample. The sample was then sectioned at various depths, where the 18O concentrations were measured by the method mentioned previously.
2.3 Results and Discussion
2.3.1 Measured Oxygen Concentration Profiles
The concentrations of oxygen isotope were calculated from the measured secondary ion intensities I (18O) and I(16O) according to:
) ( ) ( ) ( ) , ( 16 18 18 O I O I O I t x C + = (2.1)
In general, it is better to determine diffusivities under conditions where the steady state is reached. To achieve such experimental conditions (large α(t/D)1/2), the measured 18O concentration profiles can be fit by a simple erfc-type equation, while the reliability of the data can be improved by eliminating the surface exchange coefficient α as a fitting parameter. However, shorter diffusion anneal times (small α(t/D)1/2) were used in this study to expedite the experiments. Then oxygen diffusivities as well as surface exchange coefficients can be determined under such conditions, when the measured 18O concentration profiles are fitted by the following diffusion solution C(x,t) for a semi-infinite medium given by Crank.21
(
)
⎟⎟ ⎠ ⎞ ⎜ ⎜ ⎝ ⎛ + + − ⎟ ⎟ ⎠ ⎞ ⎜ ⎜ ⎝ ⎛ = − − t D h t D x t D h hx t D x C C C t x C v v v v bg g bg 4 erfc exp 4 erfc ) , ( 2 (2.2)where Dv is the volume diffusion coefficient (m2/s), α the surface exchange
coefficient (m/s), h being equal to α/Dv, Cg the 18O concentration in the gas
phase, Cbg the natural background level of 18O in the sample (≈ 0.2%), and t
the duration of the isotope anneal.
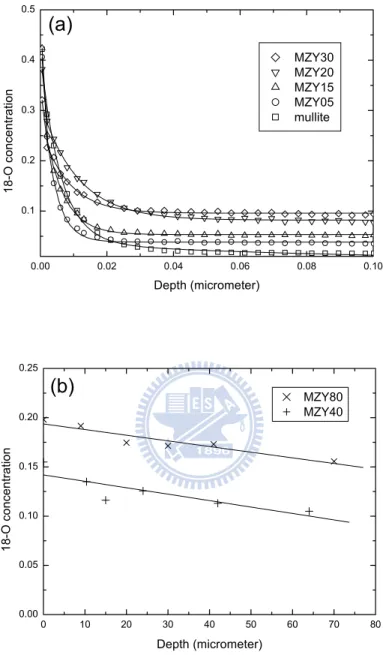
The 18O concentration profiles C(x,t) for various composites annealed at 1000°C are plotted in Fig. 2.1. The concentration profiles for MZY40 and MZY80 had a much smaller slope than those for pure mullite and for composites with 30 vol% PSZ or less. The slope of the concentration profile decreased with increasing PSZ content. As shown in Fig. 2.1(a), the tail for each composite approached a fixed value, which increased with PSZ content. This was probably caused by the fact that the grain boundary diffusion in PSZ is much higher than that in mullite. Note that the tail of experimental data in mullite was about 25 times higher than the natural 18O content (0.2%) and about an order of magnitude higher than the grain-boundary-related tail of the diffusion profile as reported by Fielitz et al.22 This could be attributed to the fact that the grain size (about 0.5 µm) in the current study was considerably smaller than that (about 5µm) in the previous study conducted by Fielitz et al.22 The penetration depth of 18O sharply increased as the PSZ content increased beyond some threshold value. Figure 2.1(b) shows the concentration profiles for MZY40 and MZY80, indicating a penetration depth of more than 70 µm. The 18O concentrations of MZY80 were obviously higher than those of MZY40 at the corresponding depths.
2.3.2 Oxygen Diffusivities versus PSZ Contents
Oxygen diffusivities as well as surface exchange coefficients were determined from the 18O concentration profiles C(x,t), based upon Eqn. (2.2) and nonlinear regression analyses. The results are listed in Table 2.2. The composites were divided into two categories depending on their diffusivities and surface exchange coefficients: the composites with 30 vol% have smaller values for these parameters, and those with 40 vol% have larger values. Oxygen diffusivities in high-PSZ composites were thus about 8 orders of magnitude higher than those in low-PSZ composites. Furthermore, oxygen diffusivities in the low-PSZ composites (≈ 10-21 to 10-18 m2/s at 1000 to 1350°C) were close to that in pure mullite, while those in the high-PSZ composites (≈ 10-11 to 10-10 m2/s at 1000 to 1350°C) were close to that of zirconia.20 It was also noted that oxygen diffusivity in mullite was unexpectedly larger than that in MZY05 or MZY15. This was attributed to the glassy phase typically at mullite grain triple junctions and grain boundaries because of the excess silica in mullite. It was believed that the oxygen transport through these grain boundaries, where the glassy phase was amorphous or liquidized at 1000 to 1350°C, was easier than through a crystalline phase.
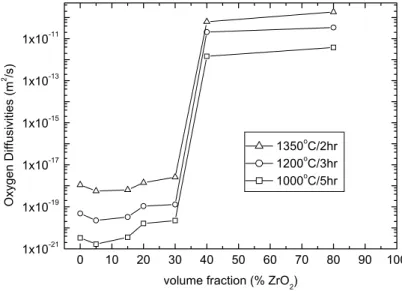
Figure 2.2 illustrates the relationship of oxygen diffusivities with respect to PSZ content at different temperatures, indicating that there was a dramatic increase in oxygen diffusivities between 30 and 40 vol% PSZ at all the annealing temperatures. The dramatic change in oxygen diffusivities between MZY30 and MZY40 could be explained by the percolation theory23,
Bruggeman’s symmetric effective medium theory assumes that two spherical particles are randomly mixed in the media. The diffusivity of such a random mixture (m), consisting of a high-diffusivity phase (h) and a low-diffusivity phase (l), can be predicted as follows: Dm = order of Dl, if f <
fc and Dm = order of Dh, if f > fc, where f is the volume fraction of the
high-diffusivity phase and fc is the percolation threshold. The percolation
threshold fc occurs at the volume fraction 0.33 for a three-dimensional case.
For the conductivity of a polymer-metal composite, the threshold decreased with increasing particle size ratio of the polymer with respect to the metal, as indicated in a previous study.26 Carmona et al.27 observed the threshold decreased with increasing aspect ratio of carbon fibers in the carbon-polymer composites.
In the present study, the high-diffusivity PSZ and the low-diffusivity mullite were equiaxed (or spherical) and both powders were randomly mixed. Therefore, the critical volume fraction between 30 and 40 vol% PSZ observed in this study is in agreement with the threshold value predicted by Bruggeman’s symmetric effective medium theory.
Based on the measurements of SiO2 layer (i.e., oxidation product of SiC)
thickness at various depth beneath the outermost surface, Lin et al.10 phenomenologically proposed two distinct oxidation modes of SiC/ZrO2/mullite composites at elevated temperatures. Mode I shows a
large gradient and a shallow oxidation depth, while Mode II exhibits a rather small gradient and a large oxidation depth.
Lin et al.10 claimed that the oxidation behavior strongly depended on the relative oxygen diffusivities through the silica layer and the mullite/PSZ matrix as well, even though oxygen diffusivities in various matrices were not measured at all. In their proposal, Mode I was based on the assumption that oxygen diffusion in the silica layer was much faster than in the mullite/zirconia matrix, while Mode II was based on the opposite assumption.
The measured oxygen diffusivities in low-PSZ composites (≤ 30 vol% PSZ) were smaller by 3 to 4 orders of magnitude than that in SiO2 (about 10-18
m2/s at 1000ºC),28 while those in high-PSZ composites (≥ 40 vol% PSZ) were higher by 5 to 6 orders of magnitude than that in SiO2. These results
could validate the modeling of oxidation modes proposed by Lin et al.10
It was worth noting that the 18O concentration profiles in the present study resemble the SiO2 layer thickness versus depth curves reported by Tsai and
Lin.12 Both experimental results (i.e., concentration profiles and SiO2 layer
thickness) of high-zirconia composites illustrated small gradients and large diffusion (or oxidation) depths, and vice versa. It was thus concluded that the oxidation behavior of SiC/ZrO2/mullite composites is closely related to
the oxygen diffusion through their respective ZrO2/mullite matrices.
Fielitz and Borchardt29 discussed the working limits of the diffusivities and surface exchange coefficients determined with the SIMS depth profile. They indicated that the chosen annealing time (t) with respect to the characteristic time constant (τ) was restricted to the range: 3×10⁻⁴ ≤ t/τ ≤ 10
atmosphere and the dynamic range of the 18O concentration was at least 1 order of magnitude higher than the natural abundance. The ratios of the experimental annealing time (t) to the characteristic time constant (τ) are listed in Table 2.2. It indicates that the t/τ ratios between 4.04×10⁻⁴ and
2.73×10⁻¹ are in the limited range with sufficiently long annealing time so that the diffusivities and the surface exchange coefficients determined by Eqn. (2.2) have acceptable accuracies in the present study.
2.3.3 Activation Energies versus PSZ Contents
Figure 2.3 displays the Arrhenius plots of oxygen diffusivities versus 1/T for the composites with various PSZ contents. The activation energies of oxygen diffusion in the composites were determined by the slope of fitting lines and are listed in Table 2.3. The activation energy of oxygen diffusion in MZY40 was close to that in MZY80, while the activation energy of oxygen diffusion in MZY05 approached that in pure mullite. It was noted that the activation energy had a tendency to decrease with increasing PSZ content. However, the activation energy of oxygen diffusion in MZY30 was slightly larger than that in MZY20. The pre-exponential constant D0 in
the oxygen diffusivity expression D= D0exp(-Q/RT) was determined from
the intercept of the lnD versus 1/T plot and the results are listed in Table 2.3. It indicated much higher D0 values for MZY40 and MZY80 than for others.
2.3.4 Microstructural Characteristics
The variation of oxygen diffusivities with respect to the PSZ content can be explained from the microstructural viewpoint. Figures 2.4(a) and 2.4(b) show the SEM micrographs of a low-PSZ and a high-PSZ composite, i.e., MZY15 and MZY40, respectively. The bright phase is PSZ, while the dark
one is mullite. Figure 2.4(a) reveals that the PSZ particles of MZY15 were isolated in the mullite matrix. In the low-PSZ composites, the oxygen diffused mainly via the continuous mullite, which has a small oxygen diffusivity (about 10-21 m2/s at 1000ºC). This is why the oxygen diffusivities in low-PSZ composites were expected to be of the same order of the oxygen diffusivity in mullite. In contrast, Fig. 2.4(b) shows that the PSZ particles in MZY40 were interconnected. This interconnected channel of the PSZ phase, which had a high oxygen diffusivity of about 10-11 m2/s at 1000ºC,20 became a rapid diffusion path for oxygen in high-PSZ composites. It is thus expected that the oxygen diffusivities in high-PSZ composites are of the same order as the oxygen diffusivity in PSZ.
2.4 Conclusions
1. The oxygen diffusivities in various mullite/PSZ composites were measured by the 18O/16O isotope exchange and secondary ion mass spectrometry method. The oxygen diffusivities in mullite/PSZ composites ranged from 10-21 to 10-10 m2/s, depending on the PSZ content and temperature.
2. The oxygen diffusivities in mullite/PSZ composites exhibited a threshold of PSZ content at between 30 and 40 vol%. The high-PSZ composites showed relatively high oxygen diffusivities, close to the oxygen diffusivity in PSZ. Correspondingly, the low-PSZ composites showed relatively small oxygen diffusivities, close to the oxygen diffusivity in mullite.
3. There was a clear tendency of the activation energies of oxygen diffusion in composites to decrease with increasing PSZ contents. The activation
energies of oxygen diffusion in high-PSZ composites were close to that of PSZ; while those of low-PSZ composites approached that of mullite. 4. The extreme difference in oxygen diffusivities between low-PSZ and
high-PSZ composites was explained by the microstructural features of the composites. In the high-PSZ composites, the relatively large oxygen diffusivities were attributed to the interconnected PSZ channels, which provided a fast diffusion path for oxygen.
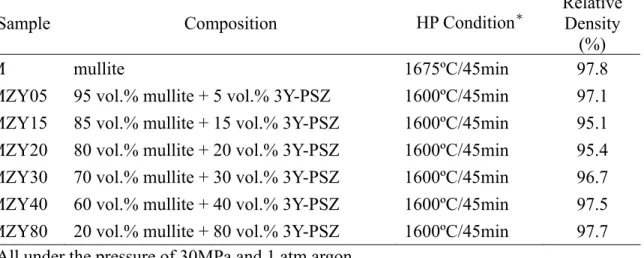
Table 2.1 Designations, compositions, hot-pressing conditions, and relative densities of various mullite/PSZ composites
Sample Composition HP Condition* Relative
Density (%)
M mullite 1675ºC/45min 97.8
MZY05 95 vol.% mullite + 5 vol.% 3Y-PSZ 1600ºC/45min 97.1 MZY15 85 vol.% mullite + 15 vol.% 3Y-PSZ 1600ºC/45min 95.1 MZY20 80 vol.% mullite + 20 vol.% 3Y-PSZ 1600ºC/45min 95.4 MZY30 70 vol.% mullite + 30 vol.% 3Y-PSZ 1600ºC/45min 96.7 MZY40 60 vol.% mullite + 40 vol.% 3Y-PSZ 1600ºC/45min 97.5 MZY80 20 vol.% mullite + 80 vol.% 3Y-PSZ 1600ºC/45min 97.7
*
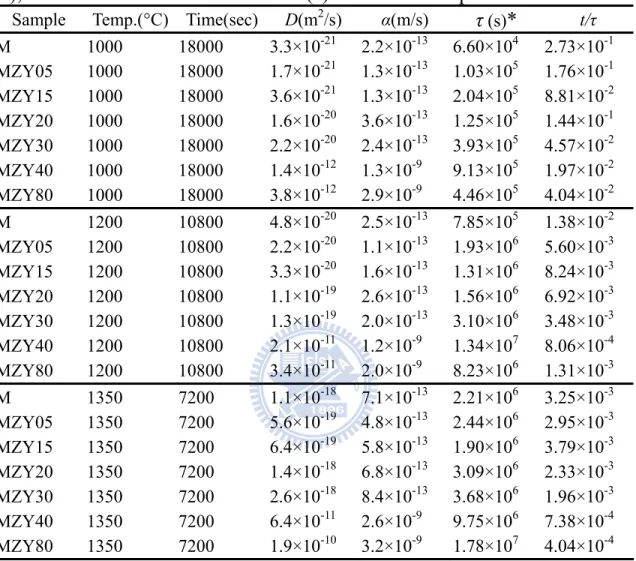
Table 2.2 Measured oxygen diffusivities (D), surface exchange coefficients (α), and characteristic time constants (τ) in various composites
Sample Temp.(°C) Time(sec) D(m2/s) α(m/s) τ (s)* t/τ
M 1000 18000 3.3×10⁻²¹ 2.2×10⁻¹³ 6.60×10⁴ 2.73×10⁻¹ MZY05 1000 18000 1.7×10⁻²¹ 1.3×10⁻¹³ 1.03×10⁵ 1.76×10⁻¹ MZY15 1000 18000 3.6×10⁻²¹ 1.3×10⁻¹³ 2.04×10⁵ 8.81×10⁻² MZY20 1000 18000 1.6×10⁻²⁰ 3.6×10⁻¹³ 1.25×10⁵ 1.44×10⁻¹ MZY30 1000 18000 2.2×10⁻²⁰ 2.4×10⁻¹³ 3.93×10⁵ 4.57×10⁻² MZY40 1000 18000 1.4×10⁻¹² 1.3×10⁻⁹ 9.13×10⁵ 1.97×10⁻² MZY80 1000 18000 3.8×10⁻¹² 2.9×10⁻⁹ 4.46×10⁵ 4.04×10⁻² M 1200 10800 4.8×10⁻²⁰ 2.5×10⁻¹³ 7.85×10⁵ 1.38×10⁻² MZY05 1200 10800 2.2×10⁻²⁰ 1.1×10⁻¹³ 1.93×10⁶ 5.60×10⁻³ MZY15 1200 10800 3.3×10⁻²⁰ 1.6×10⁻¹³ 1.31×10⁶ 8.24×10⁻³ MZY20 1200 10800 1.1×10⁻¹⁹ 2.6×10⁻¹³ 1.56×10⁶ 6.92×10⁻³ MZY30 1200 10800 1.3×10⁻¹⁹ 2.0×10⁻¹³ 3.10×10⁶ 3.48×10⁻³ MZY40 1200 10800 2.1×10⁻¹¹ 1.2×10⁻⁹ 1.34×10⁷ 8.06×10⁻⁴ MZY80 1200 10800 3.4×10⁻¹¹ 2.0×10⁻⁹ 8.23×10⁶ 1.31×10⁻³ M 1350 7200 1.1×10⁻¹⁸ 7.1×10⁻¹³ 2.21×10⁶ 3.25×10⁻³ MZY05 1350 7200 5.6×10⁻¹⁹ 4.8×10⁻¹³ 2.44×10⁶ 2.95×10⁻³ MZY15 1350 7200 6.4×10⁻¹⁹ 5.8×10⁻¹³ 1.90×10⁶ 3.79×10⁻³ MZY20 1350 7200 1.4×10⁻¹⁸ 6.8×10⁻¹³ 3.09×10⁶ 2.33×10⁻³ MZY30 1350 7200 2.6×10⁻¹⁸ 8.4×10⁻¹³ 3.68×10⁶ 1.96×10⁻³ MZY40 1350 7200 6.4×10⁻¹¹ 2.6×10⁻⁹ 9.75×10⁶ 7.38×10⁻⁴ MZY80 1350 7200 1.9×10⁻¹⁰ 3.2×10⁻⁹ 1.78×10⁷ 4.04×10⁻⁴ *τ = D/α2
Table 2.3 Pre-exponential constants (D0) and activation energies (Q) in various composites D0 (m2/s)* Q (kJ/mol) M 6.7 (±0.50)×10-10 277 (±24) MZY05 2.9 (±0.26)×10-10 277 (±29) MZY15 3.5 (±0.38)×10-11 246 (±33) MZY20 6.4 (±0.79)×10-12 212 (±30) MZY30 2.4 (±0.36)×10-11 223 (±48) MZY40 8.1 (±0.38)×10-5 188 (±15) MZY80 2.0 (±0.10)×10-4 189 (±14) *D = D0exp(-Q/RT)
0.00 0.02 0.04 0.06 0.08 0.10 0.1 0.2 0.3 0.4 0.5 (a) 18-O concentr a tion Depth (micrometer) MZY30 MZY20 MZY15 MZY05 mullite 0 10 20 30 40 50 60 70 80 0.00 0.05 0.10 0.15 0.20 0.25 (b) 18-O concentr a tion Depth (micrometer) MZY80 MZY40
Fig. 2.1 The concentration profiles of oxygen isotope 18O after annealing at 1000°C/5 h for (a) mullite, MZY05, MZY15, MZY20, and MZY30; (b) MZY40 and MZY80.
0 10 20 30 40 50 60 70 80 90 100 1x10-21 1x10-19 1x10-17 1x10-15 1x10-13 1x10-11 O xyg en Di ffu sivitie s (m 2 /s)
volume fraction (% ZrO2) 1350o
C/2hr 1200o
C/3hr 1000oC/5hr
Fig. 2.2 The relationships of oxygen diffusivity and PSZ content after annealing at 1350°C/2 h, 1200°C/3 h and 1000°C/5 h, respectively. 0.60 0.65 0.70 0.75 0.80 1x10-21 1x10-20 1x10-19 1x10-18 1x10-17 1x10-13 1x10-12 1x10-11 1x10⁻¹⁰ 1x10⁻⁹ 1300 1200 1100 1000 Dif fusi vit ies (m 2 /s ) 1000/T (K-1 ) MZY80 MZY40 MZY30 MZY20 MZY15 MZY05 mullite T (oC)
Fig. 2.3 Arrhenius plots of oxygen diffusivities in the composites with various PSZ contents.
b
a
Fig. 2.4 Secondary electron images of the as hot-pressed (a) MZY15 and (b) MZY40. The bright phase is PSZ, while the dark phase is mullite. (Thermal etching at 1300ºC/1 h).
Chapter 3
Effect of zirconia content on electrical conductivities of
mullite/zirconia composites measured by impedance
spectroscopy
3.1 Introduction
Although mullite has good high temperature strength and chemical stability, its low toughness limits its use in advanced structural applications. The mechanical properties of PSZ/mullite, SiCw/mullite, and SiCw/PSZ/mullite composites have been studied by many investigators.9, 30-33 It is well known that partially-stabilized zirconia (PSZ) and/or SiC whiskers can significantly improve the mechanical properties of mullite via mechanisms such as phase transformation toughening, whisker bridging, and crack deflection.
As far as electrical properties are concerned, mullite is a good insulator at room temperature and can be considered a semiconductor at high temperatures.34, 35 Gerhardt and Ruh36 reported that the incorporation of SiC-whiskers significantly affected the electrical properties of mullite matrix composites because SiC has a large dielectric constant (42 for SiC and 6.5 for mullite at 1 MHz)37 and a small electrical resistivity (5×10⁵ ohm-cm for SiC and 1×10¹³ ohm-cm for mullite at room temperature)38, 39 with respect to mullite. Previous studies have also been conducted on other composites.40,
41 Gerhardt40 showed the influence of volume fraction, size, and shape of
matrix composites. Runyan et al.41 studied the electrical conductivities of BN-B4C and BN-SiC composites under different orientations of the applied
electrical field, and the results were fit by the McLachlan equation or general effective medium equation. It is believed that the dramatic change in electrical properties with respect to the volume fraction is attributable to the formation of interconnected channels of the good conducting phase within the composites.
For electrochemical applications, mullite and ZrO2 can be used as the solid
electrolyte of an oxygen concentration cell because oxygen ions can transport through oxygen vacancies.4, 13, 14 Since the physical and/or chemical properties of composite materials could be tailored by incorporating various amounts of a second phase into a suitable matrix, a mullite/ZrO2 composite should be considered as a potential solid electrolyte
at elevated temperatures as well. The properties of composites, however, could be dependent on the intrinsic nature and the volume fractions of their constituents. Because there is a lack of literature on the subject, it is desirable to have a measurement of the electrical properties of mullite/zirconia composites. Therefore, the effect of ZrO2 content on the
electric conductivities is elucidated in this study.
3.2 Experimental
Procedures
The raw materials used in this study were commercial mullite powder (with a nominal composition 71.86 wt% Al2O3, 28.07 wt% SiO2, 0.03 wt% Fe2O3,
0.03 wt% NaO2 and 0.01 wt% MgO2, KM-mullite, Kyoritsu Ceramic
a nominal composition 94.75 wt% ZrO2, 5.21 wt% Y2O3, 0.005 wt% Al2O3,
0.005 wt% SiO2, 0.002 wt% Fe2O3 and 0.022 wt% NaO2, TZ-3Y, Toyo Soda
Mfg., Co., Tokyo, Japan).
The PSZ content in the mullite/PSZ composites was in the range from 5 to 80 vol%. The sample containing 5 vol% 3Y-PSZ was designated MZY05. Others were designated in a similar way with “M” and “Z” standing for monolithic mullite and 3Y-PSZ, respectively. The designations, compositions, hot pressing conditions, and relative densities of various composites are listed in Table 3.1.
Experimental samples were fabricated by hot-pressing at a temperature of 1675ºC for pure mullite and at 1600ºC for mullite/PSZ composites in argon at a pressure of 30 MPa for 45 min (Model HP50-HTG-7010, Thermal Technology Inc., Santa Rosa, CA). After hot pressing, the PSZ in the composites became oxygen deficient and blackened. The hot-pressed composites and PSZ were then annealed at 1360ºC/4 h in air so that near stoichiometric PSZ was obtained. Bulk densities were measured by the Archimedes method using deionized water as an immersion medium. The phases in each composite were identified using an x-ray diffractometer (XRD, Model MXP18, Mac Science, Yokohama, Japan). The measuring conditions of the XRD were Cu Kα radiation at 50 kV, 150 mA and a
scanning rate of 2°/min. The PSZ contained both monoclinic and tetragonal phases in all composites as shown in Table 3.1.
Microstructures were characterized by SEM (Model JSM-6500, JEOL, Tokyo, Japan). The SEM specimens were cut into pieces about 5 × 6 × 0.5
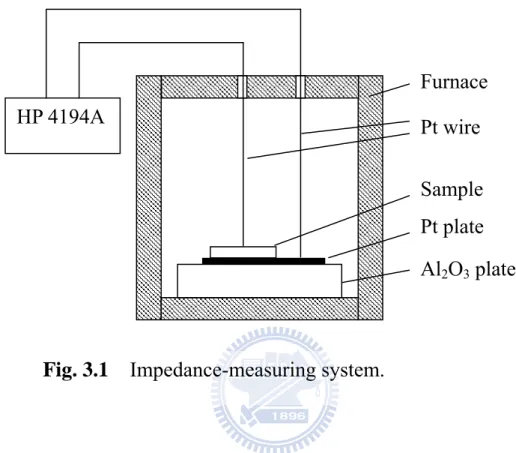
mm, ground, and polished with diamond paste using standard procedures. The Pt paste diluted with alcohol was painted on the surface of each sample and fired at 1000oC/10 min to prepare the electrode. Then, the sample was placed on a Pt plate. Two Pt wires were used to connect the sample to the measuring system, one contacted to the Pt electrode and the other to the Pt plate. The conductivity measurements were carried out by an alternating current (ac) impedance spectroscope (Model 4194A, Hewlett Packard Co., Palo Alto, CA. USA) in the frequency range of 100 Hz to 10 MHz at temperatures between 150 and 1300oC in air. The impedance-measuring system is schematically shown in Fig. 3.1. The impedance data were analyzed and fitted using the electrochemical impedance software, Z-view.42
3.3 Results
and
Discussion
3.3.1 Analyses of Impedance Spectra
The impedances of mullite and low-PSZ composites were found to be extremely large and scattered with significant errors at T≤ 300ºC. Their impedances were large enough so that the effect of inductive reactance was negligible. In the other respect, the impedance data of PSZ and high-PSZ composites at high temperatures were not adopted due to the inductive reactance. The Pt electrodes painted on the samples were porous and therefore could be regarded as several small metal wires. The electric current through the porous Pt electrode induced the inductive reactance, which adversely affected the conductivity measurements of PSZ and high-PSZ composites. Some of the measured impedance data in the high-frequency impedance spectra of PSZ and high-PSZ composites has a
positive reactance. These data were unable to be analyzed and it was noted that the degree of deviation from negative values increased with temperature. At high temperatures, PSZ behaves like a fast ion conductor, and the effect of inductive reactance becomes more apparent. Thus, one could not accurately obtain their electrical properties from the data measured at high frequencies and high temperatures.
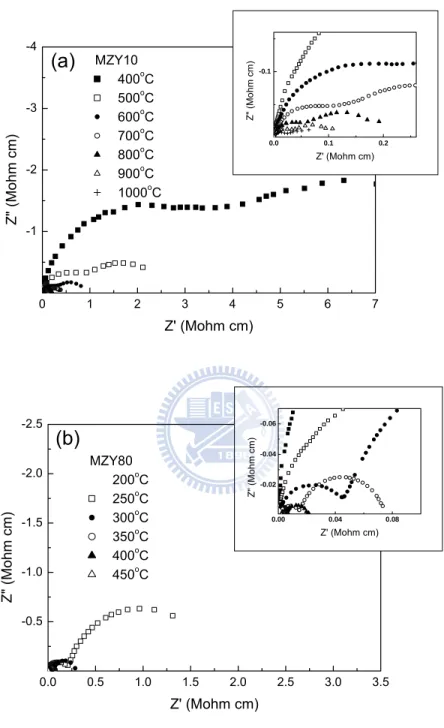
Figure 3.2(a) shows the typical impedance spectra for MZY10 at temperatures ranging from 400 to 1000oC. The horizontal axis is the real part of impedance (or resistance) while the vertical axis is the corresponding imaginary part (or reactance). The frequencies increased from right to left along the horizontal axis. The shape of the impedance spectra for MZY10 did not change significantly with respect to temperature, but the overall values of impedance did sharply decrease with temperature. Figure 3.2(b) shows the impedance spectra for MZY80 at temperatures between 200and 450oC, with two distinct semicircles in each impedance spectrum. The two semicircles corresponding to high and low frequencies in the impedance spectra of MZY80 were related to grains and grain boundaries, respectively.43, 44 The resistivities of MZY10 and MZY80 decreased with increasing temperature in the same way exhibited by the general ceramics. This is caused by the so-called negative temperature coefficient (NTC) behavior.
Figure 3.3 shows the impedance spectra of the composites with various PSZ contents at fixed temperatures. Note that the resistivities decrease with increasing PSZ content because PSZ, which is known to be a good ionic conductor, has a much smaller resistivity than mullite. Figure 3.3(a) shows
only one semicircle in the impedance spectrum of monolithic mullite at 700ºC. Monolithic mullite shows similar behavior, as reported in pervious studies.45, 46 The relaxation frequencies for mullite were estimated to be between 20 kHz and 1 MHz at temperatures ranging from 500 to 1300oC. The semicircle in the impedance spectra of mullite could be caused by the predominant contribution of grains because of the high relaxation frequency values.46
Meng and Huggins47 indicated that oxygen ionic conduction could be expected in mullite when oxygen vacancies were created by the substitution of Al3+ for Si4+ in the sillimanite structure. Hirata et al.48 reported that the electrons in mullite could be excited to the conduction band at a low oxygen pressure and that the electrical conduction of mullite is a combination of electronic and ionic conduction in a nitrogen atmosphere. In this study, the electrical conduction in mullite should be ionic conduction since the measurements were conducted in air.
The impedance spectra of monolithic PSZ and MZY80, as shown in Fig. 3.3(b), clearly revealed two semicircles that were related to grains and grain boundaries of PSZ. The impedance spectra of mullite/PSZ composites other than MZY80, however, were unlike those of monolithic mullite and PSZ, as shown in Figs. 3.3(a) and 3.3(b). The impedance responses at high and low frequencies showed two partially overlapped semicircles. Note that the low- and high-frequency arcs in impedance spectra were gradually discernible as the PSZ content was increased.
3.3.2 Conductivities and Activation Energies
The impedance data of PSZ and PSZ/mullite composites can be divided into two semicircles corresponding to high and low frequencies. They were modeled by an equivalent circuit consisting of two R-CPE parallel circuits in series, where R and CPE are the resistor and the constant-phase element, respectively.49 The impedance spectra of monolithic mullite showed , however, a single imperfect semicircle (i.e., a depressed circular arc), and its data were fit using a model of one R-CPE parallel circuit.49 In the other way, the impedance spectra with a perfect semicircle would be fit by the equivalent circuit of one RC parallel circuit.
The conductivities of various composites obey the Arrhenius equation and can be expressed by:
⎟ ⎠ ⎞ ⎜ ⎝ ⎛− = RT E A T exp a σ (3.1)
where σ is the conductivity (ohm-1 cm-1), A is a constant, Ea is the activation
energy (kJ/mol), R is the gas constant (J/mol K), and T is the absolute temperature (K).
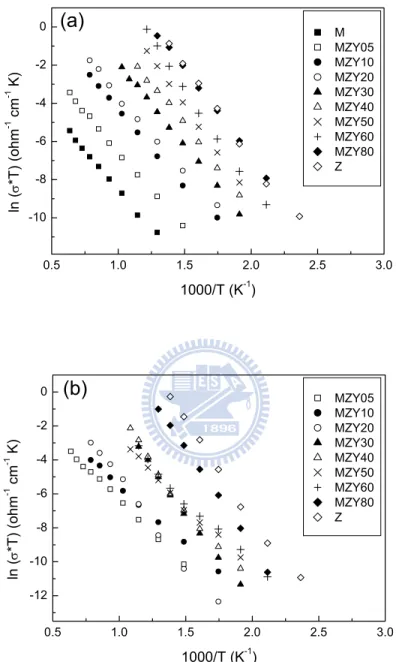
Figure 3.4 displays the Arrhenius plots of ln(σT) as a function of 1/T for all samples. The conductivities of the composites in the high-frequency region increased with increasing PSZ content as shown in Fig. 3.4(a). In contrast, the plots in Fig. 3.4(b) indicate that the conductivities in the low-frequency region exhibited a somewhat different trend. The conductivities of MZY20 at low temperatures were smaller than those of MZY05 and MZY10.
Furthermore, the slope of the ln(σT) versus 1/T curve for MZY20 was much larger than those for MZY05 and MZY10. The electrical conductivity versus 1/T curves of MZY30, MZY40, or MZY50 demonstrate a similar slope.
It was also noted that the conductivity in the high-frequency region (related to grains) of MZY80 was the same as that of PSZ, while the conductivity in the low-frequency region (related to grain boundaries) was much lower than that of PSZ. This can be explained by the fact that mullite grains are located at the grain boundaries of PSZ and the existence of intergranular mullite slightly decreased the conductivity of MZY80 along the grain boundaries. The intergranular mullite, however, did not affect the conductivity across the dense interconnected channels of PSZ grains in MZY80.
Figure 3.5 displays the activation energies of electrical conduction with respect to PSZ content in the high- and low-frequency regions. The activation energy for mullite was found to be about 65 kJ/mol, which is in agreement with previous studies.45, 47 For PSZ, the activation energies of the grain conductivity at high frequencies and of the grain-boundary conductivity at low frequencies were found to be about 79 and 93 kJ/mol, respectively, agreeing with the results reported by Guo and Zhang.44
The activation energies in the high- and low-frequency regions for MZY05 and MZY10 are approximately the same as that for mullite. The high-frequency measurements of MZY05 and MZY10 could be correlated with the presence of grains of mullite. The grain conductivities of MZY05
and MZY10, however, were different from those of monolithic mullite. PSZ has a much lower resistivity than mullite and can affect the electrical response in MZY05 and MZY10. That is why the grain conductivities for MZY05 and MZY10 are so different with those for monolithic mullite. In contrast, the low-frequency regions for MZY05 and MZY10 were correlated to the grain boundaries of PSZ and/or mullite. While a glassy phase was usually observed in the grain boundaries of monolithic mullite, the composites containing PSZ were lacking a glassy phase.50, 51 For MZY05 and MZY10, the low-frequency signal would transport through grain boundaries of mullite and/or PSZ instead of the glassy phase.
When the PSZ content was larger than 20 vol%, the activation energies in the low-frequency region were much higher than those of MZY05 and MZY10. This could be explained by the formation of a space charge layer at the interface of mullite and PSZ grains in an electric field. The space charge layer is usually formed at the interface of two phases with dissimilar electrical properties. The presence of a space charge potential would increase the activation energy of the electric conduction through the grain boundaries.44 Therefore, the low-frequency arcs of the composites were related to the space charge contribution when the PSZ content was larger than 20 vol%. There was not much difference in the activation energies from MZY20 to MZY60 at low frequencies. In contrast, the activation energies of the electric conduction in the high-frequency region between MZY20 and MZY60 increased gradually with PSZ content.
for MZY80 were close to those values for PSZ in the corresponding high- and low-frequency regions.
3.3.3 Conductivity versus PSZntent
Various theories describe the physical properties of a multi-phase system. The general mixing equation is frequently used to predict the electrical properties of a heterogeneous system and can be expressed by:52
(
)
n z n m n c V σ Vσ σ = 1− + (3.2)where V is the volume fraction of PSZ, σm, σz and σc are the conductivities of
mullite, PSZ, and composite, respectively, and n is a constant between -1 and 1. For the extreme, case, n = 1 if these two phases are laminated and laid parallel to the direction of electric current; n = -1 if these two phases are laminated and laid perpendicular to the direction of electric current. There is a mixed case where -1 < n < 1. When n → 0, the mixing equation is given by:52
(
)
m zc V σ V σ
σ 1 log log
log = − + . (3.3)
This expression was first proposed by Lichtenecker and was called Lichtenecker’s rule.53 The empirical Lichtenecker’s rule was applied successfully to estimate the dielectric content of a two-phase system in previous studies.54, 55 Zakri et al.56 demonstrated that Lichtenecker’s rule is not only an empirical relationship based on experimental results, but also a theoretical model that can be derived from the effective medium theory.
To understand the change of electrical properties in composites with various PSZ contents, the resistance (R) of those samples was measured at some fixed low and high frequencies. Then, the conductivity (σ) was calculated using: A l R⋅ = 1 σ (3.4)
where l and A were the thickness and cross-sectional area of the sample perpendicular to the electric current direction, respectively.
Figures 3.6(a) and 3.6(b) display the real parts of conductivity (σ’) as a function of PSZ content at the frequencies of 1 kHz and 1 MHz, respectively, at 600oC, indicating that the real part of conductivity increases with PSZ content. It was noted that the plot of ln σ’ versus PSZ content at 1 MHz [Fig. 3.6(a)] demonstrates a linear behavior in agreement with Lichtenecker’s rule. Figure 3.6(b), however, shows that the conductivities measured at 1 kHz with various PSZ contents were fit using the mixing rule [Eqn. (3.2)]. The parameter n was about 0.25.
The different trends for the ln σ’ of composites with various PSZ contents at 1 MHz and 1 kHz were caused by different factors. The conductivities measured at 1 MHz and 1 kHz were gained from the contribution of grains and grain boundaries, respectively. Figure 3.6(b) shows that the conductivities of composites with 30 to 60 vol% PSZ were not much different from the conductivities measured at 1 kHz. This could result from
the existence of space charge at grain boundaries as mentioned previously. Thought the space charge layer could deplete the charge carriers and cause an increase in resistivity of the grain boundaries,44 the resistivity was expected to decrease with increasing PSZ content. These two conflicting factors on the resistivity of grain boundaries resulted in less difference in the conductivity at 1 kHz when the PSZ content was between 30 and 60 vol%. Oxygen diffusivities of mullite/PSZ composites with various PSZ contents show percolation behavior with respect to PSZ content,57 though percolation behavior of electrical conductivities was not observed for mullite/PSZ composites. This could be attributed to less difference in the conductivities between mullite and PSZ. The oxygen diffusivity of PSZ was larger than that of mullite by at least 8 orders of magnitude; however, the difference in electrical conductivities at 1 MHz between mullite and PSZ was only about 2 orders of magnitude. Hence, the electrical conductivities of the composites do not reveal the percolation behavior.
3.3.4 Microstructural View of Point
Figure 3.7 shows that MZY05 exhibited elongated grains of mullite, while mullite grains in MZY30 and MZY80 were equiaxed. From the SEM micrograph of MZY05 [Fig. 3.7(a)], it was concluded that PSZ was located at the grain boundaries of mullite and was isolated by mullite grains. It was inferred that the conductivity was still dominated by mullite as mentioned in previous section, although the grain conductivity in MZY05 was increased because of the addition of PSZ. Figure 3.7(b) reveals that some PSZ particles became interconnected in MZY30. The conductivity would be
significantly affected by PSZ. Figure 3.7(c) showed that mullite grains were surrounded by PSZ grains in MZY80. The rapid path of interconnected PSZ for electrical conductivity was formed in MZY80, and the grain and grain-boundary conductivities in MZY80 were completely controlled by PSZ.
3.4 Conclusions
1. The electrical conductivities of mullite/PSZ composites with PSZ content were measured by the ac impedance spectroscopy. The impedance spectra of monolithic mullite showed only one semicircle, while the monolithic PSZ and mullite/PSZ composites showed two semicircles.
2. The conductivities of mullite/PSZ composites increased with the PSZ content, but no percolation relationship was observed. The real parts of conductivities measured at 1 MHz and 1 KHz were in good agreement with the Lichtenecker’s rule and the mixing rule, respectively.
3. The activation energies of electrical conduction for mullite/PSZ composites were different in the high-frequency and low-frequency regions, depending on the PSZ content. The activation energies of grain conductivities in mullite and PSZ were about 65 and 79 kJ/mol, respectively, while those in the composites were calculated in between these two values. Furthermore, the activation energies sharply increased at 10 to 20 vol% PSZ in the low-frequency region.
4. The electrical conductivities of mullite/PSZ composites were effectively increased by the incorporation of PSZ so that high-PSZ composites
could be used for electrochemical purposes such as a gas sensor at high temperatures.
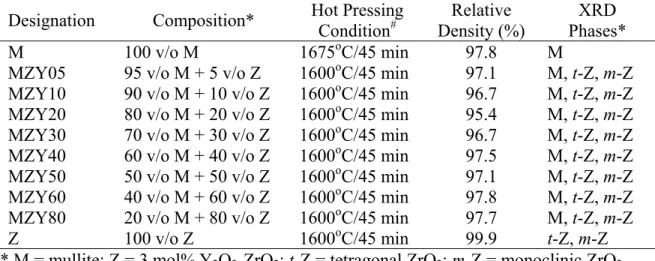
Table 3.1 Designations, compositions, hot pressing conditions, relative densities, and x-ray phases of various mullite/PSZ composites
* M = mullite; Z = 3 mol% Y2O3-ZrO2; t-Z = tetragonal ZrO2; m-Z = monoclinic ZrO2
Designation Composition* Hot Pressing Condition# Density (%) Relative Phases* XRD
M 100 v/o M 1675oC/45 min 97.8 M
MZY05 95 v/o M + 5 v/o Z 1600oC/45 min 97.1 M, t-Z, m-Z MZY10 90 v/o M + 10 v/o Z 1600oC/45 min 96.7 M, t-Z, m-Z MZY20 80 v/o M + 20 v/o Z 1600oC/45 min 95.4 M, t-Z, m-Z MZY30 70 v/o M + 30 v/o Z 1600oC/45 min 96.7 M, t-Z, m-Z MZY40 60 v/o M + 40 v/o Z 1600oC/45 min 97.5 M, t-Z, m-Z
MZY50 50 v/o M + 50 v/o Z 1600oC/45 min 97.1 M, t-Z, m-Z MZY60 40 v/o M + 60 v/o Z 1600oC/45 min 97.8 M, t-Z, m-Z MZY80 20 v/o M + 80 v/o Z 1600oC/45 min 97.7 M, t-Z, m-Z
Z 100 v/o Z 1600oC/45 min 99.9 t-Z, m-Z
HP 4194A Furnace Pt plate Sample Pt wire Al2O3 plate
0 1 2 3 4 5 6 7 -1 -2 -3 -4 0.0 0.1 0.2 -0.1 Z" ( M oh m c m ) Z' (Mohm cm) (a) Z" (Mohm cm) Z' (Mohm cm) MZY10 400oC 500oC 600oC 700oC 800oC 900oC 1000oC 0.0 0.5 1.0 1.5 2.0 2.5 3.0 3.5 -0.5 -1.0 -1.5 -2.0 -2.5 0.00 0.04 0.08 -0.02 -0.04 -0.06 Z" ( M oh m cm) Z' (Mohm cm) (b) Z" (Moh m cm) Z' (Mohm cm) MZY80 200oC 250oC 300oC 350oC 400oC 450oC
Fig. 3.2 Typical impedance spectra. (a) For MZY10 at temperatures ranging from 400 to 1000oC; (b) For MZY80 at temperatures ranging from 200 to 450oC. The enlarged views at low impedances are shown in the inset.
0 1 2 3 4 5 6 -1 -2 -3 -4 0.0 0.1 0.2 0.3 -0.1 -0.2 Z " (Mohm cm ) Z' (Mohm cm) (a) Z" (Moh m cm) Z' (Mohm cm) at 700o C M MZY05 MZY10 MZY20 0 1 2 3 4 -1 -2 0.0 0.1 0.2 0.3 -0.1 -0.2 Z " ( M ohm c m ) Z' (Mohm cm) (b) Z" (M ohm cm ) Z' (Mohm cm) at 300oC MZY30 MZY40 MZY50 MZY60 MZY80 Z
Fig. 3.3 Impedance spectra of the composites with various PSZ contents: (a) M, MZY05, MZY10 and MZY20 at 700oC; (b) MZY30, MZY40, MZY50, MZY60, MZY80 and Z at 300oC. The enlarged views at low impedances are shown in the inset.
0.5 1.0 1.5 2.0 2.5 3.0 -10 -8 -6 -4 -2 0 ln ( σ *T) ( ohm -1 cm -1 K) (a) 1000/T (K-1) M MZY05 MZY10 MZY20 MZY30 MZY40 MZY50 MZY60 MZY80 Z 0.5 1.0 1.5 2.0 2.5 3.0 -12 -10 -8 -6 -4 -2 0 ln ( σ *T) ( ohm -1 cm -1 K) (b) 1000/T (K-1) MZY05 MZY10 MZY20 MZY30 MZY40 MZY50 MZY60 MZY80 Z
Fig. 3.4 Arrhenius plots of conductivities determined (a) in the high-frequency region; (b) in the low-frequency region of impedance spectra.
0 20 40 60 80 100 60 70 80 90 100 ac tivation e nerg y (kJ/mol) zirconia (vol%)
high frequency region low frequency region monolithic mullite
Fig. 3.5 The activation energy versus PSZ content curves of mullite/PSZ composites in the high-frequency and low-frequency regions, respectively, of the impedance spectra.
0 20 40 60 80 100 -11 -10 -9 -8 -7 -6 ln σ ' (ohm -1 cm -1 ) (a) zirconia (vol%) 0 20 40 60 80 100 -18 -16 -14 -12 -10 -8 -6 ln σ ' (ohm -1 cm -1 ) (b) zirconia (vol%)
Fig. 3.6 The real part of conductivity versus PSZ content curve at the frequencies of (a) 1 MHz and (b) 1 KHz at 600°C. The fitting lines in (a) and (b) were determined by Lichtenecker’s rule and the general mixing equation, respectively.
( c ) ( b )
( a )
Fig. 3.7 Scanning electron micrographs of mullite/PSZ composites: (a) MZY05; (b) MZY30; (c) MZY80. The dark phase is mullite and the bright phase is PSZ.
Chapter 4
Oxygen Diffusivities and Surface Exchange Coefficients
in Porous Mullite/Zirconia Composites Measured by the
Conductivity Relaxation Method
4.1 Introduction
Mullite is a frequently used material for applications at high temperatures due to its advantageous properties, including good creep resistance, excellent chemical stability, and suitable high-temperature strength.1 In addition, mullite is a potential substrate material because it has a favorable dielectric constant and thermal expansion coefficient.58 To further improve its mechanical properties (e.g., fracture toughness), ZrO2 particles and/or SiC
whiskers have been incorporated in mullite, as indicated in previous studies.5,
9, 59, 60
One can modify the properties of composite materials by combining two or more components. The properties of composites are highly dependent upon the size, shape and content of the individual components. Previous studies57, 61 investigated the oxygen diffusivities and electrical conductivities of mullite/PSZ composites with various PSZ contents. The percolation phenomenon for oxygen diffusion in mullite/PSZ composites was observed at 30-40 vol% PSZ, while no such a phenomenon was observed for electrical conduction.61 The electrical conductivities of mullite/PSZ composites followed Lichtenecker’s rule at high frequencies and the general mixing equation at low frequencies.
Recently, the mechanical properties of porous mullite/ZrO2 composites have
been investigated.62, 63 Haslam and Lange62 developed a processing method to strengthen porous mullite/ZrO2 composites without shrinkage using
evaporation/condensation sintering in an HCl atmosphere. Latella and Mehrtens63 indicated that the mullite/ZrO2 composites with 62% porosity
showed no strength degradation at temperatures ranging from 25 to 1200oC. Because porous composites could be used in hot gas filtration environments, the influence of ZrO2 content on diffusion and/or surface exchange rate in
porous mullite/ZrO2 composites is an important subject.
To date, little research has been conducted on the character of mass transfer in porous mullite/ZrO2 composites. In a previous study,64 Ganeshananthan
and Virkar measured the oxygen surface exchange coefficients of porous La0.6Sr0.4CoO3-δ using the conductivity relaxation method. In this study, the
conductivity relaxation method was used to measure the diffusivities and surface exchange coefficients of porous mullite/PSZ composites with various PSZ contents. The effects of PSZ content and oxygen partial pressure on the diffusivities and surface exchange coefficients of porous mullite/PSZ composites were explored.
4.2 Experimental
Procedures
Based upon a previous study on the percolation phenomenon, mullite/PSZ composites containing more than 40 vol% PSZ were defined as "high-PSZ composites"; otherwise, the composites were categorized as "low-PSZ composites."
The composites in this study were fabricated by sintering mixtures of mullite (KM-mullite, 71.86 wt% Al2O3, 28.07 wt% SiO2, 0.03 wt% Fe2O3, 0.03 wt%
NaO2 and 0.01 wt% MgO2, 0.2 µm on average, Kyoritsu Ceramic Materials
Co., Nagoya, Japan), 3 mol% Y2O3-stabilized ZrO2 or 3Y-ZrO2 powder
(TZ-3Y, 94.75 wt% ZrO2, 5.21 wt% Y2O3, 0.005 wt% Al2O3, 0.005 wt%
SiO2, 0.002 wt% Fe2O3 and 0.022 wt% NaO2, 0.3 µm on average, Toyo Soda
Mfg., Co., Tokyo, Japan), and carbon (Vulcan XC72, 0.03 µm on average, Cabot Co., Billerica, MA), wherein 30 vol% carbon was used as the pore-forming agent.
The starting powders were first dispersed in alcohol. The pH value was adjusted to 10 using NH4OH as an electrolyte, and then the powder mixtures
were dried on a hot plate. Subsequently, they were uniaxially pressed at 63 MPa for a few minutes. The cold-pressed samples were heated to burn out carbon at 600°C for 30 min and then sintered at 1200-1550°C for 2-3 h depending upon the composition of the powder mixture.
The densities of the sintered bodies were determined by the Archimedes method using de-ionized water as an immersing medium, and the relative densities were then calculated. The designations, compositions, sintering conditions, and relative densities of these composites are listed in Table 4.1. The sintered composites were cut into pieces about 3.5 × 3.5 × 0.8 mm in size. Samples were ground and polished with a precision polishing machine (Model Minimet 1000, Buehler Ltd, Lake Bluff, IL) using standard procedures as described previously.57
![HPSH [ 氧化數平衡反應式係數 ]](data:image/gif;base64,R0lGODlhAQABAIAAAP///wAAACH5BAEAAAAALAAAAAABAAEAAAICRAEAOw==)