行政院國家科學委員會專題研究計畫 成果報告
都市街道熱環境之分析
研究成果報告(精簡版)
計 畫 類 別 : 個別型
計 畫 編 號 : NSC 98-2218-E-004-001-
執 行 期 間 : 98 年 03 月 01 日至 98 年 12 月 31 日
執 行 單 位 : 國立政治大學地政學系
計 畫 主 持 人 : 孫振義
共 同 主 持 人 : 張琪如
計畫參與人員: 大專生-兼任助理人員:賴育生
大專生-兼任助理人員:張巧姈
大專生-兼任助理人員:呂柏嬋
大專生-兼任助理人員:張潔
報 告 附 件 : 出席國際會議研究心得報告及發表論文
處 理 方 式 : 本計畫涉及專利或其他智慧財產權,2 年後可公開查詢
中 華 民 國 99 年 03 月 31 日
1
98 年度 行政院國家科學委員會補助專題研究計畫--
「都市街道熱環境之分析計畫」期末報告
執行期限: 98/03/01 ~ 98/12/31
計畫編號: NSC 98-2218-E-004 -001 –
執行機構:國立政治大學 主 持 人:孫振義 助理教授(地政學系)
中國文化大學 共同主持人:張琪如 助理教授(景觀學系(所))
摘要
近年來,改善建築節約能源與熱舒適性的目標儼然成為從事都市環境研究者的重
要目標。此外,若能夠有效降低都市街道周圍環境的溫度,對於空調系統的節約
能源效果與戶外熱舒適有直接的效益。因此,本研究將進行不同街道間之比較,
並量測與分析街道高寬比、綠化程度、建築密度等因素對於都市街道熱環境的影
響。藉由分析相同座向(東西向)、寬度(10 公尺)、座落區域之 2 條街道的周圍環
境調查與熱環境量測數據,以探討台灣未來都市設計時,對於東西走向之街道在
尺度上、材質上及植栽設計…等方面的規劃,並具體提出有效降低都市街道高溫
化、改善熱舒適性的方針。
Abstract
Recently, the most important goal of urban climatologists is to find a way that could
both reduce building energy consumption and create thermal comfort conditions in
the same time. Surely it will reduce power consuming of air conditioners and
provide comfortable outdoor environment, if climatologists can lower the ambient air
temperature in urban canyons. Therefore, this study evaluates how big the several
factors, including the vegetation condition, aspect ratio, and building density,
influence the temperature of urban street environment. Through investigating and
analyzing the thermal environment of two urban streets which have same orientation,
width and land-use type, this study brings up some suggestions for diminishing
thermal comfort problems of urban streets and provides some strategies such as street
width, paving material and vegetation planning, in future urban planning.
2
一、前言
都市中由於大量的建築物、人工發散熱、稀少的綠化與水體等因素,導致台灣都
市區域的溫度有明顯高於郊區的現象(林憲德等,2005;孫振義、林憲德,2006),
這種在氣象學上被稱為「熱島效應」的現象(圖 1)不但會造成居住環境熱舒適性
的問題,更會直接影響居住單元空調系統的能源消耗,對目前政府極力推廣的節
能減碳有相當程度的衝突。加上台灣是一個人口密集度極高的地區,有高達 77%
以上的人口居住於都市之中(林憲德等,2005),高密度的居住型態導致的都市街
道高熱環境將嚴重的影響多數居民的生活舒適度。此外,據台電估計,台灣地區
夏季尖峰室外氣溫每上升 1℃,空調耗電量約上升 6%,以台灣大都會區夏季市
中心與市郊的最高氣溫差 3 -4℃估算,夏季市中心的空調射設備耗電量比郊區高
出四分之一﹙林憲德,2000﹚,顯示都市街道高溫化將會增加周圍居民的空調系
統耗電量,惡化台灣日益嚴重的能源問題。因此,研究都市街道型態、街道元素
與氣溫間的關係,進而提出改善都市高溫化現象的方針,著實成為都市環境研究
者的重要工作之一。
本計畫因原申請研究期程為三年,後蒙「行政院國家科學委員會」補助 10 個月,
由於預算及研究時程與原規劃有若干程度之差異,因此導致部分研究成果未能及
時展現,在此特別提出說明。
二、重要研究成果
本計畫經過十個月的研究過程中,總計進行了十五次的量測,最終因天候關係僅
取 得 十 次 完 整 之 數 據 (2008/12/11 、 2009/01/15 、 2009/02/07 、 2009/06/07 、
2009/07/30、2009/08/19、2009/08/27、2009/09/07、2009/10/26、2009/12/14)。在
有限的經費與時間條件下,本計畫在街道環境因子中選取了街道高寬比、綠覆率
及建築面積比等三項參數作為與氣溫數據比較的因子,並且得到以下具體結論。
1. 在深夜時段,街道溫度與環境因子相關性較高;
2. 中午、晚上與深夜之最高、最低溫測點不盡相同;
3. 不同高度之街道溫度中,以 2m 及 3m 的溫度較為穩定、波動較小;
4. 街道高寬比與綠覆率為影響街道氣溫的重要因子;
5. 3m 與 4m 高的溫度資料因為較不受地面交通量之影響,較能反應環境因子之
相關特性。
3
表一 本研究各實測日期街道溫度與街道環境因子之關係係數
20091214 (1M)中 (2M)中 (3M)中 (4M)中 (1M)晚 (2M)晚 (3M)晚 (4M)晚 (1M)夜 (2M)夜 (3M)夜 (4M)夜 H/W -0.014 -0.111 -0.067 -0.156 0.338 0.427 0.460 0.508 0.404 0.559 0.545 0.649 綠覆率% 0.066 0.196 0.023 0.095 -0.321 -0.402 -0.454 -0.435 -0.459 -0.579 -0.557 -0.616 建築密度% -0.148 -0.169 -0.052 -0.016 0.333 0.431 0.454 0.472 0.303 0.442 0.388 0.472 20091026 (1M)中 (2M)中 (3M)中 (4M)中 (1M)晚 (2M)晚 (3M)晚 (4M)晚 (1M)夜 (2M)夜 (3M)夜 (4M)夜 H/W 0.023 -0.002 0.104 -0.115 0.166 0.397 0.398 0.448 0.165 0.370 0.207 0.147 綠覆率% -0.143 0.003 -0.184 -0.046 -0.361 -0.525 -0.579 -0.583 -0.147 -0.441 -0.371 -0.178 建築密度% 0.126 0.018 0.151 0.014 0.292 0.398 0.461 0.525 0.190 0.458 0.401 0.248 20090907 (1M)中 (2M)中 (3M)中 (4M)中 (1M)晚 (2M)晚 (3M)晚 (4M)晚 (1M)夜 (2M)夜 (3M)夜 (4M)夜 H/W -0.005 0.045 0.114 0.082 0.187 0.153 0.235 0.224 0.329 0.432 0.410 0.452 綠覆率% -0.105 -0.205 -0.245 -0.229 -0.303 -0.313 -0.429 -0.240 -0.665 -0.657 -0.689 -0.706 建築密度% -0.015 0.069 0.131 0.099 0.313 0.337 0.396 0.218 0.555 0.565 0.555 0.594 20090827 (1M)中 (2M)中 (3M)中 (4M)中 (1M)晚 (2M)晚 (3M)晚 (4M)晚 (1M)夜 (2M)夜 (3M)夜 (4M)夜 H/W -0.172 -0.116 -0.124 -0.259 -0.008 0.160 0.187 0.230 0.331 0.344 0.397 0.345 綠覆率% -0.043 -0.062 -0.119 0.060 -0.032 -0.196 -0.259 -0.348 -0.428 -0.448 -0.531 -0.484 建築密度% -0.078 -0.047 0.019 -0.112 0.041 0.200 0.203 0.362 0.343 0.320 0.398 0.328 20090819 (1M)中 (2M)中 (3M)中 (4M)中 (1M)晚 (2M)晚 (3M)晚 (4M)晚 (1M)夜 (2M)夜 (3M)夜 (4M)夜 H/W -0.225 -0.212 -0.182 -0.202 0.173 0.181 0.182 0.244 0.238 0.402 0.398 0.396 綠覆率% 0.017 0.060 0.052 0.130 -0.256 -0.297 -0.296 -0.367 -0.463 -0.598 -0.589 -0.557 建築密度% 0.044 0.000 0.011 -0.011 0.009 0.106 0.104 0.257 0.491 0.529 0.529 0.588 20090730 (1M)中 (2M)中 (3M)中 (4M)中 (1M)晚 (2M)晚 (3M)晚 (4M)晚 (1M)夜 (2M)夜 (3M)夜 (4M)夜 H/W 0.223 0.212 0.215 0.245 0.196 0.141 0.268 0.353 0.364 0.468 0.470 0.555 綠覆率% -0.433 -0.485 -0.480 -0.491 -0.342 -0.407 -0.379 -0.470 -0.489 -0.591 -0.618 -0.667 建築密度% 0.150 0.219 0.257 0.203 0.264 0.429 0.384 0.483 0.476 0.512 0.484 0.567 20090607 (1M)中 (2M)中 (3M)中 (4M)中 (1M)晚 (2M)晚 (3M)晚 (4M)晚 (1M)夜 (2M)夜 (3M)夜 (4M)夜 H/W -0.059 0.118 0.140 0.086 0.160 0.073 0.157 0.127 -0.003 -0.057 0.071 0.055 綠覆率% -0.032 -0.175 -0.221 -0.152 -0.238 -0.120 -0.259 -0.163 -0.109 0.010 -0.114 -0.132 建築密度% -0.047 0.048 0.162 0.194 0.210 0.055 0.212 0.148 0.195 0.207 0.263 0.1824
24.000 25.000 26.000 27.000 28.000 29.000 30.000 A0 01 ‐0 A0 02 ‐0 A0 03 ‐0 A0 04 ‐0 A0 05 ‐0 A0 06 ‐0 A0 07 ‐0 A0 08 ‐0 A0 09 ‐0 A0 10 ‐0 A0 11 ‐0 A0 12 ‐0 A0 13 ‐0 A0 14 ‐0 A0 15 ‐0 A0 16 ‐0 A0 17 ‐0 B0 0 1 ‐0 B0 0 2 ‐0 B0 0 3 ‐0 B0 0 4 ‐0 B0 0 5 ‐0 B0 0 6 ‐0 B0 0 7 ‐0 B0 0 8 ‐0 B0 0 9 ‐0 B0 1 0 ‐0 B0 1 1 ‐0 B0 1 2 ‐0 B0 1 3 ‐0 B0 1 4 ‐0 B0 1 5 ‐0 B0 1 6 ‐0 B0 1 7 ‐0 20091214(1M)中 20091214(2M)中 20091214(3M)中 20091214(4M)中 21.000 21.500 22.000 22.500 23.000 23.500 24.000 24.500 A00 1 ‐0 A00 2 ‐0 A00 3 ‐0 A00 4 ‐0 A00 5 ‐0 A00 6 ‐0 A00 7 ‐0 A00 8 ‐0 A00 9 ‐0 A01 0 ‐0 A01 1 ‐0 A01 2 ‐0 A01 3 ‐0 A01 4 ‐0 A01 5 ‐0 A01 6 ‐0 A01 7 ‐0 B0 0 1 ‐0 B0 0 2 ‐0 B0 0 3 ‐0 B0 0 4 ‐0 B0 0 5 ‐0 B0 0 6 ‐0 B0 0 7 ‐0 B0 0 8 ‐0 B0 0 9 ‐0 B0 1 0 ‐0 B0 1 1 ‐0 B0 1 2 ‐0 B0 1 3 ‐0 B0 1 4 ‐0 B0 1 5 ‐0 B0 1 6 ‐0 B0 1 7 ‐0 20091214(1M)晚 20091214(2M)晚 20091214(3M)晚 20091214(4M)晚 18.000 18.500 19.000 19.500 20.000 20.500 21.000 21.500 A0 01 ‐0 A0 02 ‐0 A0 03 ‐0 A0 04 ‐0 A0 05 ‐0 A0 06 ‐0 A0 07 ‐0 A0 08 ‐0 A0 09 ‐0 A0 10 ‐0 A0 11 ‐0 A0 12 ‐0 A0 13 ‐0 A0 14 ‐0 A0 15 ‐0 A0 16 ‐0 A0 17 ‐0 B0 0 1 ‐0 B0 0 2 ‐0 B0 0 3 ‐0 B0 0 4 ‐0 B0 0 5 ‐0 B0 0 6 ‐0 B0 0 7 ‐0 B0 0 8 ‐0 B0 0 9 ‐0 B0 1 0 ‐0 B0 1 1 ‐0 B0 1 2 ‐0 B0 1 3 ‐0 B0 1 4 ‐0 B0 1 5 ‐0 B0 1 6 ‐0 B0 1 7 ‐0 20091214(1M)夜 20091214(2M)夜 20091214(3M)夜 20091214(4M)夜
圖一 2009/12/14 中午、晚上及深夜時段各高度測點溫度變化圖(縱軸為溫度℃、
橫軸為測點編號)
5
18.000 19.000 20.000 21.000 22.000 23.000 24.000 25.000 26.000 27.000 28.000 A 001 ‐0 A 002 ‐0 A 003 ‐0 A 004 ‐0 A 005 ‐0 A 006 ‐0 A 007 ‐0 A 008 ‐0 A 009 ‐0 A 010 ‐0 A 011 ‐0 A 012 ‐0 A 013 ‐0 A 014 ‐0 A 015 ‐0 A 016 ‐0 A 017 ‐0 B0 0 1 ‐0 B0 0 2 ‐0 B0 0 3 ‐0 B0 0 4 ‐0 B0 0 5 ‐0 B0 0 6 ‐0 B0 0 7 ‐0 B0 0 8 ‐0 B0 0 9 ‐0 B0 1 0 ‐0 B0 1 1 ‐0 B0 1 2 ‐0 B0 1 3 ‐0 B0 1 4 ‐0 B0 1 5 ‐0 B0 1 6 ‐0 B0 1 7 ‐0 20091214(1M)中 20091214(1M)晚 20091214(1M)夜 18.000 20.000 22.000 24.000 26.000 28.000 30.000 A 001 ‐0 A 002 ‐0 A 003 ‐0 A 004 ‐0 A 005 ‐0 A 006 ‐0 A 007 ‐0 A 008 ‐0 A 009 ‐0 A 010 ‐0 A 011 ‐0 A 012 ‐0 A 013 ‐0 A 014 ‐0 A 015 ‐0 A 016 ‐0 A 017 ‐0 B0 0 1 ‐0 B0 0 2 ‐0 B0 0 3 ‐0 B0 0 4 ‐0 B0 0 5 ‐0 B0 0 6 ‐0 B0 0 7 ‐0 B0 0 8 ‐0 B0 0 9 ‐0 B0 1 0 ‐0 B0 1 1 ‐0 B0 1 2 ‐0 B0 1 3 ‐0 B0 1 4 ‐0 B0 1 5 ‐0 B0 1 6 ‐0 B0 1 7 ‐0 20091214(2M)中 20091214(2M)晚 20091214(2M)夜 18.000 20.000 22.000 24.000 26.000 28.000 30.000 A001 ‐0 A002 ‐0 A003 ‐0 A004 ‐0 A005 ‐0 A006 ‐0 A007 ‐0 A008 ‐0 A009 ‐0 A010 ‐0 A011 ‐0 A012 ‐0 A013 ‐0 A014 ‐0 A015 ‐0 A016 ‐0 A017 ‐0 B0 0 1 ‐0 B0 0 2 ‐0 B0 0 3 ‐0 B0 0 4 ‐0 B0 0 5 ‐0 B0 0 6 ‐0 B0 0 7 ‐0 B0 0 8 ‐0 B0 0 9 ‐0 B0 1 0 ‐0 B0 1 1 ‐0 B0 1 2 ‐0 B0 1 3 ‐0 B0 1 4 ‐0 B0 1 5 ‐0 B0 1 6 ‐0 B0 1 7 ‐0 20091214(3M)中 20091214(3M)晚 20091214(3M)夜 18.000 20.000 22.000 24.000 26.000 28.000 30.000 A 001 ‐0 A 002 ‐0 A 003 ‐0 A 004 ‐0 A 005 ‐0 A 006 ‐0 A 007 ‐0 A 008 ‐0 A 009 ‐0 A 010 ‐0 A 011 ‐0 A 012 ‐0 A 013 ‐0 A 014 ‐0 A 015 ‐0 A 016 ‐0 A 017 ‐0 B 001 ‐0 B 002 ‐0 B 003 ‐0 B 004 ‐0 B 005 ‐0 B 006 ‐0 B 007 ‐0 B 008 ‐0 B 009 ‐0 B 010 ‐0 B 011 ‐0 B 012 ‐0 B 013 ‐0 B 014 ‐0 B 015 ‐0 B 016 ‐0 B 017 ‐0 20091214(4M)中 20091214(4M)晚 20091214(4M)夜
圖二 2009/12/14 各高度測點溫度於不同時段(中午、晚上及深夜)變化圖(縱軸為
溫度℃、橫軸為測點編號)
6
三、研究成果發表情況與後續研究
本研究經過十個月的研究過程,目前已經完成一篇國際研討會的論文發表(附件
一),並且預計將在 2010 年將完整成果發表於國內研討會及進行期刊論文投稿。
三篇論文之題目為:
1. A THERMAL ENVIRONMENT INVESTIGATION OF THE URBAN STREET
CANYON IN A HOT AND HUMID CITY, TAICHUNG CITY, TAIWAN. (The
seventh International Conference on Urban Climate, 29 June - 3 July 2009,
Yokohama, Japan)
2. 都市街道熱環境之分析-以台中市為例(預計投稿 2010 國內研討會)
3. 都市街道與熱環境之關係(預計投稿期刊論文)
A THERMAL ENVIRONMENT INVESTIGATION OF THE URBAN STREET
CANYON IN A HOT AND HUMID CITY, TAICHUNG CITY, TAIWAN.
Chen-Yi Sun*1, Soushi Kato**, Wen-Pei Sung*, Hsien-Te Lin†, Fu-Jen Wang*, Wen-Sheng Ou**** National Chin-Yi University of Technology, Taichung, Taiwan; ** National Institute for Environmental Studies, Ibaraki, Japan; † National Cheng Kung University, Tainan, Taiwan; *** Chia-Nan University of Pharmacy and
Science, Tainan, Taiwan.
Abstract
To estimate the impact of street geometry (H/W ratio), urban vegetation and building density on thermal environment in urban street canyon in hot and humid region, transect data were used to analyze the relation between three factors and air temperature in two streets in Taichung City, Taiwan. In this study, air temperature data were collected by transects on 4 different level heights (100, 200, 300, 400 cm) in two streets; meanwhile, street H/W ratio, urban vegetation and building density which were calculated by GIS data were used to represent the environment condition of 34 locations in two streets. The Analysis result shows that the air temperature in urban street canyon strongly correlated with three factors, Street H/W Ratio, Vegetation and Building Density respectively. In conclusion, this study demonstrates that increasing vegetation and decreasing building density are the important strategies to diminish the street warming and to create the comfort thermal environment in urban street canyons.
Key words: urban canyon, vegetation, building density, H/W ratio
1. INTRODUCTION
As urbanization progresses, the “heat island effect” problem is mainly aggravated because of the reduced density of green vegetation and increased building in the urban environment. Therefore, how to diminish heat island effect and to keep urban area stay in cool becomes a very important issue for urban environment researchers. Rosenfeld et al. study in alleviating the heat-island problem, believe in a three-pronged strategies beyond microclimate below trees: cool roofs, cool pavements, and vegetation for evapotranspiration (Rosenfeld et al., 1995). According to the result of one earlier study, vegetation surfaces show lower radiative temperatures around 20 K than other inanimate ones of the same color (Wilmers, 1988). The study by Shashua-Bar and Hoffman also indicated that the vegetation cooling effect in all study sites was 2.8 K, ranging from as low as 1 K in a street with heavy traffic to as high as 4 K in the smallest garden (Shashua-Bar and Hoffman, 2000). This study also demonstrated that vegetation and traffic condition have the strong influence on the temperature in the street. On the other hand, urban geometry and thermal properties of urban surfaces have been found to be the two main parameters influencing urban climate (Oke, 1987; Oke et al., 1991). The ratio between the height of buildings (H) and the distance between them (W) influences the amount of both incoming and outgoing radiation. The nocturnal heat island has been shown to increase with H/W ratio since the net outgoing long-wave radiation decreases due to reduced sky view factor. Furthermore the more buildings the more anthropogenic heat was released from the buildings. Moreover, high thermal capacity of urban building also contributes to the heat island effect and ambient air temperature as a large part of the incoming radiation during the day is stored in building surface materials and not released until the night.
Since urban vegetation, building density and H/W ratio have a strong influence on the microclimate around buildings in the urban street, the aim of this paper is to investigate the influence of these three parameters, vegetation density (VD), building density (BD) and H/W ratio, on microclimate at street level in a hot and humid city. This is done by comparing urban canyons in two streets in Taichung City, Taiwan in winter, 2008-09. The study is base on field measurements of air temperature and GIS data.
2. METHDOLOGY
2.1. Selection of measurement sites
Taichung city (24o 08’ N, 120o 41’ E) is located in the middle of Taiwan (Fig. 1). The climate is characterized by
hot and humid summers and cold winters. The annual average temperature is 23 °C and the annual rainfall is 1700 mm. Taichung city was chosen for this study because its weather condition and street character can represent the typical city type of Taiwan. In both streets(Fig. 2), measurement sites were chose in order to
1Corresponding author: Department of Landscape Architecture, National Chin-Yi University of Technology
Address: 35 Lane 215 Chung-Shan Rd. Sec. 1, Taiping City, Taichung County 411 Taiwan, R.O.C. E-mail: [email protected]
The seventh International Conference on Urban Climate, 29 June - 3 July 2009, Yokohama, Japan
represent the difference in street geometry (vegetation density (VD), building density (BD) and H/W ratio) with the same orientation (East-West).
2.2. Field measurements
Transects were conducted three times throughout the day in order to measure the UHI effect over the diurnal period. The data of this study consisted of 9 transects and the use of three fixed stations in December, 2008, January and February 2009.Transects were run on December 11, 2008, January 15 and February 7 2009 during the diurnal cycle centered on 1400, 1800, and 2200 LST and over a prescribed route. All transects had been done within two hours in similar traffic condition and by the same route. The thermo recorder had been set for collecting data at 1, 2, 3, and 4 meter height. The weather condition of three measurement days is as Table 1.
2.3. Vegetation density, building density and H/W ratio calculations
In this study, on the one hand, vegetation density and building density surrounding every measuring point was evaluated using the GIS data (Fig. 3). On the other hand, the H/W ratio was calculated by equation (1) (Fig. 4).
∑
×∑
= Hi Di Di W
W
H/ ( )/( )/ (1)
Where H is the height of buildings and W is the distance between buildings (street width).
Fig.1 The location of Taichung City and study area
Fig.2 Measurement point location of two streets (zmeasuring points)
ÕStreet A
ÕStreet B
The seventh International Conference on Urban Climate, 29 June - 3 July 2009, Yokohama, Japan
Fig.3 The calculation samples of building density (BD) (left) and vegetation density (VD) (right)
Fig.4 The calculation method of H/W ratio Table 1 The weather condition of three measuring days
Tempe. Dew point RH Speed(Ave.)Wind Speed(Ave.)Max Wind sunshinehours cloudiness Insolation Dec. 11 2008 19.1 13.0 70.1 1.3 3.6 9.9 0.0 15.2 Jan. 15 2009 12.7 6.4 67.8 1.1 3.3 9.5 0.0 14.9 Feb. 7 2009 19.1 15.2 78.8 1.3 3.4 9.1 2.3 16.3 3. RESULT
3.1. The relationship between Air temperature and vegetation density (VD)
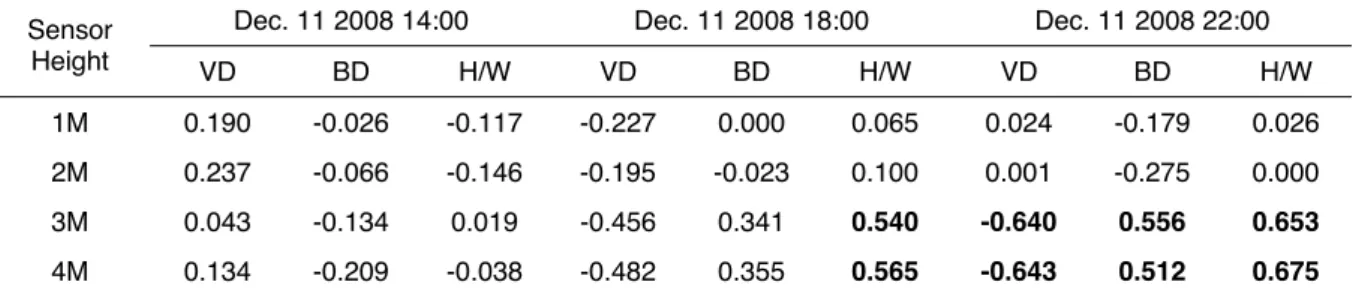
By day, the relationship between air temperature and vegetation density were not significant in this study, because the air temperature was strongly influenced by asphalt, sunlight, shadow and traffic. In the night, the significant coefficient correlations were found at 3 and 4 meter height both on December 11, 2008 and January 15, 2009 (Table 2 and 3). It means that even the vegetation doesn’t provide evaporation to cool the ambient environment during the night; the vegetation land is still cooler than other kinds of land-covers such as concrete and asphalt.
3.2. The relationship between Air temperature and building density (BD)
In this study, after sunset, the significant coefficient correlations between air temperature and building density were found at 3 and 4 meter height both on December 11, 2008 and January 15, 2009 (Table 2 and 3). It means that building started to release heat and caused ambient air temperature high after sunset.
3.3. The relationship between Air temperature and H/W ratio
During the night, the nocturnal air temperature in urban canyon has been shown to increase with the H/W ratio since the net outgoing long-wave radiation decreases and more anthropogenic heat was released from buildings. The positive coefficient correlations between air temperature and H/W ratio showed H/W play an important role in
width(W)
∑
∑
× = Hi Di Di W W H/ ( )/( )/ D4 D5 H4 H5The seventh International Conference on Urban Climate, 29 June - 3 July 2009, Yokohama, Japan
reheat street thermal environment after sunset. The high H/W ratio situation also affects the wind fluid which may take away the heat from streets.
4. CONCLUSIONS
The results of this paper show a clear relationship between street geometry and air temperature at street level. When combining all the environmental parameters influencing thermal environment, the lowest nocturnal temperature occurred in somewhere which has low building density, H/W ratio and high vegetation density. This research is the first one of a serial urban canyon researches. For the further study, the tasks are some analyses which can find the important factors influencing street thermal environment and provide some useful strategies for improving heat island in hot and humid city, Taiwan.
Table 2 The correlation coefficient of street components and temperature on Dec. 11 2008
Dec. 11 2008 14:00 Dec. 11 2008 18:00 Dec. 11 2008 22:00
Sensor Height VD BD H/W VD BD H/W VD BD H/W 1M 0.190 -0.026 -0.117 -0.227 0.000 0.065 0.024 -0.179 0.026 2M 0.237 -0.066 -0.146 -0.195 -0.023 0.100 0.001 -0.275 0.000 3M 0.043 -0.134 0.019 -0.456 0.341 0.540 -0.640 0.556 0.653 4M 0.134 -0.209 -0.038 -0.482 0.355 0.565 -0.643 0.512 0.675
Table 3 The correlation coefficient of street components and temperature on Jan. 15 2009
Jan. 15 2009 14:00 Jan. 15 2009 18:00 Jan. 15 2009 22:00
Sensor Height VD BD H/W VD BD H/W VD BD H/W 1M 0.136 -0.233 0.026 -0.172 0.092 0.213 -0.322 0.232 0.267 2M -0.049 -0.116 0.082 -0.358 0.236 0.327 -0.455 0.293 0.431 3M -0.198 0.032 0.226 -0.410 0.253 0.464 -0.600 0.475 0.619 4M -0.205 0.053 0.192 -0.451 0.290 0.492 -0.638 0.509 0.582
Table 4 The correlation coefficient of street components and temperature on Feb. 7 2009
Feb. 7 2009 14:00 Feb. 7 2009 18:00 Feb. 7 2009 22:00
Sensor Height VD BD H/W VD BD H/W VD BD H/W 1M 0.222 -0.100 -0.131 -0.161 0.151 0.229 -0.074 0.147 0.163 2M 0.177 -0.047 -0.152 -0.271 0.281 0.322 -0.234 0.142 0.204 3M 0.105 -0.059 -0.144 -0.386 0.366 0.545 -0.222 0.210 0.250 4M -0.011 0.041 -0.011 -0.375 0.371 0.417 -0.332 0.304 0.327 ACKNOWLEDGMENTS
The support of National Science Council (project NSC98-2218-E-167-002 and NSC97-3114-E-167-001), Republic of China (Taiwan), is gratefully acknowledged.
References
Oke T.R., 1987. Boundary layer climate. London: Routledge.
Oke T.R., Johnson G.T., Steyn D.G., Watson I.D., 1991. Simulation of surface urban heat islands under ideal conditions at night. Part 2. Diagnosis of causation. Boundary-Layer Meteorology, 56, 258-339.
Rosenfeld A.H., Akbari H., Bretz S., Fishman B.L., Kurn D.M., Sailor D., Taha H., 1995. Mitigation of urban heat islands: materials, utility programs, updates, Journal of Energy and Buildings, 22, 255-265.
Shashua-Bar L., Hoffman M.E., 2000. Vegetation as a climatic component in the design of an urban street,
Energy and Buildings, 31, 221-235.
Wilmers F., 1988. Effect of vegetation on urban climate and buildings, Journal of Energy and Buildings, 15-16, 507-514.
The seventh International Conference on Urban Climate, 29 June - 3 July 2009, Yokohama, Japan