國 立 交 通 大 學
電子工程學系電子研究所
碩 士 論 文
奈米碳管與錳氧化物奈米複合物
超高電容器的製作與其特性之研究
Fabrication and Characterizations of
Carbon Nanotube and Manganese Oxide
Nanocomposite Supercapacitor
研 究 生:洪政漢
指導教授:曾俊元
奈米碳管與錳氧化物奈米複合物
超高電容器的製作與其特性之研究
Fabrication and Characterizations of
Carbon Nanotube and Manganese Oxide
Nanocomposite Supercapacitor
研 究 生:洪政漢 Student: Jeng-Han Hung
指導教授:曾俊元 Advisor: Tseung-Yuen Tseng
國立交通大學 電子工程學系電子研究所
碩 士 論 文
A Thesis
Submitted to Department of Electronics Engineering and Institute of Electronics
College of Electrical and Computer Engineering National Chiao Tung University
in partial Fulfillment of the Requirements for the Degree of Master
in Electronics Engineering July 2009
Hsinchu, Taiwan, Republic of China
i 奈 米 碳 管 與 錳 氧 化 物 奈 米 複 合 物 超 高 電 容 器 的 製 作 與 其 特 性 之 研 究
學生:洪政漢 指導教授:曾俊元 博士
國立交通大學
電子工程學系電子研究所
摘
要
本論文探討利用氫離子作為表面活性劑,藉由電鍍製程製備出高效能
與高循環次數的超級電容。超級電容是一種具有高比電容值、高功率密度、
快速充放電等特性的儲能元件,其中藉由表面氧化物的價數變化達到儲能
效果的稱為法拉第電容。目前以電鍍法或溶膠凝膠法製作法拉第電容通常
需要高分子的表面活性劑,由於高分子在法拉第電容屬於阻值較大的物質,
使得法拉第電容在高功率操作時有著嚴重的衰減。
本實驗藉由氫離子取代有機高分子來作為氧化錳的表面活性劑,使得
氧化錳與奈米碳管複合材料的表面帶有正電荷,利用電鍍的方式在陰極沉
積氧化錳與奈米碳管,由於少了高分子的影響使得超級電容在高功率下的
衰減有效的減少。另外,本實驗也藉由加熱製程去有效的提升超級電容的
比電容值,並且有效改善了法拉第電容在高循環次數下嚴重衰減的情形。
ii
Fabrication and Characterizations of Carbon Nanotube and Manganese Oxide
nanocomposite supercapacitor
Student:Jeng-Han Hung Adviser:Prof.Tseung-Yuen Tseng
Department of Electronics Engineering and Institute of Electronics
National Chiao Tung University
Abstract
In this thesis, a high electrochemical performance and stability
supercapacitor was produced by electrophoretic deposition (EPD) method using
H
+ion as surfactant to ionize the surface of manganese oxide. Supercapacitors
are an energy storage device with high specific capacitance, high power density,
and quickly charge/discharge time. Psuedocapacitor is one classification of
supercapacitors which stores charge by changing the oxidation state of transition
metal oxide. At present, polymer, a high charge transfer resistant material, is
required as surfactant in EPD or sol-gel process leading to deadly recession of
specific capacitance at high power density operating.
We substitute H
+ion for polymer as surfactant of manganese leading
MnO
x/CNT coaxial composite material to be ionized with positive charge so
that they can be deposited on the cathodic electrode by EPD method. The
situation of capacitance degradation at high scanning rate is improved due to
without polymer. Besides an annealing step is introduced to this experiment to
enhance the specific capacitance and reduce the degradation of capacitance after
a long cycling test.
iii
誌
謝
在這兩年碩士生涯裡,我首先要感謝指導教授曾俊元老師悉心的
指導,並且在實驗中給了我明確的方向與目標,實驗室中也提供了許
多儀器設備,讓我能夠順利的進行實驗。也要感謝老師時常在 meeting
時教誨著我們實驗的態度與做人處事的道理,讓我學習到許多專業外
的知識。再來要感謝洪崇榮與姚奕全兩位學長在本論文上的相助,有
著你們平時給的指導與意見,時常不辭辛勞陪我討論與材料分析,我
才能夠順利完成本論文。
謝謝林孟漢、王聖裕、吳明錡、李岱螢、黃竣揚、李盈賢、葉昱
廷等學長在課業上的指導,黃泰源、藺以煒兩位同學一起互相學習,
還有聖和、宗翰、家瑋學弟們平時的玩樂。因為有大家的陪伴,讓我
的碩士生涯更佳的精彩與完整。
最後我要感謝我的家人,謝謝我的父母長期不辭辛勞的工作,努
力的栽培我,讓我可以沒有負擔的一直念書。謝謝我的姊姊一直引領
著我成長。因為你們的付出與關懷,才能成就今日的我。
iv
Contents
Chinese Abstract………... English Abstract………... Acknowledgement………... Contents………... Table Captions………... Figure Captions………. Chapter 1 Introduction 1.1 Introduction to Supercapacitors………..1.1.1 The Characteristic of Supercapacitors……….
1.1.2 The Classification of Supercapacitors……..……….………..
1.2 Supercapacitors Materials………...
1.2.1 Active Carbons……….
1.2.2 Transition Metal Oxides………...
1.3 The Processes of Supercapacitors………...
1.3.1 Chemical Vapor Deposition……….
1.3.2 Hydrothermal Method………..
1.3.3 Sol-gel Method……….
1.3.4 Electrophoretic Deposition Method……….
1.4 Electrochemical Characteristic Measurement
………
1.4.1 Electrolyte……… 1.4.2 Measurement Method……….. i ii iii iv vii viii 1 1 2 3 5 5 6 8 8 9 9 10 11 11 13v
Chapter 2 Experiment Details
2.1 Experiment Process Flow………
2.2 Current Collector Preparation……….
2.2.1 Carbon Nanotubes Purification………
2.2.2 Nickel Acid Treatment……….
2.2.3 Carbon Nanotubes Electrophoretic Deposition………
2.3 Active Material Synthesis………...
2.3.1 MnOx nanopowder………...
2.3.2 MnOx/CNT Composite……….
2.4 Supercapacitors Preparation………
2.5 Measurements and Analyses………...
2.5.1 X-Ray Diffraction………
2.5.2 Scanning Electron Microscope………
2.5.3 Field Emission Transmission Electron Microscope……….
2.5.4 X-ray Photoelectron Spectroscopy………...
2.5.5 BET Analysis………...
2.5.6 Thermal Gravimetric Analysis……….
2.5.7 Electrochemical Properties Measurements………...
Chapter 3 Results and Discussion
3.1 Supercapacitors Fabrication………
3.1.1 Current Collectors Fabrication……….
3.1.2 Electrophoretic Deposition of Active Material………
3.2 Material Analyses of MnOx Nanopowder and MnOx/CNTs Composite………….
3.3 Electrochemical properties of MnOx nanopowder and MnOx/CNT composite…..
3.3.1 Cyclic Voltammerty Measurement………...
24 24 25 25 26 26 27 27 27 28 29 29 29 30 30 31 32 32 37 37 38 39 39 41 41
vi
3.3.2 Stability Test……….
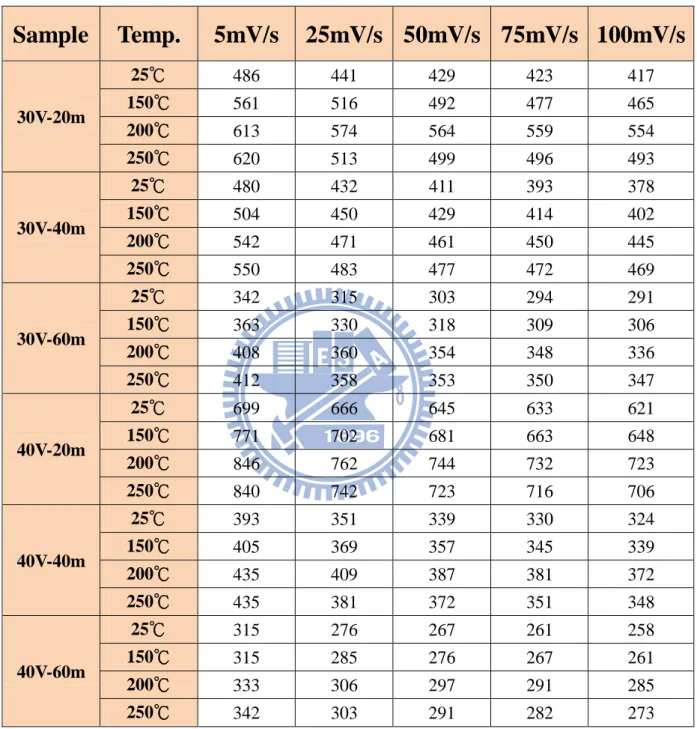
3.4 Different Deposition Time and Voltage of MnOx/CNT composite……….
3.5 Thermal annealing of MnOx/CNT composite……….
3.5.1 Cyclic Voltammerty Measurement………...
3.5.2Material Analyses………. 3.5.3 Impedance Analysis………. 3.5.4 Stability Test………. Chapter 4 Conclusion Reference 42 44 45 45 46 46 47 70 72
vii
Table Captions
Table 2-1 Table 2-2 Table 2-3 Table 3-1 Table 3-2 Table 3-3 Table 3-4 Table 3-5 Table 3-6 Table 3-7Synthesis of active material………
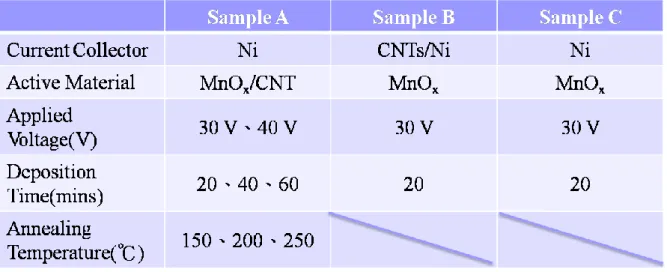
Details of Chemicals used in this experiment………
EPD parameters of all samples in this experiment……….
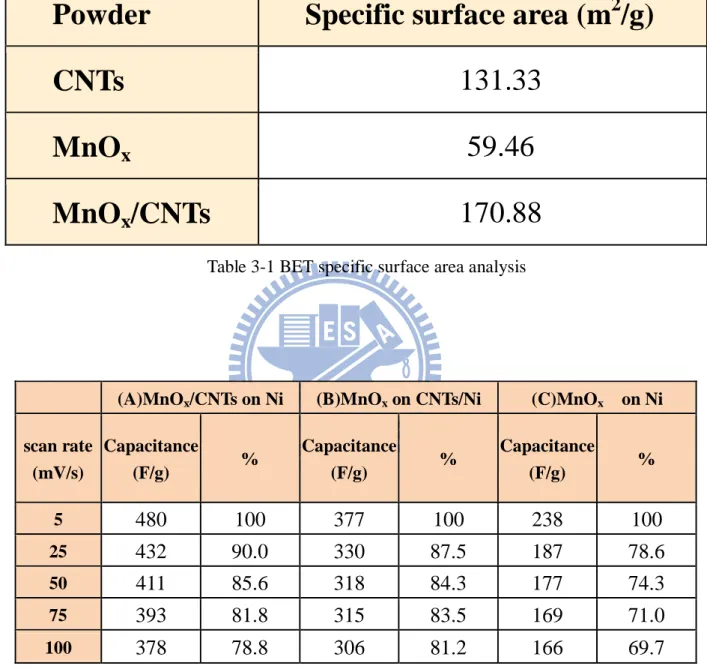
BET specific surface area analysis……….
The specific capacitances of three different structures………...
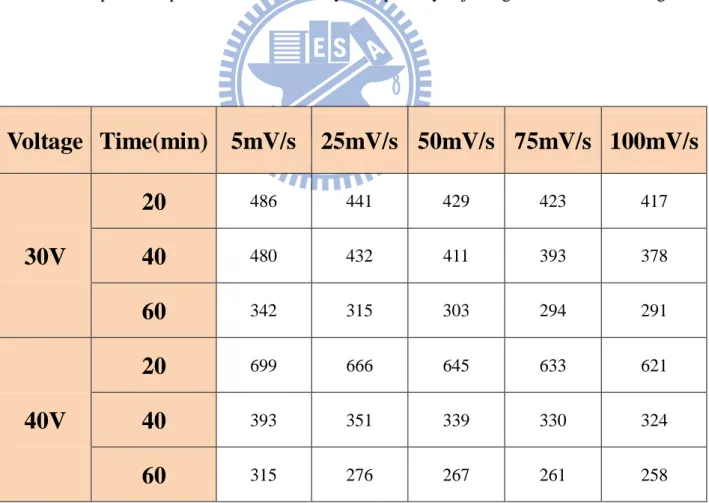
Specific capacitance verses density of deposit by adjusting EPD
time and voltage………..
Specific capacitances of MnOx/CNT composite in various EPD
parameters………...
Specific capacitances of MnOx/CNT composite after annealed for 2
hours………...
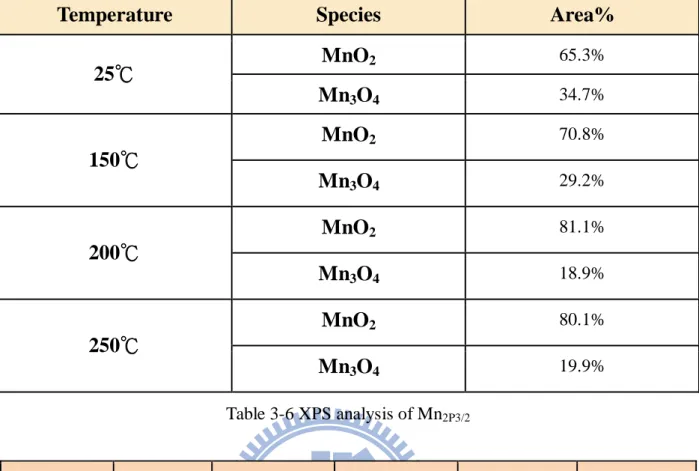
XPS analysis of Mn2P3/2………..
1mA constant current stability test of MnOx/CNT composite
electrodes after annealed for 2 hours………..
34 34 35 48 48 49 49 50 51 51
viii
Figure Captions
Fig.1-1 Fig.1-2 Fig.1-3 Fig.1-4 Fig.1-5 Fig.1-6 Fig.1-7 Fig.1-8 Fig.1-9 Fig.1-10 Fig.1-11 Fig.1-12 Fig.1-13 Fig.2-1 Fig.2-2 Fig.2-3 Fig.3-1 Fig.3-2 Fig.3-3 Fig.3-4 Fig.3-5 Fig.3-6 Fig. 3-7 Fig. 3-8Specific power against specific energy for various electrical energy devices……… electrochemical capacitors a) schematic of a commercial spirally wound double layer capacitor. b) Assembled device. c) A small button cell………... schematic of fuel cell with supercapacitor as the power source module for vehicle……….. schematic view of electric double layer………. Capacitive behavior of pseudocapacitor is composed of a series redox reaction segment………... The area of I-V curve proportional to the operation voltage window HRTEM images of (a) CNT and (b) MnOx/CNT nanocomposite (inset is SAED of MnOx nanoparticles)………. (a)CV curves of the a-MnOx/CNTs/Ni electrode. (b) Variation of specific capacitances of a-MnOx/Ni and a-MnOx/CNTs/Ni electrodes with CV scan rate……….. SEM images of MnO2 and CNT coaxial structure……….
CVs for EPD of MnO2 ceramic and CNT charged by sodium
alginate (a) 2mV/s, (b) 5mV/s and (c) 10 mV/s………. SC versus scan rate (a) with CNT (b) without CNT………... The IR drop in galvanostatic measurement when polarization of current changing………. (a)Nyquist graph and (b)equivalent circuit model of an ideal supercapacitors………... Illustration of the experimental flow……….. Illustration of the current collector fabrication flow……….. Illustration of the electrochemical measurement system……… TEM image of MnOx nanoparticle……….
TEM image of MnOx/CNT coaxial composite………...
Thermal gravimetric analysis for MnOx/CNT composite…………..
SEM image of MnOx/CNT composite on Ni foil………...
SEM image of MnOx on CNTs/Ni foil………...
SEM image of MnOx on Ni foil………..
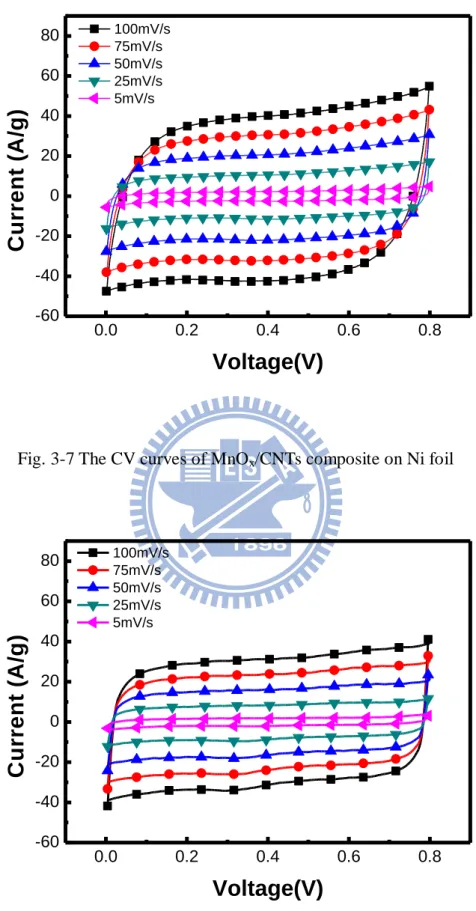
The CV curves of MnOx/CNTs composite on Ni foil……….
The CV curves of MnOx on CNTs/Ni foil………..
17 17 18 18 19 19 20 20 21 21 22 22 23 35 36 36 52 52 53 53 54 54 55 55
ix Fig. 3-9 Fig. 3-10 Fig. 3-11 Fig.3-12 Fig.3-13 Fig.3-14 Fig.3-15 Fig.3-16 Fig.3-17 Fig.3-18 Fig.3-19 Fig.3-20 Fig.3-21 Fig.3-22 Fig.3-23 Fig.3-24 Fig.3-25 Fig.3-26 Fig.3-27 Fig.3-28 Fig.3-29 Fig.3-30
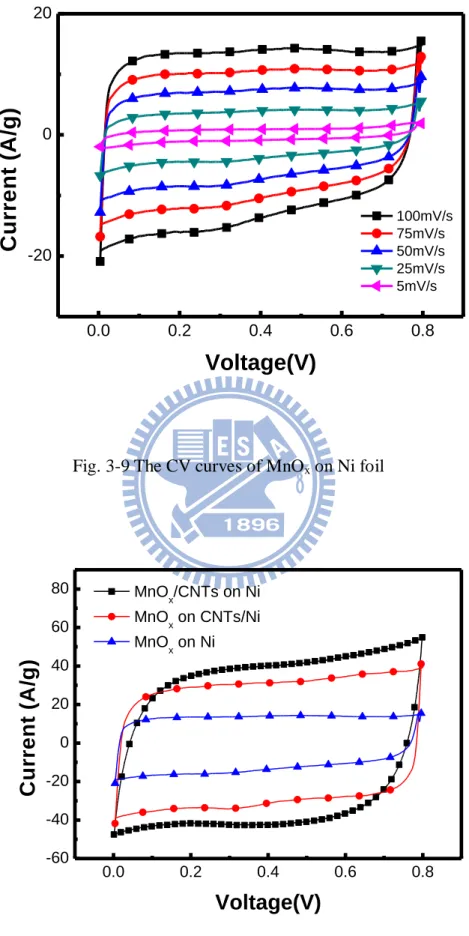
The CV curves of MnOx on Ni foil………
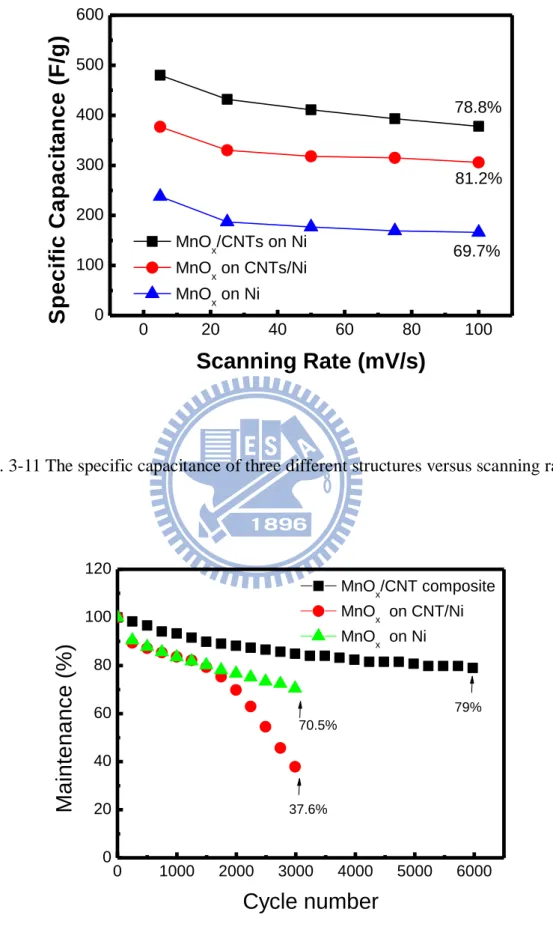
The CV curves of three different structures scanned at 100mV/s….. The specific capacitance of three different structures versus scanning rates………. Stability test of three different structures………... SEM image of MnOx/CNTs composite on Ni foil after 6000 cycles
SEM image of MnOx on CNTs/Ni foil after 3000 cycles…………...
SEM image of MnOx on Ni foil after 3000 cycles……….
Cross section image of (a)30V-20mins (b)30V-40mins (c)30V-60mins (d)40V-20mins (e)40V-40mins (f)40V-60mins by FIB……….. Specific capacitance of MnOx/CNTs composite deposited at 30V…
Specific capacitance of MnOx/CNTs composite deposited at 40V…
The maintenances of specific capacitance of MnOx/CNTs
composite electrodes at different scanning rates…….………. The diagram of specific capacitance at 100mV/s verse the density of deposits……….. Specific capacitance at 100mV/s of MnOx/CNTs composite
deposited at 30V after thermal annealing for 2 hours……… Specific capacitance at 100mV/s of MnOx/CNTs composite
deposited at 40V after thermal annealing for 2 hours………. XRD of MnOx/CNTs composite electrodes after thermal annealing
XPS of MnOx/CNTs composite electrodes after thermal annealing
Impedance analysis of MnOx/CNTs composite electrodes after
thermal annealing……… TEM image of 30V-20mins after 6000 cycles without thermal annealing………. 1mA constant current stability test of MnOx/CNT composite
electrodes without thermal annealing………. 1mA constant current stability test of MnOx/CNT composite
electrodes after 150 for 2 hours……….. 1mA constant current stability test of MnOx/CNT composite
electrodes after 200 for 2 hours……….. 1mA constant current stability test of MnOx/CNT composite
electrodes after 250 for 2 hours………..
56 56 57 57 58 58 59 60 61 61 62 62 63 63 64 64 65 65 66 67 68 69
1
Chapter 1
Introduction
1.1 Introduction to Supercapacitors
In recent years energy storage devices have became more important
because the electronics industry has been developed rapidly. A high capacity
and small size energy storage devices are required in many applications -
such as telecommunication devices, Uninterruptible Power Supply, portable
electric product, and electric/hybrid vehicles. Batteries and capacitors, plenty in
our life, are two kinds of conventional energy storage devices. Batteries can
store large amount of energy in a small volume, but short lifetime and low
power density which causes a long charge/discharge time have been problems
with most type of them. On the contrary, capacitors have advantages of high
power density and long lifetime but low energy density. In order to satisfy the
requirements of technology in the present age, we need to develop high energy
capacity, high power density and long lifetime energy storage devices.
Supercapacitors, similar to a regular capacitor in operation, are called
electrochemical capacitors using electrochemical reaction on the material of
electrodes to store energy. The characteristics of supercapacitors are between
batteries and capacitors: The power density and lifetime of them are much
2
of capacitors. Supercapacitors are a potential device that has high storage
density, high power density and long lifetime and they can be combined with or
substituted for traditional storage devices in many applications. The
relationship of these three kinds of energy storage devices is illustrated in
Fig.1-1 1.
1.1.1
The Characteristic of Supercapacitors
Supercapacitors, as an energy storage device with high power density and
high energy density2,3, could be used in power source application such as flashlight of digital camera, starter device for fuel cell and power supply for
electric vehicles during acceleration4,5. The charge/discharge rate of supercapacitors(>1kW/g) is more about 1000 times than that of batteries and
the energy density of them is more about 1000~10000 times than that of
capacitors. Addition to these, supercapacitors are easily assembled with other
electronic devices and they can be fabricated on flexible substrate (Fig.1-2)
which make high density package possible 6,7.
One of supercapacitors application is hybrid capacitors8, which combines a supercacitor with a battery so that they can benefit from both the
supercapacitors and the batteries’ properties. With high power density of
supercapacitors, the combination of batteries and supercapacitors as power
supplier systems will extend the lifetime of batteries and exhibit excellent
performance. Take electric vehicles for example, the batteries and the
supercapacitors are parallel in power supplier system. Fig.1-3 presents a
schematic of a hybrid system. Batteries provide energy for vehicles and charge
3
high power which is supplied from supercapacitors protecting battery from a
large current flowed. Power supplier systems with supercapacitors can provide
vehicles sufficient power all the time and extend batteries’ lifetime because the
damage, caused by fast discharge in batteries when accelerating, is eliminated.
1.1.2
The Classification of Supercapacitors
According to energy storage mechanisms, supercapacitors can be divided
into two different types. First is based on the electric double layers in high
surface area materials such as active carbon or carbon nanotubes. Second are
pseudocapacitors that have a faradic charge exchange reaction on the active
materials of electrode.
Ⅰ.
Electric double layers capacitors
Electric double layer capacitors (EDLCs) are an electrochemical
capacitor which can store much more energy than conventional capacitor and
offer much higher power density than batters’. The first patent of electric
double layer capacitors was filed in1957 by Becker 1, who used carbon increasing surface area coated on metallic current collector in a sulfuric acid
solution. The charge storage mechanism, as shown in Fig.1-4, is using
reversible physical adsorption of ions in the electrolyte by electrostatics 9,10. There is no any faradic reaction in charge/discharge process, so the lifetime of
EDLCs is much longer than psuedocapacitors’. When applying a voltage on
electrode, charges separate and accumulate on polarization at the
electrode-electrolyte interface, forming helmholtz layer and Guoy layer storing
4
diffusion layer whose concentration of ions decays from helmoholtz layer to
electrolyte. These ions layers and electrode with opposite charge work as two
parallel conductor in conventional capacitor. Therefore EDLCs have capacitive
behaviors.
According to Helmholtz’s description in 1853, the capacitance C can be written as following:
d A
Cr0 [Eq.1-1]
εr : the electrolyte dielectric constant
ε0 : the dielectric constant of vacuum
A : the electrode surface area
d : the effective thickness of the double layer
By equation [1-1], increasing the electrode surface area or decreasing the
effective thickness of the double layer will increase the capacitance of EDLCs.
But the effective thickness of the double layer in electrolyte is about several
nanometers, it is arduous to reduce the effective thickness. Therefore using
active carbon with high surface area or carbon nanotubes to extend the area of
5
Ⅱ. Pseudocapacitors
The charge storage of pseudocapacitors is not only using electric double
layer but also transferring ions of electrolyte to active material on electrode
2,6,11
. That fast and reversible redox reactions occur at the surface of active
materials allows pseudocapacitors to store more charges than EDLCs. Fig.1-5
shows that the charging /discharging behavior of pseudocapacitors is composed
of a serial of redox reactions which are absorbing/desorbing ions on active
materials. The I-V curve of pseudocapacitors is similar to conventional
capacitors and the capacitance can remain a constant in different operation
voltages as shown in Fig.1-6. But because redox reactions are used,
pseudocapacitors, like batteries, often suffer from a lack of stability during
cycling. So it has been a very important topic of how to extend the stability of
pseudocapacitors and remaining their high capacitance in recently years.
1.2 Supercapacitors Materials
1.2.1
Active Carbons
Because the primary mechanism to store charges of EDLCs is physical
ions absorption, the key to reaching high capacitance is using high specific
surface area material with high conductivity as electrodes. There is a lot of
material that could provide high surface area such like active carbon, fiber,
carbon fabrics, templated and carbide-derived carbons, carbon nanotubes,
onions and nanohorns carbon. Active carbons 12,13, like carbon black, are the most widely used material for EDLCs and because of their porous and high
6
surface area and moderate cost.
Carbon nanotubes are a potential material for EDLCs due to their high
specific surface area and excellent conductivity 14. Untreated carbon nanotubes have a lower capacitance than active carbon, but it can be increased by grafting
oxygen rich groups which can help carbon nanotubes to absorb more ions from
electrolyte15. Unfortunately, oxygenated groups are favor place to chemically react with protons, resulting in increasing series resistances and degeneration
of capacitance.
1.2.2
Transition Metal Oxides
Pseudocapacitors use the fast redox reaction on the active material to
store charges. Transition metal oxide is the most seen active material which
have an unfilled d-space so that they can exhibit two or more oxidation states.
A lot of trasition metal oxides have been investigated for supercapacitors
application such like CuO16, Fe2O3 17-19, Co3O4 20-22, NiO 23-25 , RuO2 26-28,
MnO2 29-40, V2O5 41-43 and etc. None of these oxides are used in commercial
production and they are still in lab-scale research. The multi-state of oxidation
allows a metal atom to store two or more charges. This is the reason why
pseudocapacitors have a higher capacitance than EDLCs. If the metal oxide has
a good crystalline structure, it is difficult for ions to diffuse into the inside of it.
Because the effective metal oxide is limited to the surface, the inner oxide with
high resistance causes cyclic voltammetry loop hysteresis, affecting the quality
of charge/discharge behavior of supercapacitors. Amorphous metal oxide with
hydrate has a thicker effective layer. Ions can be transferred from electrolyte
7
groups in oxides are suitable sites for ions to insert, so that the capacitance can
be raised 44-46.
Ruthenium oxide, RuO2, has been widely investigated in the past 40
years because it is conductive and has three distinct oxide states (Ⅱ, Ⅲ, Ⅳ)
within 1.2 V, which is below the decomposed voltage of water26,27. The reaction of charge storage can be presented as following:
surface x x surface xH xe RuO OH RuO ) ( ( ) ) ( 2 2 ,
0
x
2
[Eq.1-2]RuO2 has advantages of fast and reversible electron transfer with absorption of
protons on the surface of it. Pataka reported that using electrophoretic method
deposits a RuO2 layer as a supercapacitor and the specific capacitance is as
high as 650F/g27. But ruthenium is too basedexpensive to be commericially attracted and the electrolyte of RuO2 -based supercapacitors is sulfuric acid
which is dangerous for the environment.
Manganese oxide, MnO2, is a promising material because of low cost,
high electrochemical activity and more friendly environmental nature than
RuO2. Manganese can be present in three different valence states and its oxides
are highly complex. The storage mechanism is the insertion and extraction of
protons or alkali metal cations such as Li+, Na+, and K+. The reactions can be written as following surface x x surface xC xe MnO OC MnO ) ( ( ) ) ( 2 2 ,
0
x
2
[Eq.1-3]8
Where C+ = H+, Li+, Na+, and K+47. According to theoretical calculation, the theoretical capacitance of manganese oxide reach to 1370F/g form Mn(II) to
Mn(IV)38; however, the conductivity of MnO2 is a vital problem, because of the
high resistance of bulk manganese oxide causing the capacitance in experiment
behind the theorem. Lee reported that the capacitance can be enhanced to
418F/g by combining MnO2 with CNTs to extend the surface area33. This
composite material, as shown in Fig.1-7, can increase the conductivity of
electrode and the stability during cycling [Fig.1-8].
1.3
The Processes of Supercapacitors
1.3.1
Chemical Vapor Deposition
Chemical vapor deposition (CVD) is a chemical process used to produce
high-purity, high-performance solid materials. This technique is extremely
widely used in VLSI to deposit thin films, such as dielectric, semiconductor
and metal layers. A number of forms of CVD are in widely use and are
frequently referenced in the literature. These processes differ in the means by
which chemical reactions are initiated and process conditions such as
Atmospheric pressure CVD, Low Pressure CVD, Plasma Enhanced CVD, and
etc. In a typical CVD process, precursor gases with high energy will be
decomposed into radicals that diffuse into the surface of substrate and react to
produce the desire and continuous deposit. Byproduct is also produced. It is
very important that the byproduct must be gas so that they can diffuse back to
the flow gas to be carried out. Otherwise byproduct remained on the substrate
9
templates to successfully deposit high aligned coaxial MnO2 and CNTs on Au
electrode. The structure with high surface area allowing MnO2 to trap more Li+
ions is shown in Fig.1-937.
1.3.2
Hydrothermal Method
Hydrothermal method utilizes chemical reaction in solution with different
temperature and pressure in a sealed autoclave. Because the boil point of water
can be changed by environment’s pressure, the process temperature can be
chosen above 100℃ to 374℃ by adjusting a appropriate pressure of autoclave.
Hydrothermal synthesis has been an interesting method to produce materials
with different nanoarchitectures such as nanorod, nanowires, nanoclakes, and
etc. the advantage of hydrothermal method is the ability to control the
nanostructure by properly choosing the temperature or time of the reaction or
the active fill level in the pressure vessel or solvent used. Hashemzdadeh and
his co-workers reported that different crystalline phases and nanostructures of
MnO2 can be obtained by hydrothermal method in proper experimental
parameters we discussed above48.
1.3.3
Sol-gel Method
Sol-gel method is a simple process to fabricate the electrode of
supercapacitors32,36,40. The recipe of well-mixed active gel is about 80wt% nanopowder of MnO2, 15wt% active carbon, and 5wt% binder, such as PTFE
and PVDF, in organic solution. After coating the gel into metal electrode and
burning the binder out by thermal annealing, the supercapacitor can be
10
material can’t be burnt out completely, so there is a large IR drop during charge
and discharge that reduces the performance of supercapacitors.
1.3.4
Electrophoretic Deposition Method
Electrophoretic deposition (EPD) is a process that uses electrical field to
attract ions from solution to electrode where a faradic reaction takes place and
deposit desired layer such as metals and oxides. The advantages of EPD are
easy process, low cost for raw materials and equipment, fast deposition rate
and safety when operating, therefore EPD has been widely researched for
supercapacitors fabrication in recently years. The main technique modes in
anodic deposition by EPD are potentiostatic29, galvanostatic30, and cyclic voltammetric method31. Ions with two positive charge such as Manganese Acetate (Mn(CH3COO)2) and Manganese sulfate (MnSO4) is the electrolyte for
EPD process to deposit MnO2 thin film. Because the grow rate of manganese
oxide is varied in different plane direction, we can form many structure of
manganese oxide like nanorods, nanoflakes, and nanoneedles by choosing
different technique mode or combining them.
Because Electrophoretic deposition from ions is a fast reaction forming a
thick and dense film, it is difficult to reach to high capacitance and maintain the
stability. Deposition of ceramic by EPD is a possible solution to fabrication a
high performance supercapacitors. However EPD of ceramic present difficult
since it is hard to stable a well ceramic suspension. Particular surface charge is
required for stability in suspension49.
11
CNTs absorbing some surfactants which are polymer such as sodium alginate35, polyethylene34, and dopamine39 in solution can have positive charge in their surface so that they can deposit into electrode directly without any redox
reaction by EPD method. This method provides a new way to fabricate
supercapacitors that we can select and produce the desired structure and
morphology of MnO2 nanoparticles before deposited. The characteristics of
cyclic voltammetry measurement and capacitance at different scanning rate are
shown in Fig.1-10 and Fig.1-11. The result indicates that the capacitance
decays deadly at high scanning rate because of the polymer surfactants that are
a high charge transfer resistant substance. Therefore, we assume that finding a
non-polymer and high conductive surfactant will improve the quality and
stability of supercapacitors.
1.4 Electrochemical Characteristic Measurement
1.4.1
Electrolyte
The character of electrolyte when measuring is providing sufficient
cations (H+, Li+, Na+, K+ ) for supercapacitors to store charge by fast redox reaction or electric double layer mechanism. In order to decrease the series
resistance and improve the stability of supercapacitors, electrolyte must be not
only high conductive but also stable to the package material of electrode. The
radius of ions is a critical issue for supercapacitors. The smaller ions can
diffuse quickly from electrolyte to the surface of electrode and penetrate to
active oxide much deeper than large ions. Hydrogen ions provided from
12
RuO2, but considering its damage to environment, neutral solution is adopted
for supercapacitors application.
The operation of supercapacitors is limited by the electrolyte
decomposition at high voltage. That means the larger and stable electrolyte
voltage window, the higher supercapacitor cell operating voltage. Since the
energy density is proportional to the voltage squared (Eq.1-4.), it is necessary
to develop and design high conducting, stable electrolyte with a wider voltage
windows. 2 2 1 CV Energy [Eq.1-4]
To satisfy many applications in different operating voltage, the electrolyte can
be divided into two types: aqueous and organic solution1.
Ⅰ.
Aqueous Solution
Aqueous solution, such as H2SO4, KOH, Na2SO4, and KCl, has
properties of high conductivity, high power density, low inner resistance. Using
aqueous solution as electrolyte is convenience for supercapacitors and reduces
the cost because the electrode doesn’t need to dry and purify carefully during
fabrication process of supercapacitors. But the decomposed voltage of water is
1.23V which limits the operation voltage of supercapacitors. Moreover, the
application of supercapacitors in aqueous solution can be affected by
temperature because increasing surrounding temperature will decrease the
decomposed voltage of water, which is the upper limitation of voltage
13
Ⅱ.
Organic Solution
Supercapacitors benefit from organic solution with high operation
voltage (2-3V) so that the storage energy is much higher than in aqueous
electrolyte by Eq.1-451. However the maximum power density in organic electrolyte is less than in aqueous because of poor conductivity which causes
supercapacitors lager IR drop while charging and discharging. Organic solution
is very sensitive to water. It is imperative for the process of supercapacitors to
purify and dry strictly that ensures there is no water remained in electrode. The
last but most important disadvantage of organic electrolyte is the price too
expensive. The total cost of supercapacitor cell will be increased.
1.4.2
Measurement Method
The definition of capacitance is ratio of charge (Q) on the electrode to the
operation voltage (V).
V Q
C [Eq.1-5]
In SI units, a capacitance of one farad means that one coulomb of charge
on each conductor causes a voltage of one volt across the device. The lager
capacitance stands for the lager ability to store charge. In supercapacitors we
have to consider that how much capacitance can be contributed by one gram of
14
g
V
Q
C
[Eq.1-6]Where Q is storage charge, V is operation voltage window, g is the weight of
active material and the unit of Q is gram.
There are two technical modes usually used to measure the performance
of supercapacitors, and we will discuss all of these one by one as following.
Ⅰ.
Cyclic Voltammetry Method
Cyclic voltammetry measures the redox current of electrode within a
given voltage range at a constant rate of voltage variation. Capacitance can be
obtained by the following equation (Eq.1-7):
g
V
t
I
g
V
Q
C
[Eq.1-6]In this equation, symbol t, the charging or discharge time, can be calculated
from scanning rate and operation voltage window. Integrating the redox current
and time, we can get the number of storage charge and calculate specific
capacitance.
Cyclic voltammetry is a useful method to estimate the electrochemical
properties of electrode material of supercapacitors. It not only is used to
calculate capacitance but also can identify the characteristic and adequate
operation window for supercapacitors by the shape and the redox peak of
15
electrode is reversible or not can be referred to the symmetry of cyclic
voltammetry and the charge/discharge area.
Ⅱ.
Galvanostatic Measurement
This method is using a constant current to charge and discharge
supercapacitors in a given operation window. It is easy to know the amount of
storage charge from the product of charge/discharge time and the current we
choose. The reversibility of supercapacitors is easy to find out from the ratio of
charge time to discharge and the symmetry of I-t curve. I-t curve also provide
the magnitude of IR drop (Fig.1-12) that is contributed by internal resistance.
Ⅲ.
Impedance Measurement
Electrochemical impedance is usually measured by applying an AC
potential to an electrochemical cell and measuring the current through the cell
from high frequency to low frequency. According to Ohm’s Law, dividing AC
potential by AC current, we can know the magnitude of impedance Z and phase
angle. These information are useful to analysis the interfaces resistance in
measured cell and establish the equivalent circuit model.
The basic model of supercapacitors is a semicircle at high frequency and
a 45° straight line at low frequency as shown in Fig.1-13. The first and second
intercept on ZRe axis denote electrolyte resistance RΩ and charge transfer
resistance Rct respectively. At high frequency, the supercapacitor behavior is in
kinetic control region because ac voltage signal is faster than surface reaction
16
transfer resistance indicating that charge transferring from electrolyte to active
material is easy or not. In low frequency region, the diffusible ability of cation
is the dominated factor that means the charge transfer resistance is less than
diffusion resistance in electrochemical system. We can use a constant phase
element to describe diffusion control region. In an ideal supercapacitor, the
phase of constant element is 45° is also called Warburg element σ assumed
17
Fig.1-1 Specific power against specific energy for
various electrical energy devices 6
Fig.1-2 Electrochemical capacitors a) schematic of a commercial spirally
18
Fig.1-3 Schematic of fuel cell with supercapacitor as the power source module
for vehicle4.
19
Fig.1-5 Capacitive behavior of pseudocapacitor is composed of a series redox
reaction segment6. 0.0 0.1 0.2 0.3 0.4 0.5 0.6 0.7 0.8 0.9 1.0 1.1 -1.0x10⁻³ -5.0x10⁻⁴ 0.0 5.0x10⁻⁴ 1.0x10⁻³ 0.1V 0.2V 0.3V 0.4V 0.5V 0.6V 0.7V 0.8V C ur rent ( A ) Voltage (V)
20
Fig.1-7 HRTEM images of (a) CNT and (b) MnOx/CNT nanocomposite (inset
is SAED of MnOx nanoparticles)33.
Fig.1-8 (a)CV curves of the a-MnOx/CNTs/Ni electrode. (b) Variation of
specific capacitances of a-MnOx/Ni and a-MnOx/CNTs/Ni electrodes with CV
21
Fig.1-9 SEM images of MnO2 and CNT coaxial structure.37
Fig.1-10 CVs for EPD of MnO2 ceramic and CNT charged by
22
Fig.1-11 SC versus scan rate (a) with CNT (b) without CNT 34.
Fig.1-12 The IR drop in galvanostatic measurement when
23
Fig.1-13 (a)Nyquist graph53 and (b)equivalent circuit model54 of an ideal supercapacitors.
24
Chapter 2
Experiment Details
2.1 Experiment Process Flow
The experiments are separated into two parts, including sample
preparations and device characterizations analyses as shown in fig.2-1. There
are several sample preparation steps described in this chapter.
First 1x 3 cm2 Nickel foils with 1mm thickness as current collector were cleaned by ultrasonic agitation in ethanol for 10 minutes and their surface were
roughed by a following nitride acid treatment. Three different device structures
were fabricated in this thesis. Synthesis of MnO2 powder and coaxial
MnO2/CNT were prepared before fabricating samples. Sample A used coaxial
MnOx/CNT composite material as the active layer, coated on nickel foil.
Sample B was the MnOx film coating on CNTs/Ni substrate which had been
prepared previously. Sample C was the MnO2 film coating on Nickel foils. All
films were deposited by electrophoretic deposition method and all the samples
needed to be dried in a oven at 80℃ for 12 hours after every step. Considering
the thermal effect on capacitive behavior, sample A was annealed by furnace
for 2 hours. The details of experiment are described step by step in the
25
The scanning electron microscopy system (SEM) and X-ray diffraction
system (XRD) were used to analyze surface morphology and the crystallization
of the film, respectively. X-ray photoelectron spectroscopy (XPS) was used to
measure the electronic state and empirical formula of MnOx. Field emission
transmission electron microscope (FETEM) was use to observe the structure of
coaxial MnOx/CNTs composite material. The components of composite
material were analyzed by energy dispersive X-ray analyzer (EDX). BET and
thermogravimetric analysis (TGA) were used to know the specific area of
composite material and the ratio of MnOx to CNTs, respectively. All the
electrochemical performances of supercapacitors were measured by CH
instruments 618B electrochemical analyzer.
2.2 Current Collector Preparation
2.2.1
Carbon Nanotubes Purification
Carbon nanotubes act as high surface current collector material on Nickel
foil and the element of composite material. Before synthesis of MnOx/CNTs
material and depositing CNTs thin film, the CNTs need to be purified. The
purification steps are following. First, 3.0 g multi-wall carbon nanotubes was
added into 200ml 70% HNO3 solution. This solution was stirred at 300rpm to
keep MWCNTs well suspended and heated to boiling in reflux equipment for
24 hours. After cooled in the air, the purified MWCNT was washed to pH=7.0
26
2.2.2
Nickel Acid Treatment
The purpose for nickel acid treatment is to increase the surface roughness.
1x3 cm2 polished nickel foils were cleaned by ultrasonic agitation in ethanol for 10 minutes. After that, eight pieces of the nickel foil was put in 200ml 10%
diluted nitride acid and sonicated for 30 minutes. Then the nickel foils were
washed by DI water and dried in an oven at 80℃ for 12hours.
2.2.3
Carbon Nanotubes Electrophoretic Deposition
There are two kinds of current collector used in this thesis. One is the
roughed nickel foil and another is the roughed nickel with CNTs thin film
deposited by electrophoretic deposition method. The electrolyte of EPD
contained 5mg purified CNTs and 5mg Mg(NO3)2 in 200ml isopropyl alcohol
and dispersed well by ultrasonic agitation for 30 minutes. The Mg2+ ions acts as charge surfactant absorbed by oxygenated groups on CNTs surface so that
the CNTs with positive charge on the their surface can be not only dispersed
well in IPA but deposited in the cathode electrode55. It is important for the quality of depositing CNTs film to use a well suspension as electrolyte.
Two roughed Ni foils were put in the suspension as cathode and anode
electrodes. The space between two electrodes was 1 cm and the applied voltage
of EPD was 40V for 30 minutes. Then the CNT/Ni substrate was put in an oven
and dried at 80℃ for 12 hours. The deposited area was restricted in 1x1cm2. After that the CNTs/Ni current collector was fabricated completely.
27
2.3 Active Material Synthesis
In this thesis, manganese oxide is used for supercapacitors application.
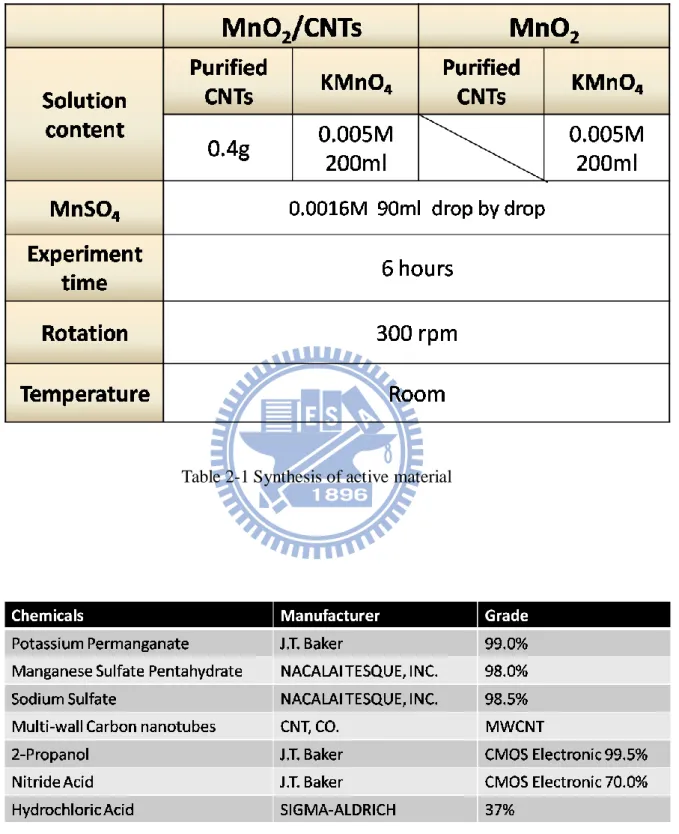
Two kinds of active material, as listed in table 2-1, MnOx and MnOx/CNT
composite powder, were fabricated by chemical redox reaction.
2.3.1
MnO
xnanopowder
Potassium permanganate and Manganese sulfate were used as reductant
and oxidant, respectively. 0.016M 90ml MnSO4 solution was added into
0.005M 200ml KMnO4 solution drop by drop in room temperature and stirred
at 300rpm for 6 hours. Manganese oxide was precipitated from both of them.
After washed to pH=7.0 by DI water and dried in an oven at 80℃ for 12hours,
MnOx nanopowder was obtained.
2.3.2
MnO
x/CNT Composite
The process of the composite of MnOx/CNT is similar to the MnOx
nanopowder. 0.4g purified MWCNTs was put in 0.005M 200ml KMnO4
solution and dispersed by ultrasonic agitation for 30 minutes. Then adding
0.016M 90ml MnSO4 into MWCNTs/KMnO4 solution drop by drop in room
temperature and keeping the solution stirred at 300rpm for 6 hours will form
the MnOx/CNT composite powder. Finally, the powder was also washed to
pH=7.0 by DI water and dried in an oven at 80℃ for 12hours. The
28
2.4 Supercapacitors Preparation
The electrophoretic deposition (EPD) method was adopted to deposit the
active material powder on current collector. The electrolyte of EPD was
composed of 0.24g active powder and 0.4 ml 37% HCl in 4 l isopropyl alcohol
and dispersed well by ultrasonic agitation for 30 minutes. Three kinds of
current collector and nickel foil were put in the electrolyte as cathode and
anode electrodes, respectively. The space between two electrodes was 1 cm.
The structure of sample A is MnOx/CNT composite material coated on
roughed Ni foil and the applied voltage of EPD was 30V and 40V for 20, 40
and 60 minutes. The current collectors of Sample B and Sample C were
roughed CNTs/Ni and nickel substrate, respectively. MnOx nanopowder was
used as active material and deposited on the cathode at 30 V applied voltage for
20 minutes. The MnOx and MnOx/CNT composite material were also deposited
on the cathode electrode. All the depositions were fixed in 1x1cm2 and needed drying in an oven at 80℃ for 12hours. In order to know the thermal effect on
capacitive behavior of MnOx/CNT composite supercapacitors, sample C put in
furnace was annealed to 150℃, 200℃, and 250℃ in air for 2 hours,
29
2.5 Measurements and Analyses
2.5.1
X-Ray Diffraction(XRD)
Generally, thin films are classified according to its crystallization. There
are three types of crystallization, including amorphous, polycrystalline, and
crystalline. XRD analysis was used to investigate the crystal structure and
orientation of our sample. Furthermore, the crystallization dependence of the
samples could be identified for heat treatment. In the experiment, the thin films
were grown between amorphous type and poly type. By Scherrer’s formula,
cos 9 . 0 B
D , this could estimate the average grain size from XRD
illustration. Where the background information of the XRD analysis is that λ =1.5405Å (Kα), B is the full width at half maximum (FWHM) of the XRD
peak and θ is the diffraction angle. In this analysis, X-ray was made with 0.02 degree beam divergence and operation configuration at 30KV, 20mA.
2.5.2
Scanning Electron Microscope (SEM)
Comprehensively, the surface morphology issue is also a quite important
character compared with the character of bulk for the thin films. The surface
micro-morphology and cross section of our sample could be observed by SEM
analysis. Besides, the crystallization of the thin films needed to be investigated
directly by XRD analysis. So, SEM analysis is helpful to get enough
information to support our illustration. In this study SEM images was performed on a JEOL FESEM JSM6700F instrument
30
2.5.3
Field Emission Transmission Electron Microscope and
Energy Dispersive X-ray Spectrometer
The state-of-the-art JEOL JEM-2100F field emission transmission
electron microscope is equipped with an Oxford INCA Energy TEM 200 EDX
(energy dispersive X-ray spectrometer) system, a Gatan GIF Tridiem EELS
(electron energy loss spectrometer) system and a Fischione high-angle annular
dark field detector. Features of the JEM-2100F include a high-brightness
Schottky field emission electron gun producing a probe size of less than 0.2 nm.
Ultra-high point-to-point TEM resolution is 0.19 nm; atomic scale resolution of
0.136 nm can be achieved using high angle annular dark field (HAADF)
scanning transmission electron microscopy (STEM) imaging. The facilities are
ideally suited for crystallographic and chemical analyses at a sub-nanometer
scale, including high-sensitivity EDX and EELS.
2.5.4
X-ray Photoelectron Spectroscopy(XPS)
XPS is a quantitative spectroscopic technique that measures the
elemental composition, empirical formula, chemical state and electronic state
of the elements that exist within a material. XPS spectra are obtained by
irradiating a material with a beam of X-rays while simultaneously measuring
the kinetic energy (KE) and number of electrons that escape from the top 1 to
10 nm of the material being analyzed. XPS requires ultra-high vacuum (UHV)
conditions.
XPS is a surface chemical analysis technique that can be used to analyze
31
treatment such as: fracturing, cutting or scraping in air or UHV to expose the
bulk chemistry, ion beam etching to clean off some of the surface
contamination, exposure to heat to study the changes due to heating, exposure
to reactive gases or solutions, exposure to ion beam implant, exposure to
ultraviolet light, for example.
2.5.5
BET analysis
In 1938, Stephen Brunauer, Paul Hugh Emmett, and Edward Teller
established the BET theory for the first time, which is a well-known rule for the
physical adsorption of gas molecules on a solid or powder surface and serves
as the basis for an important analysis technique for the measurement of the
specific surface area of a material.
The BET method is widely used in surface science for the calculation of
surface areas of solids and powder. A total surface area Stotal and a specific
surface area S are evaluated by the following equations:
V s N v S m total BET , [Eq.2-1] g S
SBET BET,total [Eq.2-2]
Where N is avoqadro’s number, s is adsorption cross section, V is molar
volume of adsorbent gas, vm is the monolayer adsorbed gas quantity, and g is
32
2.5.6
Thermal Gravimetric Analysis (TGA)
Thermal gravimetric analysis is a type of content testing that is
performed on samples to determine changes in weight related to change in
temperature. The analyzer usually consists of a high-precision balance with a
platinum pan loaded with the sample. The pan is set in a small electrically
heated oven with a thermocouple to accurately measure the temperature. In
order to protect sample from oxidation or other undesired reactions, the
atmosphere purged with an inert gas is required. Due to each substance with its
own burning out temperature, analysis is carried out by raising the temperature
gradually and record the weight of testing sample against temperature to
calculate the weight loss and contents percentage. As many weight loss curves
look similar, the weight loss curve may require transformation before results
may be interpreted. A derivative weight loss curve can be used to tell the point
at which weight loss is most apparent.
2.5.7
Electrochemical Properties Measurement
In this study, we used CH Instrument 618B electrochemical analyzer to
measure all electrochemical properties. All the electrochemical testing was
carried out in a three electrodes system with a SCE reference electrode, a
counter electrode of platinum sheet, and 0.1 M Na2SO4 as the electrolyte. This
measurement system is illustrated in fig.2-3. There are three measurement tests
described as followed from which we can understand the capacitive behaviors
33
Ⅰ.
Cyclic Voltammetry Measurement
The most important part of all is cyclic voltammetry measurement. We
could understand the electric properties of the device from CV curve. The CV
measurement was performed by electrochemical analyzer which applied a DC
voltage sweeping between 0 V and 0.8 V at the same scan rate to observe the
faradic current of our sample. There were five different scan rates adopted,
5mV/s, 25mV/s, 50mV/s, 75mV/s, and 100mV/s.
Ⅱ.
Stability Test
When sample was tested for several times, the specific capacitance will
decrease gradually. How to maintain the specific capacitance is important for
supercapacitors. We chose galvanostatic technical mode to measure the
stability of sample. The sample was charged and discharged at a constant 1mA
current in the voltage window ranging from 0 V to 0.8V for 6000 cycles and
each cycle was calculated the degradation and compared with first cycle.
Ⅲ.
Impedance Measurement
Impedance Measurement is a useful method to understand the interface
resistances and equivalent circuit for supercapacitors. All the samples in this
study were measured at 0.1 V. The amplitude of AC signal was 10 mV and the
34
Table 2-1Synthesis of active material
35
Table 2-3 EPD parameters of all samples in this experiment
36
Fig.2-2Illustration of the current collector fabrication flow
37
Chapter 3
Results and Discussion
3.1 Supercapacitors Fabrication
Electrophoretic deposition is a potential method to produce
supercapacitors with advantages of low cost, safety, and high production rate.
According to previous studies, the MnOx film deposited from Mn2+ ions into
CNTs/Ni surface had higher capacitance and reversibility than MnOx/Ni
supercapacitors because CNTs increased the surface area and conductivity of
electrode33. Zhitoirsky and his co-worker used adding some polymer as surfactant to electrolyte which ionizes MnO2 nanowires and CNTs to produce
co-deposition MnOx/CNTs supercapacitors34.
In this study, we substitute H+ ions for polymer which is considered as a charge transfer resistance for fast redox reaction. Although H+ ions can ionize
the surface group of MnOx nanoparticles, CNTs can’t have charge on their
surface for EPD application by absorbing them. Therefore, in order to deposit
MnOx and CNTs simultaneously, a synthesis of coaxial MnOx/CNTs composite
38
3.1.1
Current Collectors Fabrication
An ideal current collector must have high surface area, good adhesion to
deposit film, and inactive to electrolyte during measurement. Nickel is an
appropriate candidate for electrode substrate than platinum due to their prices.
For supercapacitors, the adhesion between current collector and thin film such
as CNTs, MnOx, and MnOx/CNT composite will affect their stability of
capacitive performance. Nickel foil in this experiment was put in 10% nitride
acid to increase surface roughness because the surface nickel was oxidized to
green Ni2+ ion and dissolved in strong acid. Rough surface provides more contact area for CNTs or active powders so that they can stick on nickel
confirmedly33. Comparing to polish nickel foil, CNTs or active powders can be also coated by EPD method but the thin film will crack or peel off when
sample was dried or tested for electrochemical properties.
The purification of CNTs and forming oxygenated group on CNTs
surface were achieved by different oxidation rate of impurities and CNTs in
70% boiling nitride acid. Nanotubes treat in this way is well known to have
surface negative charges that electrostatically stabilize the aqueous suspensions
for long periods. Mg2+ absorbed by oxygenated group of CNTs can change the surface charge from negative to positive in IPA. In this study all the applied
voltage of electrophoretic deposition were high than 1.23V, water decomposed
voltage, which cause a large amount of oxygen and hydrogen bubbles that
destroy the deposits qualities and adhesion, so water-free 2-propanol was
39
3.1.2
Electrophoretic Deposition of Active Material
In electrophoretic deposition process hydrogen ions when the pH value
of electrolyte below 7 served as surface charge additive that ionizes the
nanostructure of manganese oxide to stabilize the suspension. The ratio of 37%
hydrochloric acid containing water to 2-propanol was limited due to the
voltage of hydrolysis. We found that when the volume ratio above 1/5000 the
qualities of deposit were destructed by hydrogen bubbles. It is also very
important for active material deposition to choose a suitable applied voltage
because the electric field between two electrodes during EPD forces active
material with positive charge to move to cathode. When electric field was
below 20V/cm, we can’t attach the deposits to current collector firmly. The
deposited film will be stripped by sprinkling DI water on its surface.
3.2 Material Analyses of MnO
xNanopowder and MnO
x/CNTs
Composite
Two kinds of nanopowder, MnOx and MnOx/CNTs composite, as active
materials were produced in this experiment. Both manganese oxides were
formed from potassium permanganate and manganese sulfate. When
manganese sulfate solution added into a violet aqueous liquid containing
potassium permanganate that is well known as a strong oxidant, Mn2+ from manganese sulfate was oxide into MnOx and potassium permanganate also
40
The figure 3-1 and 3-2 are TEM image of MnOx and MnOx/CNTs
composite, respectively. For MnOx nanopowder, the diffraction pattern
indicates that the structure is amorphous. Figure 3-2 tell us that MnOx/CNTs
composite has coaxial structure with 3~4nm manganese oxide on CNTs. The
atoms of manganese oxide in this TEM image are not in an ordered
arrangement which means that manganese oxide on the CNTs is amorphous
structure.
The specific area considered as the effective place of fast redox reaction
was also measured by BET method in this study. Table 3-1 are the
measurement result described as following: CNTs with 40~300m2/g, purchased from CNT, CO., was calculated as 131.3 m2/g and MnOx nanopowder and
MnOx/CNTs composite were 59.5 and 170.9 m2/g, respectively. The result from
BET measurement showed the evidence that conformal MnOx film
precipitating on CNTs surface will enhance the specific area nearly 3 times
than it of MnOx nanopowder due to CNTs extending the deposit area per
weight of manganese oxide. High specific area allows more available
manganese oxide to exchange ions from electrolyte leading to a high specific
capacitance. The electrochemical performances of these powders are carried
out in the next section.
Figure 3-3 is thermal gravimetric analysis for MnOx/CNTs composite
according to the DSC curve of fig. 3-3, the exothermal peak around 380℃ can
be assigned to the ignition of carbon naotubes resulting in 68% weight loss of
the composite. Some weight loss below 250 ℃ in the curve can be attributed to
41
3.3 Electrochemical properties of MnO
xnanopowder and
MnO
x/CNT composite
3.3.1
Cyclic Voltammerty Measurement
We used cyclic voltammerty method to measure the electrochemical
performances of supercapacitor at five different scanning rates, 5mV/s, 25mV/s,
50mV/s, 75mV/s, and 100mV/s. Three different structures of supercapacitors
mentioned in chapter 2, MnOx/CNTs on nickel, and MnOx on nickel or
CNTs/nickel substrate, will be discussed in this section. All the weight of
samples were controlled within 45±5μ g by adjusting the deposition time at
30V. At first, observing from SEM images shown in fig.3-4 to fig.3-6, we can
find out that the precipitation of sample C became a dense layer due to the low
specific area of MnOx nanopowder and nickel substrate. The substrate of
sample B had a CNTs layer to extend surface area which permitted MnOx
nanopowder to deposit dispersedly so that sample B had much available
contact surface with electrolyte to charge and discharge. Besides CNTs could
enhance the conductivity of supercapacitors because it spread MnOx
nanopowder thought of as high resistance to decrease the thickness of
manganese oxide which was between current collector and electrolyte. The
SEM of sample A shows a large amount of composite material tangled to form
a porosity layer. Since MnOx/CNTs composite had larger specific area, we
assumed that it also had better electrochemical performances.
Figure 3-7 to 3-9 shows the CV curves of these three samples in 0.1 M
42
figure 3-10 overlaps these CV curves with a scan rate of 100mV/s. The CV
curves of sample A and B with CNTs are almost rectangular in shape, which
implies that both of them exhibit capacitive behavior. All the measured specific
capacitances are shown in the fig.3-11 and listed in detail in table 3-2. From
them we can find that the specific capacitances of these samples decrease as the
potential scan rate increases. As the potential scan rate is raised to 100 mV/s,
the specific capacitance of the sample C decreases to 166 F/g, which is 69.7%
of that measured with a scan rate of 5 mV/s, whereas the specific capacitance
of sample A and B is 378 F/g and 306 F/g, which are 78.8% and 81.2%,
respectively, of that measured with a scan rate of 5 mV/s. Sample A and B with
CNTs exhibit good reaction reversibility and less capacitance decay for faster
potential scan rates, probably due to CNTs providing a large activated surface
area to the redox reaction and acting as a good conductor with a low contact
resistance.
3.3.2
Stability Test
The electrochemical stability of the electrode was investigated by
applying 1mA constant current measurements. Figure 3-12 shows the plots of
the maintenance of specific capacitance of these three samples vs. the cycle of
the constant current test. The specific capacitances of sample B and C fall to
83.9% and 83.7% of the original value after 1000 cycles of CC test,
respectively. However after 3000 cycle tests, the specific capacitance of sample
B drops quickly to 37.6% of the original value, which is lower than it of
sample C which maintains 71% of the original value. But those of the sample A,
43
93.3% and 84.9% after 1000 and 3000 cycles of tests, respectively. The
capacitance of MnOx/CNTs composite on nickel remains at 79% of the original
value until 6000 cycles of CC test. The CC tests indicate that the MnOx/CNTs
composite electrode shows good electrochemical characteristic and stability.
Figure 3-13 is the SEM image of MnOx/CNTs composite electrode after
6000 cycles which can remain the surface morphology and has low degradation
of specific capacitance, probably due to better adhesion between manganese
oxide and CNTs that reduce the dissolution of MnOx film. However, as shown
in figure 3-14 and 3-15, the SEM planar view images of sample B and C after
3000 cycles pointing that the MnOx nanopowder layer after a long constant
current cycling will peel out because it follows a dissolution-redeposition
mechanism 56,57. When measuring from 0.8V to 0V, the MnO2 nanopowder will
be reduced and some will be dissolved into the electrolyte as Mn2+ cations58. And scanning from 0V to 0.8V, some of the dissolved Mn2+ cations will transform into MnO2 and deposit on the electrode surface again. Increasing the
cycle number, a sequential dissolution-redeposition reaction for manganese
oxide makes the morphology and become totally different than its original. We
believed that the structure with lower specific area and lost some dissolved
manganese oxide cause specific capacitance of sample B and C to decay