行政院國家科學委員會專題研究計畫 成果報告
急性骨髓性白血病治療後偵測微量殘存白血病細胞之研究
計畫類別: 個別型計畫 計畫編號: NSC91-2314-B-002-180- 執行期間: 91 年 08 月 01 日至 92 年 07 月 31 日 執行單位: 國立臺灣大學醫學院內科 計畫主持人: 唐季祿 報告類型: 精簡報告 處理方式: 本計畫可公開查詢中 華 民 國 93 年 6 月 23 日
行政院國家科學委員會補助專題研究計畫
■ 成 果 報 告
□期中進度報告
急性骨髓性白血病治療後偵測微量殘存白血病細胞之研究
Therapeutic Monitoring of Minimal Residual Disease in Acute
Myelogenous Leukemia
計畫類別: ■ 個別型計畫 □ 整合型計畫
計畫編號:NSC 91-2314-B-002-180-
執行期間: 91 年 8 月 1 日至 92 年 7 月 31 日
計畫主持人:唐季祿
共同主持人:
田蕙芬、陳耀昌、
姚明、
柯博升
計畫參與人員:
成果報告類型(依經費核定清單規定繳交):■精簡報告 □完整報告
本成果報告包括以下應繳交之附件:
□赴國外出差或研習心得報告一份
□赴大陸地區出差或研習心得報告一份
□出席國際學術會議心得報告及發表之論文各一份
□國際合作研究計畫國外研究報告書一份
處理方式:除產學合作研究計畫、提升產業技術及人才培育研究計畫、
列管計畫及下列情形者外,得立即公開查詢
□涉及專利或其他智慧財產權,□一年□二年後可公開查詢
執行單位:國立
台灣大學醫學院內科
中 華 民 國 93 年 6 月 22 日
2 (一)計畫中文摘要。(五百字以內) 關鍵詞:急性骨髓性白血病,殘存微量白血病,即時定量PCR,WT-1 基因。 復發是白血病化學治療最常見治療失敗原因,定量殘存微量白血病(minimal residual leukemia, MRL)可有效預測治療能否成功。最近二年我們利用即時定量 RT-PCR 放大特異 性染色體移位產生之雜合RNA,能靈敏偵測 MRD 達到 10-4~10-5,但只有20-30%病人適用, 無法廣泛使用。WT1 抑癌基因已知在急性骨髓性白血病(AML) 60-80%會出現 WT1 過度表 現,和Bcl-2 基因維持白血病細胞活性,可能影響預後。本計畫評估以 Wilms’ tumor (WT1) 基因作為MRD 標的的可行性,篩選高危險群病人和預測移植後復發之關連性。 我們設計多重基因即時定量(multiplex RQ-PCR)法,可在單一試管中同時放大 WT1 和 GAPD 基因(內在對照基因,以控制 RNA 品質及總量)。利用不同螢光探針,同時偵測定量 PCR 產物,評估發現其靈敏度與準確度均不亞於分開作RQ-PCR 結果。 研究結果發現正常人在捐贈骨髓移植或周邊血液幹細胞移植時收集的正常幹細胞檢體 WT1 RNA 含量很低或完全偵測不到,反之89 例新診斷 AML 病人中 65 例(77%)骨髓過量 表達WT1-RNA,可適用 MRD 偵測(靈敏度為 10-3~10-5)。5 例同時帶 AML-ETO 及 WT1 異 常病人,分別以此 2 種基因標的作 MRD 定量,比較結果發現有良好一致性。再系列追蹤 29 位病人化學治療後 WT1 含量變化,發現化療後MRD 持續>10-3者,白血病復發率高, 其他病人初期療效良好,進入分子緩解,復發機率則明顯減少。以上結果與最近國外研究 報告類似。
本研究成果證實Wilms’ tumor (WT1) 基因可作為 AML 病人 MRD 偵測之分子標的,
篩選高危險群 AML 病人和預測復發。可以更有效評估化學治療療效,協助發展有效之腫
瘤根除技術以減少術後復發,提高移植成功率。
(二)計畫英文摘要。(五百字以內)
Keywords:acute myeloid leukemia, minimal residual leukemia, real-time RT-PCR, WT-1 gene. Intensive chemotherapy and bone marrow transplantation have achieve high complete remission rate (60~80%) and 30-70% long-term survivor in acute myeloid leukemia (AML). However, many patients still died of relapse eventually. In the past 2 years, we have developed a real-time quantitative RT-PCR (RQ-PCR) assay that can accurately detect one leukemic cell out of 104 to 105 normal cells (4-5 Log) with 100% specificity. This assay was highly correlated with leukemic status and was able to identify high-risk patients before clinical relapse occurred. However, this technique is applicable to 20-30% of AML patients with specific molecular fusion genes—AML1-ETO in t(8;21) and PML-RARα in t(15;17). Recently, WT-1 gene, gene responsible for Wilms’ tumor, was found to be over-expressed in 60-80% of AML and was associated with poor survivor. Quantitation of WT-1 RNA level may be a candidate molecular target useful in monitoring the level of minimal residual leukemia (MRL) after treatment.
The goal of this project is to extend our current technique in using RQ-PCR in therapeutic monitoring of more than 50% of AML patients which have important clinical utility in detecting
residual leukemia, selecting high risk patients and predicting leukemic relapse.
In a retrospective study between Jan. 2000 and Apr. 2003, WT1 expression level in 84 adult AML at diagnosis was performed by a novel one-step multiplex quantitative real time reverse transcriptase polymerase chain reaction (M-RQ-PCR) technique. WT1 overexpression was defined as ≧ 1% expression level of K562 cell line.
Normal samples collected from 3 BMT and 11 PBSCT donors contained very low or undetectable levels of WT1, suggesting that normal stem cells expressed very low level of WT1.
WT1 overexpression was detected in 65/84 (77%) AML and 5/7 (71%) ALL and were eligible for MRD monitoring. There was no association of WT1 expression level with sex, age, initial WBC counts, CD34%, blast%, and cytogenetics. WT1 overexpression occurred frequently in most FAB subtypes except for M5 subtype. In 5 AML patients with both t(8;21) and WT1 overexpression, MRD level was estimated by AML1-ETO RQ-PCR and WT1 RQ-PCR assays respectively and there was good linear correlation (r2=0.769, N=35). In some cases, WT1 level was useful in
differential diagnosis of early relapse. False negative results may be encountered in poor quality samples and should be interpreted cautiously. Serial follow-up of WT1 kinetics in 52 patients showed that WT1-MRD level persistently > 10-3 after chemotherapy was associated with leukemic relapse. By contrast, relapse occurred in some patients who initially achieved molecular remission.
In conclusion, WT1 RQ-PCR assay is potentially useful molecular marker for MRD monitoring in AML patients. Whether WT1 level after induction and consolidation therapy is correlated with relapse risk and clinical outcome deserves further study.
4
1. Introduction
Intensive chemotherapy and bone marrow transplantation have achieve high complete remission rate (60~80%) and 30-70% long-term survivor in acute myeloid leukemia (AML). However, many patients still died of relapse eventually. Improvement of better estimates of the total body leukemic burden would improve clinical management and advance cure rate. Intensive chemotherapy delivered when the tumor burden is small should increase the likelihood of cure.
Specific translocation markers, such as t(8;21), t(15;17), and inv(16) can be used as molecular marker for minimal residual disease (MRD) detection in 40-50% of AML. Expression markers may widen this spectrum to 70-90%. Quantitative PCR (RQ-PCR,) is now as sensitive as conventional two-step PCR and could improve as well as facilitate clinical decision-making. RQ-PCR has been applied to a variety of molecular markers, delineating threshold levels early after induction therapy, for postinduction monitoring, as well as for the detection of relapse. For most markers, lack of decline of transcript levels by less than 2 logs after chemotherapy has been established as a poor prognostic sign. Moreover, increases in transcript levels are almost invariably associated with relapse. However, the predictive value of PCR negativity after chemotherapy is not as clear.1
Wilms' tumor gene WT-1 encodes a zinc-finger transcription factor that functions as a potent transcriptional repressor of several growth factors, including insulin-like growth factor-II and colony-stimulating factor-1. WT1 has been identified as a tumor suppressor gene involved in pediatric kidney tumor, Wilms’ tumor. Alterations of WT1 gene have been observed in other tumor types, such as leukemia, mesothelioma, and small round cell tumor. WT1 is expressed in stem cells of the bone marrow, but not in normal mature blood cells, indicating that WT1 plays a role in early hematopoiesis. WT-1 gene is overexpressed in 60-80% of AML patients and is
thought to play a role in maintaining the viability of leukemic cells.High level of WT1 at initial diagnosis was associated with adverse prognosis.2-3Monitoring of WT1 level after induction and consolidation chemotherapy was shown to provide helpful information on identifying those patients with inferior responses. Those patients having < 2-log reduction in MRD after induction (1-3 months) was predictive of relapse. WT1 assay may be useful for the prediction and management of relapse following allogeneic stem cell transplantation (SCT).4-5
In this project, we have developed a novel multiplex one-step real-time RT-PCR (M-RQ-PCR) assay that can accurately quantify the WT1 RNA expression amount in bone marrow or peripheral blood samples. This M-RQ-PCR technique was assessed for its clinical utility in AML patients to predict chemotherapy response and prediction of leukemic relapse after achievement of remission and after hematopoietic stem cell transplantation (HSCT).
2. Objectives
The goal of this project is to extend our current real-time quantitative RT-PCR (RQ-PCR) technique for therapeutic monitoring of MRD in more than 50% of AML patients. Accomplishment of this goal might have significant clinical utility in detecting residual leukemia, selecting high-risk patients and predicting leukemic relapse. The specific aims include establishment of WT1 RQ-PCR methods and assessment of its usefulness in MRD detection in
different subtypes of AML. 3. Patients and Methods:6
K-562 leukemia cell line was used as WT1 expression standard for establishment of standard curve for each experiment of MRQ-PCR. GAPDH housekeeping gene was used as internal control of RNA integrity and normalization of loading RNA amount. Although GAPDH has 56 pseudogenes in human genome, it does not interfere with the measurement of loaded total cellular RNA (1,000ng for each sample). Bone marrow or PBSC mononuclear cells was isolated by Ficoll-Hypaque and lyzed with Trizol-B and stored at -70℃ until used for RNA extraction by standard procedure as described previously.
The PCR primers are listed at below for amplification of WT1, GAPDH and AML1-ETO. Table 1 Nucleotide sequences of PCR primers and probes
Gene Primer Sequences
WT1 Sense Anti-sense Probe
ACAgggTACgAg AgCgATAACCA CACACgTCg CACATCCTgAAT
FAM-CAACgCCCATCCTCTgCggAgCCCAXTTAMRA
AML1-ETO AML1 TCAAAATCACAGTGGATGGGC
ETO CAGCCTAGATTGCGTCTTCACA
Probe FAM-AACCTCGAAATCGTACTGAGAAGCACTCCAC-TAMRA
GAPDH Forward GAAGGTGAAGGTCGGAGT
Reverse GAAGATGGTGATGGGATTTC
Probe JOE-CAAGCTTCCCGTTCTCAGCC-TAMRA
One step multiplex quantitative RT-PCR reaction was used to detect the expression of WT1 and GAPDH in the same reaction tube on the ABI Prism 7700 Sequence Detection System (Applied Biosystems, CA). One µg of total RNA was applied in a final volume of 50λ with TaqMan EZ RT-PCR reaction mixture which contained 1x TaqMan buffer, 3mM Mn(OAc)2,
0.3µM of each d(A,T,C)TP, 0.6µM dUTP, 0.01 units of AmpEraseUNG, 0.1units of rTth, 0.2µM each primer, and 0.1µM each probe. RT-PCR program started with 2 min incubation at 50 for ℃ UNG activation followed by 30 min at 60 for reverse transcription synthesis of cDNA. The ℃ temperature was elevated to 95 for 5 minutes to inactivate UNG, then proceed for 40 cycles ℃ of PCR reaction consisting of 94 denaturing for 15s and 60 annealing/extension for 1 min. ℃ ℃ All experiments were done in duplicates and including no-template control and negative control RNA to prevent PCR carryover. Fluorescence spectra were continuing monitored and analyzed by 7700 with detection software version 1.6. If results showed any discrepancies, data were repeated or excluded. K562 RNA was used as the standard in this study and the ratio of WT1/GAPDH was calculated.
Definition and Interpretation of MRQ-PCR Results
1. Sensitivity:
Since the variation of CT value increase dramatically after PCR cycle 36-37 that correspond
6
10-5. For practical purpose of MRD monitoring in AML patients, a sensitivity of > 10-3 should be fulfilled. So, we will define WT1 overexpression as WT1 expression at diagnosis > 10-2 level of K562 after normalization of GAPDH housekeeping gene.
2. MRD estimation by standard curve method:2
For each sample, the amount of WT1 and GAPDH level is determined from the standard curve generated from k562 cell at each experiment. Assuming there was 100% leukemic cells at diagnosis bone marrow, the MRD value was calculated as:
MRD = ( WT1X / GAPDHX ) / ( WT1DX / GAPDHDX )
4. Results and Discussions:
1) Sensitivity and accuracy of WT1 mRNA measurement by multiplex RQ-PCR in K562 cell line:
First, we establish standard curve by serial 10-fold dilution of K562 total RNA from 1,000ng to 0.1ng and co-amplify WT1 and GAPDH at the same reaction. As shown in Fig. 1, the
CT.value was inversely correlated with log (input K562 RNA amount) and the sensitivity of
accurate quantitation was at the level of 0.01ng (10-5). There was good intra-assay between
duplicate sample results and inter-assay reproducibility between separate experiments.
2) WT1 expression in normal bone marrow or PB stem cell (PBSC) samples:
Since normal hematopoietic progenitor-stem cells may express low level of WT1 gene, we then perform real-time quantitation of WT1 transcript in 14 normal controls who donated their stem cells either as bone marrow or G-CSF-mobilized PB stem cells. In both types of cells, there was no overexpression of WT1 detected. In normal bone marrows, there were low levels of WT1 expression at Ct level between 33-34, i.e. 0.1% of K562 expression. There was no detectable WT1 in all PBSC samples.
3) WT1 expression in AML and ALL patients at newly diagnosis:
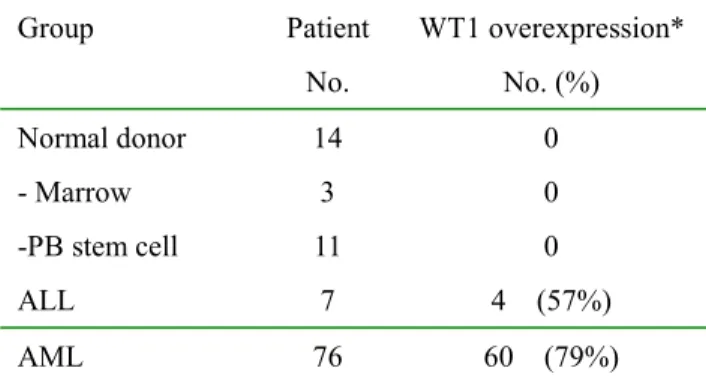
WT1-RQ-PCR was performed in 76 AML and 7 ALL at first diagnosis before chemotherapy and most of them expressed WT1 at wide range of variation. The detection limit can be as low as 10-5 for reference line K562, thus we chose only those leukemic samples expressing WT1 > 1% of K562 WT1 expression level as overexpression and eligible for MRD monitoring. By this criteria, there were 60 of 76 AML (79%) and 4 of 7 (57%) ALL having WT1 overexpression (Table 2). By chi-square test, WT1 overexpression was associated with younger age < 40 years, FAB subtype other than than M4-M5, and high CD34 expression (Table 3) and was not correlated with sex, initial WBC count, cytogenetic, and treatment response.
4) Comparative study of minimal residual disease (MRD) measurement by RQ-PCR of WT1 and AML1-ETO in AML patients:
Five AML patients had t(8;21) and WT1 overexpression and were used to compare the MRD measurement accuracy by both RQ-PCR assay. In previous study, we had shown that RQ-PCR of AML1-ETO had excellent sensitivity (1 in 105) and specificity (100%) in MRD monitoring. As shown in Fig 2, there was good correlation of MRD result (R=0.769) by both methods. However, the regression line was shifted toward left-side at low level of MRD,
probably because of low level of WT1 background expression by hematopoietic progenitor cells when using bone marrow samples.7 The kinetic MRD changes was similar by both RQ-PCR assays in 4 AML patients (Fig. 3). The measured MRD was generally slightly higher by WT1 than by AML1-ETO.
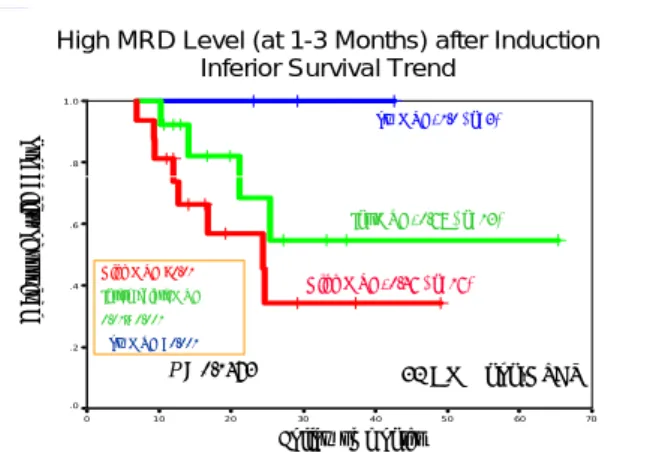
5) Persistent high MRD level after induction therapy was associated with inferior survival in AML:
We serially followed MRD level in 32 AML patients who didn’t receive hematopoietic stem cell transplantation (HSCT). After induction therapy (1-3 months after diagnosis), 16 patients with high MRD level > 0.01 was associated with inferior survival (46% at 2 years) than those with either intermediate MRD 0.01-0.001 (68%, n=13) and low MRD <0.001 (100%, n=3). Because of small patient number and short follow-up time, this difference did not reach statistical significance by Kaplan-Meier analysis (Fig. 4). Those patients with high MRD level also relapsed earlier than patients with low MRD level (Fig. 5).
6) Persistent high MRD level after HSCT was associated with leukemic relapse:
HSCT was performed in 31 patients wither at CR1 or after relapse. Persistent high MRD level > 0.01 at 6 months after HSCT was associated with high risk of leukemic relapse (88% at 2 years, n=11) than those with intermediate MRD 0.01-0.001 (18%, n=16) and low MRD <0.001 (33%, n=4). This difference was statistically highly significant (p < 0.0001 by log rank test, Fig. 6). Of note, there was one patient relapsed later than 2 years after HSCT although MRD once dropped to low level, indicating that frequent monitoring of MRD was required for early detection (Fig. 7).
5. Conclusion
From the preliminary result, we confirmed that:
1) WT1 overexpression is common in primary AML patients and is a potentially useful molecular tool for monitoring minimal residual disease (MRD) after chemotherapy or HSCT;
2) Persistent high WT1- MRD level > 0.01 after induction chemotherapy is poor prognostic sign and should be treated with more intensive therapy or HSCT;
3) Failure of WT1-MRD to drop to < 0.01 after HSCT is associated high risk of leukemic relapse and should be treated with early tapering of immunosuppressants and/or donor lymphocyte infusion to augment graft-versus-leukemic effect.
References:
1. Jaeger U, Kainz B. Monitoring minimal residual disease in AML: the right time for real time. Ann Hematol. 2003;82:139-147.
2. Schmid D, Heinze G, Linnerth B, et al. Prognostic significance of WT1 gene expression at diagnosis in adult de novo acute myeloid leukemia. Leukemia. 1997;11:639-643.
3. King-Underwood L, Pritchard-Jones K. Wilms' tumor (WT1) gene mutations occur mainly in acute myeloid leukemia and may confer drug resistance. Blood. 1998;91:2961-2968. 4. Cilloni D, Gottardi E, De Micheli D, et al. Quantitative assessment of WT1 expression by
8
acute leukemia patients. Leukemia. 2002;16:2115-2121.
5. Ogawa H, Tamaki H, Ikegame K, et al. The usefulness of monitoring WT1 gene transcripts for the prediction and management of relapse following allogeneic stem cell transplantation in acute type leukemia. Blood. 2003;101:1698-1704.
6. Wittwer CT, Herrmann MG, Gundry CN, Elenitoba-Johnson KS. Real-time multiplex PCR assays. Methods. 2001;25:430-442.
7. Hosen N, Sonoda Y, Oji Y, et al. Very low frequencies of human normal CD34+ haematopoietic progenitor cells express the Wilms' tumour gene WT1 at levels similar to those in leukaemia cells. Br J Haematol. 2002;116:409-420.
8. The result was presented at the annual meeting of Hematology Society of Taiwan, Mar. 13, 2004.
Table 2. WT1 overexpression in normal controls and in AML, ALL patients at first diagnosis
Group Patient No. WT1 overexpression* No. (%) Normal donor - Marrow -PB stem cell 14 3 11 0 0 0 ALL 7 4 (57%) AML 76 60 (79%)
*Over-expression defined as >0.01 of K562 WT1 value
Table 3. Correlation of clinical variables and WT1 overexpression in 76 AML at diagnosis
Variable No. % of WT1 overexpression Yes No P value Age <40 48 92% 8% 0.006 40-60 18 67% 33% >60 10 50% 50% FAB M4-5 20 65% 35% 0.048 Others 56 86% 14% CD34% <20% 16 56% 44% 0.039 >20% 60 85% 15% y = 3.607x + 16.117 R2= 0.9957 40 35 30 25 20 0.1 1.0 10 100 1000 K562 RNA Amount (ng) CTValue
Real-time Multiplex RQ-RT-PCR Measurement of WT1 RNA Amount in K562 Leukemic Cell Line
Standard Curve using CTValue (10 experiments)
Fig.1 Standard curve of WT1 MRQ-PCR in K562
leukemia cell line (10 experiments)
y = 0.8026x0.7132 R2 = 0.769 -5 -4 -3 -2 -1 0 MRD Level by Log(AML-ETO-RNA) M RD L e v e l by Lo g (W T 1 -RNA) 0 -1 -2 -3 -4 -5
Comparison of Minimal Residual Disease (MRD) Measurement by Real-time RT-PCR of AML-ETO
and WT1 mRNA on Same AML Samples
Fig.2 Correlation of MRD measurements by two 2
RQ-PCR methods from same specimens of 5 AML patients with both AML1-ETO and WT1 overexpression (n=36).
Correlation of MRD by Q-RT-PCR of t(8;21) and WT1 mRNA in 4 AML Patients
0 5 10Months 15 20 0 -1 -2 -3 -4 -5 Log MRD Level Solid line – t(8;21) Broken line -- WT1 No1 No2 No3 No4
Fig.3. Correlation of MRD kinetic changes 4 AML patients measured by QRT-PCR for AML1-ETO (solid line) and WT1 (broken line) respectively.
High MRD Level (at 1-3 Months) after Induction Inferior Survival Trend
70 60 5 0 40 30 20 10 0 1 .0 .8 .6 .4 .2 .0 32 AML non-HSCT Low MRD, 1.0 ( n=3) Int MRD, 0.68 ( n=13) High MRD, 0.46 ( n=16) p Follow up months P = 0.1473 Pr ob ab ility of su rv iv al High MRD >0.01 Intermediate MRD 0.01~ 0.001 Low MRD <0.001
Fig.4 High MRD level after induction chemotherapy (1-3 months) was associated with inferior survival in AML
MRD Kinetic Changes by WT1 RQ-PCR in 30 AML Patients after Chemotherapy
0 5 10 15 20 25 30 -1 0 -2 -3 -4 Follow-up months MRD Log level
Fig.5 Kinetic changes of WT1-MRD after chemotherapy in 30 AML patients
Association of MRD Level 1-6 Months after HSCT and Probability of Relapse in 29 AML Patients
4 0 3 5 3 0 2 5 2 0 1 5 1 0 5 0 1 . 0 . 8 . 6 . 4 . 2 0 . 0 Low MRD ,0.33 ( n=4) Int MRD ,0.18 ( n=16) High MRD ,0.88 ( n=11) P rob ab ility o f re la ps e Follow up months P < 0.0001
Fig.6 High MRD level 1-6 months after HSCT was associated with high probability of relapse in 29 AML patients
MRD Kinetic Changes by WT1 RQ-PCR in 20 AML Patients after HSCT
0 5 10 15 20 25 30 35 40 -1 0 -2 -3 -4 MRD Log level BMT Months
Fig. 7 Kinetic changes of WT1-MRD in 20 AML patients after HSCT