行政院國家科學委員會專題研究計畫 成果報告
過度教育及其對勞動市場的影響研究
研究成果報告(精簡版)
計 畫 類 別 : 個別型 計 畫 編 號 : NSC 99-2410-H-004-048- 執 行 期 間 : 99 年 08 月 01 日至 100 年 10 月 31 日 執 行 單 位 : 國立政治大學經濟學系 計 畫 主 持 人 : 莊奕琦 計畫參與人員: 博士班研究生-兼任助理人員:陳晏羚 博士班研究生-兼任助理人員:劉冬威 博士後研究:賴偉文 報 告 附 件 : 出席國際會議研究心得報告及發表論文 公 開 資 訊 : 本計畫涉及專利或其他智慧財產權,2 年後可公開查詢中 華 民 國 100 年 12 月 29 日
中 文 摘 要 : 高等教育擴充政策的施行,使我國具大學教育程度的勞工比 例大幅增加,因而可能產生勞動市場過度教育的現象,而過 度教育的現象亦代表人力資源的浪費。為了解析台灣是否存 在不足、適度與過度教育的現象以及其對勞動市場的影響, 本文採用主計處的「人力運用調查」資料,並以實際配合法 定義不足、適度與過度教育者的教育年數,比較分析和探討 台灣 1990 年與 2000 年不足、適度與過度教育的結構變化; 除此之外,本文亦採用 multinomial logit model 與 Mincer 薪資方程式分別來解析造成不足、適度與過度教育的成因以 及不足、適度與過度教育的教育報酬率。估計的結果發現過 度教育可能會受產業結構、區域發展以及個人特質所影響, 而過度教育之教育報酬率約為 6%,不足教育者之教育報酬率 則約為 3%~5%,均低於 9%~10%的適度教育報酬率。 中文關鍵詞: 不足教育、適度教育、過度教育、高等教育擴充政策 英 文 摘 要 : 英文關鍵詞:
過度教育對勞動市場的影響
莊奕琦,賴偉文* 摘要 高等教育擴充政策的施行,使我國具大學教育程度的勞工比例大幅增 加,因而可能產生勞動市場過度教育的現象,而過度教育的現象亦代表人 力資源的浪費。為了解析台灣是否存在不足、適度與過度教育的現象以及 其對勞動市場的影響,本文採用主計處的「人力運用調查」資料,並以實 際配合法定義不足、適度與過度教育者的教育年數,比較分析和探討台灣 1990 年與 2000 年不足、適度與過度教育的結構變化;除此之外,本文亦 採用 multinomial logit model 與 Mincer 薪資方程式分別來解析造成不足、 適度與過度教育的成因以及不足、適度與過度教育的教育報酬率。估計的 結果發現過度教育可能會受產業結構、區域發展以及個人特質所影響,而 過 度 教 育 之 教 育 報 酬 率 約 為 6% , 不 足 教 育 者 之 教 育 報 酬 率 則 約 為 3%~5%,均低於 9%~10%的適度教育報酬率。 關鍵詞: 不足教育、適度教育、過度教育、高等教育擴充政策 *兩位作者分別為國立政治大學經濟學系教授與博士後研究員。一、 前言 近年來由於我國在教育政策上對於大學學制的鬆綁,台灣地區大學教 育階段中各大專院校之學校數的成長極為快速,根據行政院教育部所公布 的資料顯示,台灣地區各大學及獨立學院之校數,自 1994 年的 51 所,迅 速增加至 2008 年的 147 所,其成長幅度近三倍,而大學生的人數更已超 過 120 萬人,具大學程度以上之人口占全國 15 歲以上總人口比例在 10 年 內由 7.51%增加至 22.47%,其成長幅度可謂相當驚人。因為廣設大學政策 的施行,倘若再加上台灣近年來少子化之浪潮的衝擊,可以想見未來所有 高中職的畢業生幾乎都能進入大學就讀,將造成傳統觀念上「精英式」的 大學教育將可能成為我國的「新國民教育」。 雖然大學教育的擴充可以讓我國大學教育的人口比例與其他先進國 家並駕齊驅,進而提升整體國民的素質和能力。然而,過度的擴充大學教 育投資,卻可能產生另一種過度教育(over-education)的問題,造成教育資 源的扭曲使用、教育投資浪費,進而導致教育的邊際報酬率下降,尤有甚 者,更可能造成個人工作意願降低,離職率與失業率居高不下等勞動市場 的問題。1 事實上,若由勞動市場的大學程度者之供給與需求兩方面來看,如圖 一所示,在勞動供給上,台灣的大學畢業生人數,自 1996 年開始快速的 增加,雖然勞動市場對大學生的勞動需求也隨著經濟發展而相對同時增 加,但由圖一可以明顯看出自 1996 年起,大學生的勞動供給與勞動需求 即呈現明顯的差異,亦即大學生的勞動供給與需求之間的差距亦持續存在 且擴大中,顯示台灣地區在大學程度者的勞動市場中,可能存在過度教育 的問題。 1 詳細說明請參見林文達(1994)、蕭霖(2003)、張芳全(2008)等。
0 50000 100000 150000 200000 250000 300000 68 69 70 71 72 73 74 75 76 77 78 79 80 81 82 83 84 85 86 87 88 89 90 91 92 93 94 95 大學畢業生人數 大學生就業人數 圖一、台灣勞動市場的供給與需求(新增大學教育程度者) 有關過度教育對經濟層面的影響,國內外文獻中亦多所著墨,如 Berg (1970)的研究便指出過度教育者與非過度教育者比較起來,過度教育者的 生產力相對較低,這是因為過度教育者覺得他們的工作無趣,因而缺乏工 作的動力造成生產力的低落;Tsang (1987)在美國 Bell 公司的研究亦發現, 員工的過度教育對公司的生產能力有明顯的負相關,若員工每多一年的過 度教育將使該公司的生產力下降 8.35%;Hung (2008)以台灣的資料研究影 響過度教育的個人與家庭的因素,並指出過度教育者的投資報酬率雖然仍 為正,但與適度教育者相比較,其教育報酬率則低於較適度教育者的教育 報酬率,另外包括 Duncan and Hoffman (1981), Alba-Ramirez (1993)及 Rumberger (1987)亦獲得與 Hung (2008)類似的結果;Buchel and Mertens (2004)與 Rubb (2005)則認為過度教育與不足教育(under-education)會影響 工作者轉換職業的機率,研究的結果顯示過度教育對工作者職業轉換為正 向效果,而不足教育則為負向效果。除此之外,蔡瑞明(2005)以抽樣問卷 的方式研究發現相對於人文科系的大學畢業生,發現較高比例的理工科系 的大學畢業生認為自己在職場上有過度教育的情況,而人文社會科學背景 的大學生則認為自己學非所用的狀況較為明顯。
從國家總體發展的角度來看,當一個國家高等教育的勞動供給明顯高 於勞動需求時,表示該國將大多數的政策預算投資在高等教育之中,教育 以外的其他政務預算勢必受到教育經費的排擠;若從勞動個體的角度來 看,過度教育將會影響受雇者對工作的感受、個人薪資結構、甚至是對工 作環境的滿意程度,進而改變其生產能力,對經濟將產生長期不利的影 響。若進一步詳細推究過度教育的發生原因,可以發現過度教育除了可能 是因為擴充高等教育政策所造成之外,亦可能是因為產業結構變化所導 致,勞力密集型或技術密集型的產業,對勞動需求亦有所不同,因為對勞 動需求的不同可能也會導致產業出現過度教育的現象。在政府政策的施行 上,倘若因為過度教育的結果而縮減國家對教育經費的支出,未能有效調 整產業結構,可能反而會造成對國家經濟的發展與長期競爭力的傷害,故 過度教育對勞動市場的影響,實值得做進一步的分析研究。 因此,本文採用行政院主計處之「人力運用調查」的資料,首先定義 勞動市場上的過度教育者,以文獻中不同的測度方法進行過度教育與不足 教育的測量;進一步分析過度教育者與不足教育者的組成結構,探討過度 教育、適度教育與不足教育的影響因素。除此之外,本文將進一步討論過 度教育、適度教育與不足教育對個人薪資報酬的影響效果,探討個人轉換 職業與過度教育、適度教育與不足教育的關係,以及過度教育是否影響長 期失業率。 二、 理論背景與實證模型 近年來在世界各國高等教育大量擴增的刺激之下,我國對教育經費的 支出亦快速增加,自 1990 年代開始,台灣的大學教育機構數便呈現高度 成長的趨勢,在這種快速擴張的過程中,我國亦將面臨過度教育的問題。 對勞動者而言,大學文憑不再是保證能夠找到適合工作的通行證,為了生 活所需,許多高等教育程度的工作者可能因此而勉強自己從事技能需求較
低的工作,也就是個人實際的教育水準與職業所需之教育水準不對稱,而 這種過度教育的情況更可能因廣設大學政策的施行而日趨嚴重。 以往國內外文獻上對過度教育的定義中,以 Trang (1987)的定義為主 要依據,Trang (1987)逶過三種不同方式來定義個人的過度教育,其中第一 種是指受教育的個人,從以前較高的經濟地位降至現今較低的經濟地位; 第二種是指個人職業的取得並沒有達成其所接受之教育應有的期望;第三 種則是勞動力經由教育所得的技能超過個人工作所需,也就是勞動力之教 育能力的低度利用(underutilization)。 參考過去文獻對過度教育的測量方式,Hartog(1980)歸納出兩種主觀與 兩種客觀的不同測量方法,首先在主觀方面的過度教育之測量,主要是以 個人主觀意見來評定自己是否存在過量教育的現象,一般而言,在主觀上 對個過度教育的測量包括兩種方法,其中第一種方法是由個人自行評斷是 否過量教育,通常採用問卷抽樣方法,經由實際的詢問個人主觀判斷是否 過量教育;另一種方法則是以個人認定目前工作所需教育程度的高低,再 與本身實際所受之教育相比較以判別個人教育程度是否過量。Duncan and Hoffman(1981) 率 先 使 用 這 種 定 義 方 法 測 量 , 其 後 Hartog and Tsang (1987)、Sicherman (1991)、Alba-Ramirez (1993)等都使用類似方法。然而這 種主觀的過度教育測量方式乃由抽樣的對象個人來判斷,一方面由於個人 主觀上的判定未必準確,將會存在高估或低估個人能力的可能性,另一方 面在問卷的設計上可能會造成抽樣的樣本隱匿本身情況而導致回收率不 足的問題。 其次在客觀上對過度教育的測量方面,文獻上通常也採用兩種不同的 方法來衡量,其中第一種方式是工作分析法,這種方式乃由 Thurow & Lucas (1972) 與 Hartog (1980)所提出,而 Rumberger (1987)亦使用相同的定義測 量。所謂的工作分析法,即是以系統化的方式,透過標準職業的分類去確 認個人工作上所需的教育程度再與個人實際的教育程度相比較;這種工作
分析法的測量,最精細的範例就是美國的 Dictionary of Occupational titles (DOT)。然而若使用工作分析法來處理台灣的過度教育問題,一方面因為 這樣的工作分析法在台灣並沒有類似的系統性整理,另一方面亦由於這種 方式可能會因為經濟的發展與產業結構的變化,將使由職業的分類去確認 工作所需的教育程度可能會隨時間的變化而必須隨時更新,增加在過度教 育問題處理的難度。 客觀方面對測量過度教育的第二種方式為實際配合法,這種方式即是 以所有從事該職業或行業之勞工教育程度的「平均值」或是「眾數值」為 其適量教育的標準,使用此方法進行研究的有 Groot (1993)等。而另外
Verdugo and Verdugo (1989)的「標準差模式」2與蕭霖(2003)以「半標差模
式」, 也是採用類似方式處理過度教育的測量問題。 本文參考過去國內外文獻的作法以及可獲得資料的限制,選擇採用實 際配合法的方式來處理台灣地區過度教育的認定問題。然而,過去對過度 教育研究的文獻中,大多僅以職業作為區分,而沒有對行業別加以區分, 因此在測量過度教育時容易產生偏誤。舉例而言,若我們單純僅就職業別 來做為區分來觀察各職業別下工作者的教育分配,可以發現從事企業負責 與主管人員之教育分配中,最大的比例集中在大學的教育程度上,如圖 2.1 所示;然而若我們將從事的行業別也加入區分,可以發現基礎製造業、精 密機器製造業、批發零售與餐旅業及金融服務業之企業負責與主管人員之 教育分配中,即使其職業同樣是企業負責與主管人員,但在基礎製造業 中,其最大比例集中在高職的教育水準上;在精密機器製造業中,則是集 中在專科的教育水準上;在批發零售與餐旅業中,最大比例集中在大學教 育水準上,而在金融服務中,最大比例的教育分配則集中在碩士的教育水 準上,如圖 2.2-2.5 所示。 2
Verdugo and Verdugo (1989)以該職業的平均教育年數加減一個標準差為適量教育的範圍,超過 平均值一個標準差為過度教育,而低於平均值一個標準差則為不足教育。
0 0.1 0.2 0.3 0.4 國小 國中 高中 高職 專科 大學 碩士 博士 圖 2.1、企業負責與主管人員之教育分配 0 0.1 0.2 0.3 0.4 0.5 國小 國中 高中 高職 專科 大學 碩士 博士 0 0.1 0.2 0.3 0.4 0.5 0.6 國小 國中 高中 高職 專科 大學 碩士 博士 圖 2.2、企業負責與主管人員之教育分配 圖 2.3、企業負責與主管人員之教育分配 (基礎製造業) (精密機械製造業) 0 0.1 0.2 0.3 0.4 0.5 國小 國中 高中 高職 專科 大學 碩士 博士 0 0.1 0.2 0.3 0.4 國小 國中 高中 高職 專科 大學 碩士 博士 圖 2-4、企業負責與主管人員之教育分配 圖 2-5、企業負責與主管人員之教育分配 (批發、零售與餐旅業) (金融服務業)
經由上述的說明我們可以發現,即使勞動者從事相同的職業,但在不 同行業下,其教育分配也不盡相同,因此對適量教育水準的認定亦將有所 不同,因而造成認定其是否為過量或不足教育水準,亦會產生不同的結 果。故本文認為同時依據行業與職業區分以認定其適量教育水準應較為合 理。3因此我們選擇以工作(job)來認定,亦即同時區分不同行業與不同職業 下工作者的教育水準分配,採用實際配合法來定義適度教育者的教育層 級,並依據適度教育層級,首先定義出不同年度之過度教育與不足教育 者,以便能進一步分析過度教育者與不足教育者之勞動者的教育結構。 除了將不同年度之不足、適度與過度教育工作者加以嚴謹之定義,並 了解其組成結構,另一方面,本文亦將進一步嘗試分析造成不足、適度與 過量教育的影響原因,由於個人的教育投資受個人特質與家庭因素的影 響,故本研究選擇以 multinomial logit model 探討個人特質與家庭環境因素 對不足、適度與過量教育的影響 (如 Lin and Wang(2005)、Hung(2008)等), 模型設計如下:
假定Yi 1,2,3分別表示樣本 處於適度、過度與不足教育的情況,其中Yi 1
為對照組,則過度與不足教育的 multinomial logit model 可表為
m m i m i i Z X Y P m Y P ) 1 ( ) ( ln ,m2,3 (1) 其中Xi為影響教育投資的個人特質及家庭環境因素,而個人特質包括性 別、年齡、婚姻、現職年資,現職前經驗年數、是否在公立機構工作等; 家庭環境因素則包括居住地區、是否在外縣市工作等。因此樣本
i
之適度、 過度與不足教育的機率分別為 3 本文依據行政院主計處的標準分類,將行業別區分為 10 大類,分別是農林漁牧狩獵業、製造 業、水電燃氣業、營造業、商業、運輸倉儲及通信業、金融保險及不動產業、工商服務業、個人 及社會服務業、公務及國防事業等;而職業則區分為 7 大類,分別是行政主管、專技工作者、事 務工作者、服務工作者、農林漁牧工作人員、技術工、操作工及體力工等。3 2 1 1 ) 1 ( i Z Z e e Y p 3 2 2 1 ) 2 ( Z Z Z i e e e Y p 3 2 3 1 ) 3 ( Z Z Z i e e e Y p
由 multinomial logit model 可以判斷個人與家庭因素對不足、適度與過度教 育的影響效果,以釐清不足、適度與過度教育的成因。
若一個國家存在過度與不足教育的勞動者,其所隱含的意義表示人力 資源運用不具效率,也就是勞動者所接受的教育,無法有效的應用在個人 的工作上,因此個人受教育的報酬率亦有所不同,因此本文採用 Mincer 薪資方程式來估計不足、適度與過度教育對個人教育報酬率的影響,國內 外文獻如 Hartog(2000)、Rubb(2003) 、McGuinness(2006)與 Hung(2008)等, 皆採用類似的方法處理,因此本文綜合一般文獻,所採取之估計方程式如 (2)式所示 i i i i u i o i r i i S S S Ex Ex X w
0
1
2
3
4
5 2
ln (2) 其中 r i S 、 o i S 、 u i S 分別代表適度、過度與不足教育年數,而Exi 代表個人 的經驗年數,Xi 表示其他影響薪資方程式的控制變數。由(2)式的結果可 以分析不足、適度與過量教育對個人薪資的影響效果。 若勞動者個人的教育程度與職業所需的教育程度不對稱時,勞動者容 易缺乏工作動機,甚至對工作環境與薪資結構感到不滿意。因此在實際教 育與工作所需教育無法配合的情況下,勞工轉換工作職業的可能性亦相對 增加,而對過度教育的勞動者而言,轉換工作的目的乃為了尋求更好的工 作環境與工作待遇。事實上,當勞工的個人教育程度高於其從事之工作所 需的教育程度時,對勞工而言,之所以願意屈就在“較差"的工作,一種 可能是因為生活所需,暫時在較差的工作中累積經驗,以便將來能跳槽到更好的工作;另一種可能是目前的工作較有遠景,可以期待將來有更高的 薪資報酬。第一種可能過度教育的勞工會轉換工作,但第二種可能過度教 育的勞工卻不會轉換工作。透過本研究的模型估計,或可釐清台灣過度教 育之勞工的種類。 雖然教育發展與勞動人口失業的問題,一直為人所關注,教育的高度 擴充也可能是造成台灣近年來失業率高居不下的原因之一,由於廣設大學 政策的施行,使愈來愈多的高中畢業生能進入大學就讀,造成勞動市場上 大學程度者之勞動供給明顯增加,但相對大學程度者之勞動需求增加的幅 度卻低於勞動供給的增加,因為勞動供給大於勞動需求,過量的大學畢業 生不是屈就至“較差"的工作,便是成為勞動市場上的失業者。 過度擴充的大學教育,除了會造成大學畢業生無法找到適合職業可以 就業,即產生高失業率或“高才低就"等人力資本閒置的問題之外,若因 過量教育而導致長期高失業率的情況,更可能會造成受大學教育者對大學 教育失去信心,因為大學文憑不再是進入職場的通行證,人們對大學教育 不再有期待;尤有甚者,若高失業率持續存在,更可能產生貧窮、沮喪及 自殺等社會問題。 三、 資料分析與實證結果 本文選擇採用 1990 年與 2000 年的行政院主計處「人力運用調查」原 始資料,利用 1990 與 2000 年的估計結果進行比較,觀察 10 年來廣設大 學政策的施行,是否造成台灣過度教育的情況日益嚴重。因為人力運用調 查的資料是針對十五歲以上,不包括武裝勞動力與監管人口,自由從事經 濟活動之民間人口,並登錄其個人的年齡、性別、教育程度、從業身分, 行職業等人口、家庭、社會與經濟背景資料,所以在選擇資料方面,我們 參考國內外文獻的做法,選擇公私部門受雇人員,排除失業者(每週工時 不足 15 小時者)、雇主、自營作業者及無酬家屬工作者的樣本。
本文選擇以工作(job)來認定,亦即同時區分不同行業與不同職業下工 作者的教育水準分配,採用實際配合法來定義適度教育者的教育層級,並 依據適度教育層級,首先定義出不同年度之過度教育與不足教育者,雖然 本文以文獻中所採用之實際配合法來定義不足、適度與過度教育,但是與 過去國外文獻所採用之「標準差模式」不同,本文選擇以「半標準差模式」 來做為測度過度教育的方法,之所以有所不同是因為我國在教育投資上, 通常是以教育層級做為決定投資教育的目的,也就是一旦進入學校,通常 會直到畢業,較少有肄業的情況發生,和國外的教育投資模式有所不同, 將造成教育年數的標準差相對較大的可能性,因此若以標準差模式測量過 度教育,會因為適度教育的範圍過大而產生測量上的偏差,因此我們採用 「半標準差模式」來做為測度過度教育的方法。 運用「半標準差模式」定義 1990 年與 2000 年適度教育的範圍,並進 一步測量不足教育與過度教育的比例,測量結果如表 1 所示。由表 1 的結 果我們發現,我國過度教育的情況有日漸惡化的現象,職場中過度教育者 的比例,由 1990 年的 27.72%成長至 2000 年的 38.22%,另一方面不足教 育者的比例,則由 1990 年的 13.65%,增加至 2000 年的 15.32%。這個結 果顯示,我國教育投資與從事的工作之間,存在著教育與工作不對稱的現 象,而且這個現象正在惡化之中。造成這種現象的原因,除了因為擴充教 育政策的實施,使大部分的勞工所接受的教育年數,從 1990 年至 2000 年 之間呈現大量的增加;而另一方面亦因為產業結果的轉型,使得產業更加 多元化,形成另一個教育與工作不對稱的結果。 表 1、勞動者教育水準結構 1990 年 2000 年 不足教育 0.1365 0.1532 (0.3433) (0.3603) 適度教育 0.5863 0.4645
(0.4925) (0.4989) 過度教育 0.2772 0.3822 (0.4476) (0.4625) 資料來源:行政院主計處「人力運用調查」原始資料。 括號內數字為標準差。 我們進一步觀察不同行業與不同職業下之過度教育與不足教育的結 構,如表 2 與表 3 所示。形成另一個教育與工作不對稱的結果。在行業別 方面,我們發現 1990 年過度教育較嚴重的行業主要集中在製造業與個人 及社會服務業上,但在 2000 年時,過度教育則主要集中在製造業、運輸 倉儲及通信、金融保險及不動產與公共及國防事務業上。而另一方面在不 足教育者的行業結構上,1990 年不足教育主要集中在農業、商業、運輸倉 儲及通信與個人及社會服務業上,而在 2000 年的不足教育則集中在製造 業與營造業。而不同行業之間勞動者不足教育結構的比例,於 1990 年主 要集中在農業、商業、運輸倉儲通信與個人與社會服務業,而在 2000 年 則集中在製造業與營造業。 比較 1990 年與 2000 年,我們可以發現過度教育相對較為嚴重的行 業,由 1990 年的製造業轉移至 2000 年的運輸倉儲及通信與金融保險不動 產業,這種情形可能是因為我國的產業結構的轉移,從製造業為主轉移至 以運輸倉儲通信與金融保險不動產業,因而造成勞動者過度教育的結構在 不同產業之間的變動。 表 2、不同行業下過度與不足之教育結構 1990 2000 過度教育 不足教育 過度教育 不足教育 農林漁牧礦業 0.2488 0.1944 0.3509 0.1307 (0.4327) (0.3960) (0.4778) (0.3375) 製造業 0.3163 0.0688 0.3992 0.1980 (0.4650) (0.2532) (0.4898) (0.3985) 水電燃氣業 0.1685 0.0978 0.3311 0.0795 (0.3753) (0.2979) (0.4722) (0.2714)
營造業 0.1410 0.0601 0.3102 0.2180 (0.3481) (0.2378) (0.4627) (0.4130) 商業 0.2343 0.2213 0.3648 0.0895 (0.4237) (0.4152) (0.4814) (0.2855) 運輸倉儲通信 0.2979 0.3061 0.4380 0.1333 (0.4575) (0.4610) (0.4964) (0.3401) 金融保險不動產 0.2428 0.1022 0.3924 0.1485 (0.4291) (0.3032) (0.4887) (0.3558) 工商服務業 0.2730 0.1439 0.3624 0.1494 (0.4460) (0.3514) (0.4808) (0.3565) 個人與社會服務業 0.3412 0.2415 0.3587 0.0657 (0.4742) (0.4280) (0.4798) (0.2479) 公務與國防事業 0.2184 0.1341 0.5242 0.0458 (0.4133) (0.3409) (0.4996) (0.2091) 資料來源:行政院主計處「人力運用調查」原始資料。 括號內數字為標準差。 除了比較不同行業別過度與不足教育勞動者之結構之外,我們亦選擇 以不同職業下勞動者之教育結構,如表 3 所示。由表三可以發現,在過度 教育者的比例上,相同的是 1990 年與 2000 年在行政主管與技術工及體力 工過度教育者的比例者較高,但過度教育者從 1990 年的專技工作者與農 林漁牧工作人員轉移至 2000 年的事務工作者與技術工。而在不足教育勞 動者的比例上,相同的是在 1990 年與 2000 年都同時集中在行政主管與技 術工,較為不同的是不足教育者由 1990 年的專技工作者、服務工作者與 農林漁牧工作人員轉移至技術工。 表 3、不同職業下過度與不足之教育結構 1990 2000 過度教育 不足教育 過度教育 不足教育 行政主管 0.3609 0.1864 0.4126 0.1764 (0.4804) (0.3895) (0.4927) (0.3815) 專技工作者 0.2889 0.1556 0.3037 0.0964 (0.4545) (0.3634) (0.4599) (0.2952) 事務工作者 0.2290 0.1013 0.4381 0.0640 (0.4202) (0.3018) (0.4962) (0.2449)
服務工作者 0.2356 0.2391 0.3007 0.1217 (0.4245) (0.4266) (0.4587) (0.3270) 農林漁牧工作人員 0.3219 0.3367 0.3787 0.1335 (0.4673) (0.4727) (0.4857) (0.3406) 技術工 0.2389 0.2019 0.3894 0.2240 (0.4268) (0.4018) (0.4877) (0.4170) 操作工及體力工 0.2793 0.0827 0.4555 0.2214 (0.4487) (0.2755) (0.4981) (0.4152) 資料來源:行政院主計處「人力運用調查」原始資料。 括號內數字為標準差。 為了進一步釐清造成不足、適度與過量教育的影響原因,本文選擇採 用 multinomial logit model 來估計不足、適度與過量教育的成因,估計結果 如表 4 所示,由表 4 的結果我們發現,在控制其他因素之下,年齡愈高者, 愈有可能過度教育,但不足教育的可能性則相對較小;在性別的比較上, 男性過度教育的可能相對較女性低,這是因為相對女性勞工而言,較願意 屈就在“較差"的工作,也就是可能因為生活所需,暫時接受在教育需求 較低的工作中,而由 1990 年與 2000 年的估計結果顯示這樣的情況會因時 間的變化而使女性發生過度教育的可能性日漸降低;而在經驗方面,不論 是職前經驗或在職年資,都發現經驗年數愈高,過度教育的可能性就愈 低,這是因為在經驗的累積之後,個人接受的教育與工作上對教育的需求 會逐漸契合,因而使經驗較高的工作者,過度教育的可能性亦相對降低; 除此之外,是否在政府機關工作,亦對過度教育有所影響,特別是在政府 機關工作,其過度教育的可能性相對較小,這個結果表示對政府機關而 言,透過公務員考試的遴選,在政府機關工作者,大多數其教育年數與工 作所需會較為接近,也就是政府機關所交辦的工作,乃是以其所接受之教 育年數來畫分,因此在政府機關工作者,其過度教育的可能性較低,值得 一提的是 2000 年的估計結果,是否在政府機關工作,於過度教育與不足 教育的估計參數均為負,顯示在政府機關工作,其教育年數與工作之間, 在 2000 年時是最對稱的。
另外,影響過度與不足教育的因素中,特別值得注意的是區域效果, 我們以東部地區做為比較組,估計不同區域的影響,結果發現相對於東部 地區,北部、中部、南部與高雄市等地區的工作者,過度教育的可能性都 較高,顯示相對較為先進的地區,較有可能出現過度教育的情況,但不足 教育的可能性卻相對較小,而比較 1990 年與 2000 年,可以明顯發現工作 與教育的不對稱性愈來愈嚴重,也就是過度教育與不足教育的可能性都提 高了。比較不同的是在台北市工作的勞工,相對於在東部地區工作的勞 工,在台北市工作者,過度教育的可能性相對較低,之所以會有這樣的結 果,可能的原因是雖然台北市相對較為先進,但另一方面也表示台北市有 較多的工作機會,在勞工的選擇性高多的情況之下,勞工不需要屈就在工 作上對教育需求較低的工作,而可以選擇更適合自己的工作。 表 4、影響過度與不足教育因素的估計結果 1990 2000
Over-education Under-education Over-education Under-education 年齡 0.9011*** -0.3713*** 0.4256*** -0.6399*** (950.13) (-508.62) (828.91) (-672.99) 性別 -0.8156*** 0.3887*** -0.3722*** 0.7503*** (-266.79) (111.20) (-177.89) (202.91) 婚姻 0.0088 -0.4671*** -0.0337*** -0.0838*** (2.65) *** (-108.09) (-13.82) (-17.39) 職前經驗 -0.9272*** 0.4029*** -0.4659*** 0.6878*** (-969.48) (613.42) (-866.37) (755.49) 在職年資 -0.9469*** 0.4006*** -0.4339*** 0.6700*** (-944.60) (568.30) (-882.15) (787.33) 政府機關 -1.4475*** 1.0212*** -0.8979*** -0.4080*** (-365.46) (211.56) (-303.62) (-63.03) 外出工作 0.0036 0.2651*** -0.2237*** 0.0674*** (1.22) (70.04) (-104.27) (16.05) 北部 0.3243*** -0.4401*** 0.0064 0.2882*** (32.69) (-49.54) (0.96) (27.18) 中部 0.1191*** -0.3126*** 0.1417*** 0.3160***
(11.76) (-34.23) (21.04) (29.24) 南部 0.0864*** -0.2227*** 0.0949*** 0.0756*** (8.57) (-24.73) (14.02) (6.97) 台北市 -0.6031*** 0.4201*** -0.1531*** 0.6641*** (-59.97) (45.97) (-22.64) (58.25) 高雄市 0.1799*** 0.0778*** -0.1032*** 0.0381*** (17.28) (8.03) (-14.47) (3.18) 常數項 -11.2180*** 1.0156*** -7.8339*** 7.7803*** (-738.03) (84.71) (-669.13) (402.9)2 樣本數 20845 20845 21543 21543 Pseudo R2 0.3777 0.3777 0.3058 0.3058 括號內為 t 統計量,*、**、***分別表示達 90%、95%、99%的顯著水準。 透過實際配合法定義適度教育的定義後,我們觀察 1990 年與 2000 年 過度與不足教育的比例變化,更進一步分析探討造成過度與不足教育的原 因。然而,倘若一個國家存在過度與不足教育的勞動者,其所隱含的意義 即是該國之人力資源運用不具效率,也就是勞動者所接受的教育,無法有 效的應用在個人的工作上,依據這個解釋,可以推論過度教育與不足教育 者的勞動者,其過度與不足教育的報酬率亦會有所不同,因此我們選擇以 Mincer 薪資方程式來估計不足、適度與過度教育對個人教育報酬率的影 響,估計結果如表 5 所示。由表 5 的結果我們發現,對適度教育的工作者 而言,其 1990 年的教育報酬率為 9.19%,而 2000 年則為 10.49%,即使控 制婚姻狀況、行業別與公司規模之下,其教育報酬率亦沒有太大的變化。 而在過度教育之教育報酬率方面,由模型的定義與估計參數可知,對過度 教育的工作而言,以適度教育年數來比較,每多增加一年的教育年數,其 1990 年的教育報酬率為 6.53%,而 2000 年的過度教育報酬率則為 6.91%; 而在不足教育勞動方面,其估計結果顯示,相對於適度教育之勞工而言, 每少於適度教育年數一年的教育投資,其 1990 年的教育報酬率為 2.95%; 而 2000 年不足教育的教育報酬率則為 5.54%。
表 5、過度、適度與不足教育之教育報酬率估計結果 1990 2000 Required 0.0919*** 0.0939*** 0.1049*** 0.1002*** (76.90) (59.76) (91.28) (72.01) Over-education 0.0653*** 0.0588*** 0.0691*** 0.0607*** (32.93) (30.36) (33.33) (29.99) Under-education -0.0295*** -0.0194*** -0.0554*** -0.0397*** (-15.15) (-10.28) (-27.48) (-20.22) 經驗 0.0463*** 0.0365*** 0.0337*** 0.0269*** (55.71) (37.64) (54.15) (37.93) 經驗平方 -0.0006*** -0.0005*** -0.0004*** -0.0004*** (-43.94) (-34.27) (-30.35) (-25.03) 性別 0.4086*** 0.3686*** 0.3347*** 0.3043*** (72.99) (67.37) (66.90) (61.98) 婚姻 0.0693*** 0.0578*** (9.61) (9.02) 行業 農林漁牧礦業 0.1455*** 0.1138*** (7.86) (5.45) 製造業 -0.0234*** 0.0353*** (-2.60) (4.44) 水電燃氣業 0.0942*** 0.1047*** (2.82) (3.21) 製造業 0.3442*** 0.3311*** (29.46) (32.93) 運輸倉儲及通信 0.0892*** 0.1212*** (6.64) (9.90) 金融保險不動產 0.1128*** 0.0522*** (6.83) (3.79) 工商服務業 0.0430** 0.0431*** (2.27) (4.98) 個人與社會服務業 -0.0219** 0.0009 (-2.15) (0.06) 公務與國防事業 -0.1452*** 0.1756*** (-9.27) (15.42) 廠商從業人數 10-49 人 0.0854*** 0.0493*** (12.23) (7.85) 50-99 人 0.1176*** 0.0956*** (10.90) (9.64) 100-499 人 0.1382*** 0.1495*** (14.9) (17.41) 500 人以上 0.1795*** 0.1922*** (14.41) (17.11) 政府部門 0.2080*** 0.2081*** (19.66) (20.5) 截距項 2.9038*** 2.8862*** 3.2555*** 3.2107*** (161.13) (128.08) (194.32) (161.36) 樣本數 20845 20845 21543 21543 Adj-R2 0.4233 0.4768 0.4326 0.4877 括號內為 t 統計量,*、**、***分別表示達 90%、95%、99%的顯著水準。
四、 結論 近年來台灣地區大學教育的擴充,雖然大幅度增加我國大學教育程度 的勞工比例,進而提升整體勞動者的素質和能力。然而,過度的擴充大學 教育投資,卻可能產生過度教育的問題,造成教育資源的扭曲使用、教育 投資浪費,進而導致教育的邊際報酬率下降,尤有甚者,更可能造成個人 工作意願降低,離職率與失業率居高不下等勞動市場的問題。 若勞動者個人的教育程度與職業所需的教育程度不對稱時,勞動者容 易缺乏工作動機,甚至對工作環境與薪資結構感到不滿意。事實上,過度 擴充的大學教育,除了會造成大學畢業生無法找到適合職業可以就業,即 產生高失業率或“高才低就"等人力資本閒置的問題之外,若因過量教育 而導致長期高失業率的情況,更可能會造成受大學教育者對大學教育失去 信心,因為大學文憑不再是進入職場的通行證,人們對大學教育不再有期 待;尤有甚者,若高失業率持續存在,更可能產生貧窮、沮喪及自殺等社 會問題。 因此本文嘗試研究過度教育對勞動市場的影響,經由對不同年代過量 教育之定義、測度、成因及影響效果進行實證分析,由估計的結果發現我 國的過度教育現象乃呈現日益惡化的現象,除了是因為教育政策施行造成 之外,產業結構的改變、區域發展的差異以及個人的婚姻、年齡與經驗等, 都會影響過度教育與不足教育的可能性,一般而言,未婚、女性,年輕且 在較發達的區域工作者,相對上較可能是過度教育的工作者。若以政府的 角度來看,為了避免因過度教育現象而造成人力資源的浪費,除了對擴充 高等教育政策應重新審視之外,如果能提供更多可供選擇的工作,將有助 於工作與教育投資的對稱。 除此之外,在教育投資的報酬率方面,適度教育者之平均每年教育報 酬率約在 9%~10%之間,而過度教育者的教育報酬率則在 6%~7%之間,不 足教育者的教育報酬則約為 3%~5%左右,而且由估計的結果我們亦發現過
參考文獻 行政院主計處,《中華民國台灣地區人力運用調查報告》,台北,行政院主 計處。 林文逵(1994),「過量教育與失業」,《國立政治大學學報》,70,63-86。 林祖嘉(1996),「失業搜尋,在職搜尋,與工作轉換:巢式 Logit 模型的應 用」,《經濟論文叢刊》,24(2),205-225。 張芳全(2008),「過量與低度高等教育與失業率之國際分析」,《教育研究與 發展期刊》,第四卷第三期,79-116。 陳明郎(1992),「造成高失業率的原因及其對策-均衡搜尋模型」,《經濟論 文叢刊》,20(3),241-266。 蔡瑞明(2005),「台灣高等教育與勞力市場的連結:社會科學科系畢業生的 求職過程」,社會科學與台灣高等教育研討會論文,東海大學社會科學 院。 蕭霖(2003),「教育與職不對稱的模式探討」,《教育政策論壇》,第六卷第 二期,43-67。
Alba-Ramirez, A. (1993), “Mismatch in the Spanish Labor Market: Overeducation?" The Journal of Human Resources, 27(2), 259–278.
Banerji, R. and J. Riedel (1980), “Industrial employment expansion under alternative trade strategies: Case of India and Taiwan: 1950-1970," Journal of Development Economics, 7(4), 567-577.
Berg, Ivar (1970), Education and Jobs: The Great Training Robbery. New York, NY: Praeger Publishers.
Buchel, F. and A. Mertens (2004), “Overeducation, Undereducation,and the Theory of Career Mobility," Applied Economics, 36, 803–16.
Chuang Yih-Chyi and Wei-Wen Lai (2008), “The Sources of Taiwan’s Regional Unemployment: A Cross-region Panel Analysis" Hitotsubashi
Journal of Economics, 49(2), 47-65.
Duncan, G. J. and S. D. Hoffman (1981), “The Incidence and Wage Effects of Overeducation," Economics of Education Review, 1(1), 75–86.
Groot, W. (1993), “Overeducation and the returns to enterprise related Schooling," Economics of Education Review, 12(4), 299-309.
Hartog, J. (1980), “Earnings and capability requirements," Review of Economics and Statistics, 62, 2, 230-240.
Hartog, J. (2000), “Over-education and earnings: where are we, where should we go?" Economics of Education Review, 19, 131-147.
Hung Chia-Yu (2008), “Overeducation and undereducation in Taiwan," Journal of Asian Economics, 19, 125–137
Lin, Chun-Hung A. and Chun-Hsuan Wang (2005), “The Incidence and Wage Effects of Overeducation: The Case of Taiwan," Journal of Economic Development, 30(1), 31-47.
McGuinness, S. (2006), “Overeducation in the Labour Market," Journal of Economic Surveys, 20(3), 387-418.
McGuinnessa S. and J. Bennett (2007), “Overeducation in the Graduate Labour Market: A Quantile Regression Approach," Economics of Education Review, 26, 521–531
Rubb S. (2005), “Overeducation, Undereducation, and the Theory of Career Mobility: a Comment and a Note on Underemployment," Applied Economics Letter, 12, 115-118.
Rubb, S. (2003), “Overeducation in the Labor Market: A Comment and Re-analysis of a Meta-analysis," Economics of Education Review, 22, 621–629.
and Earnings," Journal of Human Resources, 22(1), 24–50.
Sicherman, N. (1991), “Overeducation in the labor market," Journal of Labor Economics, 9, 101-122.
Thurow, L.C. and R. E. B. Lucas (1972), The American distribution of income: a structural problem. A study for the Joint Economic Committee, US Congress, Government Printing Office, Washington D. C.
Tsang, M. C. (1987), “The Impact of Underutilization of Education on Productivity: A Case Study of the U.S. Bell Companies," Economics of Education Review, 6(3), 239-254.
Verdugo, R. and N. T. Verdugo (1989), “The impact of surplus schooling on earnings, Some additional findings," Journal of Human Resources, 24, 629-643.
國科會補助專題研究計畫項下出席國際學術會議心得報告
日期: 2011 年 7 月 3 日一、參加會議經過
This is my first time to attend the international conference held by the American Society of Business and Behavioral Sciences (ASBBS), which was founded in 1994 as an interdisciplinary professional organization and provides a forum for exchange of ideas among faculty members in business and behavioral science. The 14th Annual International Conference of ASBBS was held in Paris, France, June 24-26, 2011. The aim of the conference not only tries to gather worldwide researchers and professionals, but also increases the economics and business knowledge through academic discussions. Topics includes: Organizational Behavior, Human Resource Management, Public Sector Economics, Issues in Ethics, Education and Terrorism, Trade and Marketing, Globalization, Competition and Efficiency, International Business, Finance, Corporate Governance, Higher Education and Labor Market, Educational Leadership, Contract Learning, Distance Learning and Selecting
計畫編 號 NSC 99-2410-H-004 -048 計畫名 稱 過度教育及其對勞動市場的影響研究 出國人 員姓名 莊奕琦 服務機構及職稱 政治大學經濟學系 會議時 間 100 年 6 月 24 日至 100 年 6 月 26 日 會議地點 Paris, France 會議名 稱 (中文)
(英文) American Society of Business and Behavioral Sciences (ASBBS) 2011 Conference
發表論 文題目
(中文)
(英文) How to enter a good university: by personal ability or by the elite high school?
Universities, Financial Services and Immigration, E-Learning, MIS and CIS and Earnings Management, Fashion Market and Organizational Management, etc.
二、與會心得
As a Taiwan scholar, this is a tremendous opportunity for me to attend this international conference, to exchange academic ideas, and to share the expertise and experience with distinguished scholars from different disciplines and countries. The agenda of the conference is relative compact but rather comprehensive. There are sessions and presentations that consider contemporary issues in wide perspectives which generate critical thinking for policy makers and thus result in intensive and thoughtful discussion. My paper on “How to enter a good university: by personal ability or by the elite high school?” uses Taiwan 2005 higher education freshmen survey data and empirically tests the effect of the personal characteristics to enter a good university, and controlling for personal characteristics, further detects the elite high school's brand effect. Other than the existing literature, this paper controls several dimensions of personal characteristics, such as high school experience, personal areas of expertise, psychological conditions, individual ability, and family background; the major findings are that in both general university or vocational system extra curriculum reading is rather helpful. External factors such as cadres experienced, creativity, good leadership and emotional control adjustment will significantly affect the performance going into a good university; the inner personality of moderation, less expression of own opinion and less independent character have a better performance going into technical university. n particular, good students from elite high schools have a very significant advantage. Controlling for personal characteristics and extracting out peer effect of good schools attracting good performing students, we still find that elite senior high schools has a significant
advantage to enter elite universities, i.e. there exists a brand effect for school quality. Elite high school does have its brand value, enter the elite high school does increase the relative odds to enter high quality universities. My Taiwan study received a harm discussion from the paper discussant and participants. Most of them think that schools do have a label effect that different from each other and provide different values. This is actually a valuable personal experience for me, I had benefited from many scholars research results and experience that sharpen my understanding in many aspects regarding academic research agenda setting and articulation. The more I attend an international conference, the more I feel confident to present my idea, discuss with other scholars, and make the right response to questions.
三、考察參觀活動(無是項活動者略)
Not applicable.
四、建議
I strongly recommend domestic scholars to joint international conference or interdisciplinary conference such as ASBBS to learn more multicultural experience and at the mean time to enhance Taiwan’s visibility on the international academic arena. To organize a panel and form a research team to present at the international conference should be considered as an effective way for internationalization of our higher education.
五、攜回資料名稱及內容
Conference agenda and papers.六、其他
Yih-chyi Chuang <[email protected]>
ASBBS International Conference
Ellis B Heath <[email protected]> 2011 年 5 月 3 日上午 5:01
收件者: Yih-chyi Chuang <[email protected]>
Dear Professor Yih-Chyi Chuang,
Thank you for your submission to ASBBS 14th International Conference to be held in Paris France during June 24-26, 2011. Upon review, I am pleased to inform you that your paper "How to enter a good university: by personal ability or by the elite high school?" has been accepted for presentation. Please note the following:
• No separate letter will be sent to your co-author; please inform your co-author of this acceptance.
• Please register for the conference by returning the attached Registration Form.
• If you wish to publish your paper in the conference Proceedings, you will need to format your paper according to the guidelines and submit it by May 31, 2011. The Guidelines are available (pasted) at http://www.asbbs.org/call__us.html Note: ASBBS does not publish abstracts; only complete papers will be accepted for publication in the Proceedings.
• Visit http://www.asbbs.org/call__int.html for details about hotel room reservation. Note that June is a peak month for hotel rooms in Paris and rooms will be available on a first come first served basis.
• All rooms will be equipped with a computer, overhead projectors and screens. You may travel light and bring a flash drive for your PowerPoint presentation. If you wish to bring hard copies of your paper/presentation, we suggest you bring 20-25 copies.
The conference program will be available online
(http://www.asbbs.org/Meeting.html) during the first week of June, 2011; please check the Program for the date and time of your presentation. Hard copies of the Program will be available during the conference. The Conference Proceedings will also be available during the conference.
Congratulations! I hope to see you in Paris in June. In the meantime, feel free to contact me if you have any questions.
Sincerely, Ellis Heath ********************************** Ellis B. Heath, Ph.D.
Assistant Professor of Economics
Department of Marketing and Economics
Harley Langdale, Jr. College of Business Administration Valdosta State University
Valdosta, GA 31698-0075
How to enter a good university:
by personal ability or by the elite high school?
Yih-Chyi Chuang and Yan-Ling Chen Department of Economics National Chengchi University
Abstract
With the expansion in tertiary institutions and the university enrollment rate in Taiwan serged, whether one can enter a university is no longer the focus, can one go into a good university is the key. Using Taiwan 2005 higher education freshmen survey data, this paper empirically tests the effect of the personal characteristics to enter a good university, and controlling for personal characteristics, further detects the elite high school's brand effect. Other than the existing literature, this paper controls several dimensions of personal characteristics, such as high school experience, personal areas of expertise, psychological conditions, individual ability, and family background; we find that in both general university or vocational system extra curriculum reading is rather helpful. External factors such as cadres experienced, creativity, good leadership and emotional control adjustment will significantly affect the performance going into a good university; the inner personality of moderation, less expression of own opinion and less independent character have a better performance going into technical university.
In terms of individual ability, artistic and English speaking ability do not bring significant impact to enter good university, but have negative effect of entering technical university, but the English and Math ability is an important indicator for good universities. In gender, males are more likely going into good university than females. As for family background, parents with higher educational achievement will bring advantages to their children, senior high school students from high-income families or vocational high school students of low-income families have more advantages to enter good university or technical university. After-school supplementary education is not necessarily valid, it is only when the student’s own ability above certain level that may bring advantage to enter a good university. In particular, good students from elite high schools have a very significant advantage. Controlling for personal characteristics and extracting out peer effect of good schools attracting good performing students, we still find that elite senior high schools has a significant advantage to enter elite universities, i.e. there exists a brand effect for school quality. Elite high school does have its brand value, enter the elite high school does increase the relative odds to enter high quality universities.
How to enter a good university: by personal ability or by the elite high school?
I. Introduction
Enrollment rates in Taiwan has constantly rising in recent years, it reached 87% in 2007. While on the other hand, since 1996 Ministry of Education in Taiwan has promoted the policy encouraging the expansion of higher education by restructuring merit technical college into technical university and turning merit senior college into technical college. As a result, the number of universities and colleges reached 162 in 2005. However, this wave of high education expansion did not increase the number of the so-called elite universities. A question deserves analysis is that the increase in the "quantity" of tertiary institutions does not necessarily with the increase in “quality” of higher education.
In general, students favor more good-quality universities in order to access to good educational resources, but the number of good quality colleges and universities is limited. What can the students squeeze into the narrow gate of high quality tertiary institutions? Furthermore, is star high school the ticket into a good university? That is, does star high school has a brand value? This paper intends to explore the effects of students’ characteristics on entering good quality universities, and the value of star high school? Control variables include the heterogeneity of individual ability, private tutoring effects, peer effects and family background. The results of the paper will be
able to clarify the issue that entering a good quality university is because of personal abilities, experience and family background, or because of in star high school.
In the literature, to investigate the various factors affecting students entering the university, Strayer (2002) clams that the better the quality of high school to provide students with more quality learning resources will help students to get admission to the good quality university. Empirical results also found that schools quality plays an important role for high school graduates to go to college and university. Brewer, Eide, and Ehrenberg (1999) point out that the personal traits, family background, high school GPA will affect access to the university of choice. In addition, Dustmann, Rajah, and Van Soest (1997) study the effect of school quality on student’s continuing education after 16 years of age.
Most of the literature claims the importance of school quality. However, in order to precisely clarify the effect of school quality on continuing education, factors such as student’s personal characteristics and family background need to be control for. For example, Dearden, Ferri, and Meghir (2002) take reading and math proficiency test as a proxy for individual ability. Strayer (2002) uses AFQT scores as a personal capacity variable. Others such as Link and Ratledge (1975) adopt IQ score as an indicator for the ability of a person. In terms of family background, Strayer (2002), Haveman and Smeeding (2006) think family factors will influence the choice of their children to
university. Brewer, Eide, and Ehrenberg (1999) find that students from high-income families and parents with high educational achievement are very likely to enter good universities. For better control of the environment, this paper not only control for students’ art, English proficiency and Mathematics abilities, family background, parental interactions, but also take into account the individual’s high school qualifications and personal physical and mental state. We further factor out the peer effect or matching effect of good school induces good students, to evaluate the brand effect of school quality, i.e., the value of high school brand in entering university.
II. The empirical model and estimation method
To understand the probability of independent variables on the impact of the incident, empirical models using logistic regression to estimate the relative odds ratio of independent variables.1 Let p denotes the probability of success, then the logarithm of the odds ratio can be expressed as:
logit i i k ki i i i X X X P P P 0 1 1, 2 2, ... , 1 ln ) ( (1)
where X is explanatory variables for the probability of success and exp(β) is the
1
Odds ratio is frequency of the incident occur with respect to the incident frequency does not. if the odds ratio = 0.25, indicating the possibility of the event does not occur is 4 times the likelihood of occurrence. An event relative to another event odds ratio, we call the relative odds ratio.
relative odd ratio.2 The null hypothesis in equation (1) is to test H0: exp(β)<=1.
When the hull hypothesis is rejected implies that other things being equal, additional increase in one unit of X, the corresponding relative odd ratio will increase.
The purpose of our study is to test the impact of individual’s characteristics and school quality on the relative odd ratio of entering good quality colleges and universities. Thus, the empirical model can be specified as:
i i i i i nahigh X nauni nauni 1 0 0 ) Pr( 1 ) Pr( ln (2)
Where i is for individual, HQUNI is a dummy for entering high quality university, 1 for yes, 0 otherwise; HQHIGH is a dummy for studying in star high school, 1 for yes, 0 otherwise; X represents variables for personal characteristics, such as physical and mental status, ability, private tutoring, and family background; and e is a random disturbance term. The parameter alpha 1 stands for the log valve of relative odd ratio of entering high quality university by star high school students with respect to other non-star high school students. AS high performance students tend to match with high quality school and the peer effect is also relatively strong for star school, which are
2 Feinberg (2007) and Morgan and Teachman (1988) point out that the relative odds ratio estimation of correlation between variables has following good properties: (1) When the relative odds ratio greater than 1, it indicates increased likelihood of the incident, or independent variables has a positive role in the probability of incident; on the contrary, when the relative odds ratio less than 1, it means that it will reduce the likelihood of the event, or the probability of events since the variables have a negative effect. (2) The relative odds ratio is interchangeable under the changes in the choice of reference group. (3) Expansion of the frequency of variables several times does not affect the relative odd ratio. (4) The relative odds ratio can also be used for multivariate or multi-normal model. Details of Logistic regression model estimation can be found in Greene (2003).
conducive to entering high quality university. Thus, we add additional interaction term between star high school and student school performance to control for the match effect or peer effect. As private tutoring may have different effects on different abilities of students, interaction term for the two variables will also be considered.
Due to data limitation, we define the public universities as high quality university because in Taiwan education is heavily subsidized by central government and public universities receive more educational resources in terms of teacher quality, teaching apparatus and materials. By the same token, we define public senior high school as the star high school.3 Moreover, general education system and vocational
education system are two separated tracks in Taiwan; we further divide our data into two groups of general university and technical colleges and universities.
III. Data Analysis
We adopt 2005 survey for freshman of Taiwan Integrated Postsecondary Education Database, questions are divided into four parts: background, life in senior high school, life in university, Students’ view and opinion. Table 1 shows data description and classification, and Table 2 and 3 shows basic statistics for all the variables used in the models for general university group and technical colleges and
3 Using the number of Ph.D. in the faculty, student-teacher ratio, and books in the library, in either of the three dimensions about 80-90% of top 30 universities are public university.
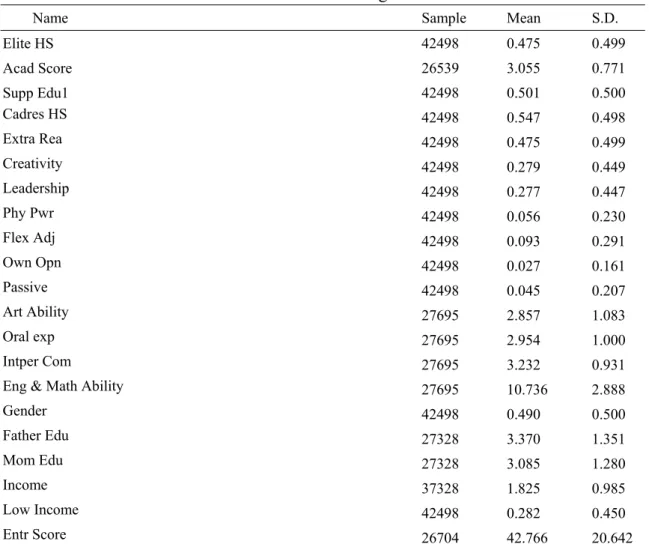
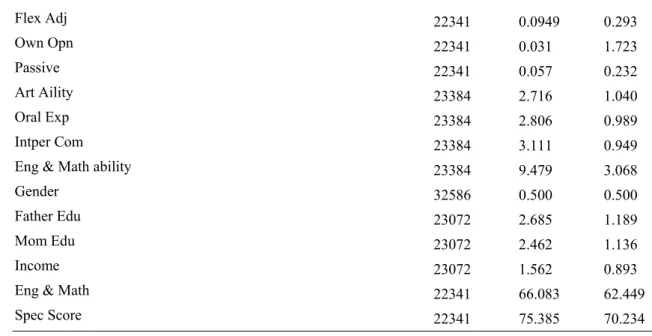
universities group, respectively. From Tables 2 and 3, the major differences between the two groups are: (a) more private tutoring during senior high school than during vocational senior high school as entrance exam for general university is more competitive; (b) English and mathematics abilities is higher for general university group than for technical university group; (c) Both parents education and family income are relatively higher for general university group than for technical university group.
Table1 Variable definition and description
Var. Name Description
Elite HS Dummy variable 1 for elite senior high school,0 otherwise Elite Voc Dummy variable, 1 for elite vocational school, 0 otherwise
Acad Score Average score of senior high school or vocational school, five levels with 5 the best and 1 the worst Supp Edu1 Dummy variable for after school supplementary education, 1 for having supplementary education during senior high school,0 otherwise
Supp Edu2 Dummy variable 1 for taking after school supplementary education in specialty courses, 0 otherwise Cadres HS Dummy variable, 1 for being cadres of class or school clubs, 0 otherwise Extra Read Dummy variable, 1 for having extra curriculum reading, 0 otherwise。 Creativity Dummy variable, 1 for good at creative job, 0 otherwise
Leadership Dummy variable, 1 for good leadership, 0 otherwise Phy Pwr Dummy variable, 1 for strong physical power, 0 otherwise
Flex Adj Dummy variable, 1 for good adjustment facing difficulty or disappointment, 0 otherwise
Own Opn Dummy variable, 1 for freely express own ideas when it disagree with teachers, 0 otherwise
Passive Dummy variable, 1 for always ask parents before making a decision, 0 otherwise Art ability Artistic ability, four category: 1 very weak, 2 weak, 3 ordinary, 4 strong Oral Exp Oral expression ability, four category: 1 very weak, 2 weak, 3 ordinary, 4 strong Intper Com Ability in interpersonal communication, four category: 1 very weak, 2 weak, 3
ordinary, 4 strong
Eng & Math ability English and math ability is the summation index of English speaking, reading, Math and logic, and analytical abilities, each of them has a scale of four category: 1 very weak, 2 weak, 3 ordinary, 4 strong
Gender Dummy variable, 1 for males, 0 for females
Fath Edu Father education: 1.Primary school and below,2.Junior high school, 3.Vocational school,4.Junior college, 5.University, 6.Graduate school and above
Mom Edu Mother education: 1.Primary school and below,2.Junior high school, 3.Vocational school,4.Junior college, 5.University, 6.Graduate school and above
Income Family annual income in NT$: 1.less than $500,000, 2.$50,000-$1,140,000, 3.$1,150,000-$1,500,000, 4.$1,510,000-$$3,000,000, 5.$3,010,000-$5,000,000, 6.Above 5,010,000
Low income Family annual income less than $500,000 Entr Score Total score of university entrance examination
Eng & Math Total score of English and math subjects in entrance exam for technical college and university
Spec score Total score of specialty subjects in entrance exam for technical college and university
Source: Higher education databank, questionnaire for freshmen in 2005.
Table 2 Basic statistics of all variable: general education track
Name Sample Mean S.D.
Elite HS 42498 0.475 0.499 Acad Score 26539 3.055 0.771 Supp Edu1 42498 0.501 0.500 Cadres HS 42498 0.547 0.498 Extra Rea 42498 0.475 0.499 Creativity 42498 0.279 0.449 Leadership 42498 0.277 0.447 Phy Pwr 42498 0.056 0.230 Flex Adj 42498 0.093 0.291 Own Opn 42498 0.027 0.161 Passive 42498 0.045 0.207 Art Ability 27695 2.857 1.083 Oral exp 27695 2.954 1.000 Intper Com 27695 3.232 0.931
Eng & Math Ability 27695 10.736 2.888
Gender 42498 0.490 0.500 Father Edu 27328 3.370 1.351 Mom Edu 27328 3.085 1.280 Income 37328 1.825 0.985 Low Income 42498 0.282 0.450 Entr Score 26704 42.766 20.642
Source: same as Table 2.。
Table 3 Basic statistics of all variable: vocational education track
Name Sample Mean S.D.
Elite HS 32586 0.365 0.481 Acad Score 22075 3.132 0.836 Supp Edu2 32586 0.187 0.390 Cadres HS 22341 0.576 0.494 Extra Rea 22341 0.451 0.498 Creativity 22341 0.243 0.429 Leadership 22341 0.241 0.428 Phy Pwr 22341 0.060 0.238
Flex Adj 22341 0.0949 0.293 Own Opn 22341 0.031 1.723 Passive 22341 0.057 0.232 Art Aility 23384 2.716 1.040 Oral Exp 23384 2.806 0.989 Intper Com 23384 3.111 0.949
Eng & Math ability 23384 9.479 3.068
Gender 32586 0.500 0.500
Father Edu 23072 2.685 1.189
Mom Edu 23072 2.462 1.136
Income 23072 1.562 0.893
Eng & Math 22341 66.083 62.449
Spec Score 22341 75.385 70.234
Source: same as Table 2.
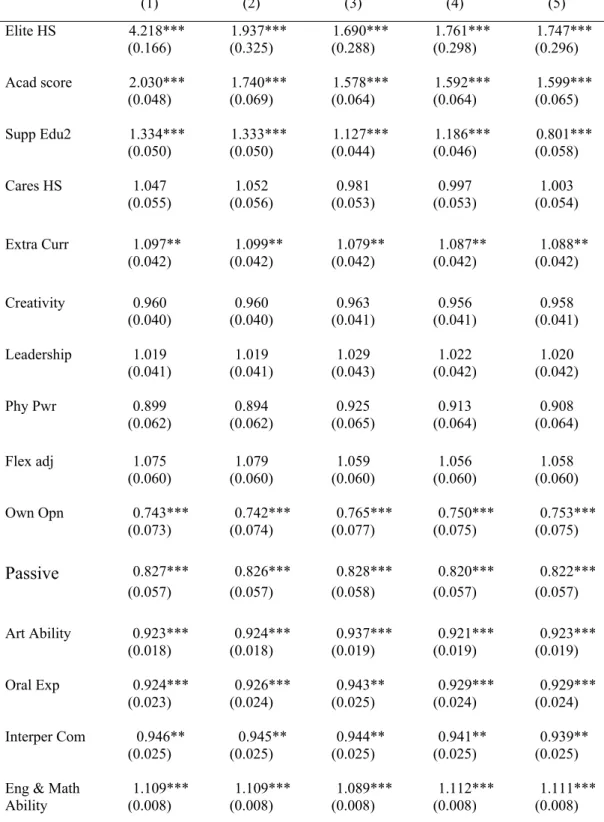
IV. Estimation results
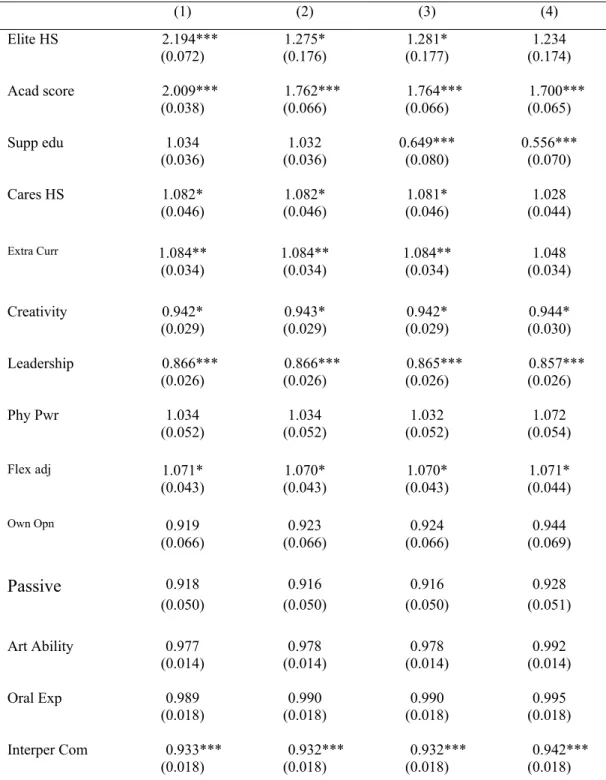
Table 4 shows the results of entering high quality university. Column (1) is the basic model, which we find that those who are in star high school have the relative odd ratio greater than one, implying they are more likely to enter high quality university than non-star high school students. We also find the students with high academic performance also have the advantage, but private tutoring does not has a significant effect. Being cadres for class or high school activities will have advantage to enter good quality university as the position enable them to increase their working knowledge, responsibility, sense of honor. Reading extra-curricular books also help because it broadens the spectrum of common knowledge.
As for individual specialty, good creativity and good leadership turn out to be a disadvantage. This is because in Taiwan university admission mainly relies on
national-wide written entrance examination. Creativity and leadership are not taken into account and those who spend lots of time in participating student clubs or extra-curriculum activities may diverse their degree of academic concentration. Good physical strength and stamina does not offer a advantage, while those who are good at adapting to disappointment or frustration will bring a advantage. These may imply that good emotional adjustment to surrounding environment tends to escape easily from external disturbance and concentrate more on school study. Those who are freely to express their own ideas when they disagree to the teachers representing a strong sense of self with the nature of individualism do not give them significant advantage. This may again have to do with the cram education for entrance examination, which emphasizes memorization more than creation and self consciousness. Those who always consult their parents before making a decision representing a passive character have a disadvantage but insignificant.
As for individual ability, artistic ability has no advantage and interpersonal communication skill has a disadvantage. These may imply that social network in high school is useless for entrance exam but diverse time available for school study. However, good English proficiency and math ability does provide a significant advantage!
females but only 49.5% in good quality university. In general females have high university enrollment rate but males enter better university more than females. On family background, parents with higher education or students from rich family have a advantage to enter good quality university. These may imply that more educated parents learned more information and care more about their children education as they know that education is an effective means for upper class dominance.4 Rich family
tends to offer more educational resources to their children, while poor family is usually subject to financial liquidity constraint for their children’s education investment.5 This is in accordance with Brewer, Eide, and Ehrenberg’s (1999) finding
that students from high income family and have more educated parents has greater opportunity to enter good university.
As different senior high school may apply different standards and criteria for academic performance evaluation, we further add an interaction term between academic performance and school quality, column (2) of Table 3 shows that the coefficient of interaction term is positive and significant. In other words, those students in good high school with better academic performance have a significant advantage to enter good university. This may also imply the synergy effect or peer effect of good high school matches with good students. The current entrance
4 Chuang and Chen (2011) find that in Taiwan education is an effective way to preserve upper class dominance.
5 We further divide family income into five categories, the results is positive and significant. That is, higher family income will bring a significant advantage to enter a good university.
examination education system plays a very important role to match elite schools with good students. For those students, peer effect is usually strong and positive. Note also that the addition of the interaction term does not change the estimation results of all other explanatory variables. However, the relative odd ratio of school quality drops from 2.194 to 1.275 but remain significant. This implies that excluding positive peer effect of elite school, the brand effect of school quality does exist. Moreover, the school brand effect of 1.275 has roughly the same magnitude as the peer effect of 1.188.
In column (3), we further consider the interaction term between after school supplementary education and students English and math ability, the result show a significant and positive effect. This implies that after school supplementary education helps in particular those students with good English and math ability to enter good university. The coefficient of after school supplementary education becomes negative, implying that the effect of after school supplementary education is not straight forward except for those with certain level of English and math ability. In column (4), we add the total score of university entrance exam and with no surprise we find that higher score in entrance exam will increase the odds to enter good university.
status, and extra curriculum experience in senior high school and further extracting out the peer effect of good school matching good students, we find there exists a brand effect for elite high school to enter elite university. That is, there is a brand value for the elite senior high school!
Table 4 Estimation results of relative odd ratio for general education track
(1) (2) (3) (4) Elite HS 2.194*** 1.275* 1.281* 1.234 (0.072) (0.176) (0.177) (0.174) Acad score 2.009*** 1.762*** 1.764*** 1.700*** (0.038) (0.066) (0.066) (0.065) Supp edu 1.034 1.032 0.649*** 0.556*** (0.036) (0.036) (0.080) (0.070) Cares HS 1.082* 1.082* 1.081* 1.028 (0.046) (0.046) (0.046) (0.044) Extra Curr 1.084** 1.084** 1.084** 1.048 (0.034) (0.034) (0.034) (0.034) Creativity 0.942* 0.943* 0.942* 0.944* (0.029) (0.029) (0.029) (0.030) Leadership 0.866*** 0.866*** 0.865*** 0.857*** (0.026) (0.026) (0.026) (0.026) Phy Pwr 1.034 1.034 1.032 1.072 (0.052) (0.052) (0.052) (0.054) Flex adj 1.071* 1.070* 1.070* 1.071* (0.043) (0.043) (0.043) (0.044) Own Opn 0.919 0.923 0.924 0.944 (0.066) (0.066) (0.066) (0.069) Passive 0.918 0.916 0.916 0.928 (0.050) (0.050) (0.050) (0.051) Art Ability 0.977 0.978 0.978 0.992 (0.014) (0.014) (0.014) (0.014) Oral Exp 0.989 0.990 0.990 0.995 (0.018) (0.018) (0.018) (0.018) Interper Com 0.933*** 0.932*** 0.932*** 0.942*** (0.018) (0.018) (0.018) (0.018)