Chen, C.-M., Hong, C.-M., Chen, S.-Y. & Liu, C.-Y. (2006). Mining Formative Evaluation Rules Using Web-based Learning Portfolios for Web-based Learning Systems. Educational Technology & Society, 9 (3), 69-87.
69 ISSN 1436-4522 (online) and 1176-3647 (print). © International Forum of Educational Technology & Society (IFETS). The authors and the forum jointly retain the
copyright of the articles. Permission to make digital or hard copies of part or all of this work for personal or classroom use is granted without fee provided that copies are not made or distributed for profit or commercial advantage and that copies bear the full citation on the first page. Copyrights for components of this work owned by others than IFETS must be honoured. Abstracting with credit is permitted. To copy otherwise, to republish, to post on servers, or to redistribute to lists, requires prior
Mining Formative Evaluation Rules Using Web-based Learning Portfolios
for Web-based Learning Systems
Chih-Ming Chen
Institute of Learning Tech, National Hualien Univ of Education, Hualien 970, Taiwan, R.O.C. [email protected]
Chin-Ming Hong
Institute of Applied Electronics Technology, National Taiwan Normal University, Taipei 106, Taiwan, R.O.C. [email protected]
Shyuan-Yi Chen
Institute of Industrial Education, National Taiwan Normal University, Taipei 106, Taiwan, R.O.C. [email protected]
Chao-Yu Liu
Institute of Learning Technology, National Hualien University of Education, Hualien 970, Taiwan, R.O.C. [email protected]
ABSTRACT
Learning performance assessment aims to evaluate what knowledge learners have acquired from teaching activities. Objective technical measures of learning performance are difficult to develop, but are extremely important for both teachers and learners. Learning performance assessment using learning portfolios or web server log data is becoming an essential research issue in web-based learning, owing to the rapid growth of e-learning systems and real application in teaching scenes. The traditional summative evaluation by performing examinations or feedback forms is usually employed to evaluate the learning performance for both the traditional classroom learning and the web-based learning. However, summative evaluation only considers final learning outcomes without considering learning processes of learners. This study presents a learning performance assessment scheme by combining four computational intelligence theories, i.e., the proposed refined K-means algorithm, the neuro-fuzzy classifier, the proposed feature reduction scheme, and fuzzy inference, to identify the learning performance assessment rules using the web-based learning portfolios of an individual learner. Experimental results indicate that the evaluation results of the proposed scheme are very close to those of summative assessment results of grade levels. In other words, this scheme can help teachers to assess individual learners precisely utilizing only the learning portfolios in a web-based learning environment. Additionally, teachers can devote themselves to teaching and designing courseware since they save a lot of time in evaluating learning. This idea can be beneficially applied to immediately examine the learning progress of learners, and to perform interactively control learning for e-learning systems. More significantly, teachers could understand the factors influencing e-learning performance in a web-based learning environment according to the obtained interpretable learning performance assessment rules.
Keywords:
Learning Performance Assessment, Web-based Learning, Web-based Learning Portfolio, Data Mining
Introduction
Gagnés’ research on the internal process of learning has indicated that the complete learning process should assess learning performance (Gagnés, 1997). Learning performance evaluation instruments can generally be classified as summative assessment and formative assessment (Torrance & Pryor, 1998; Campbell et al, 2000). While summative evaluation is generally performed after finishing an instruction unit or class, formative assessment emphasizes the learning process. Teachers can assess the overall learning performance using summative assessments. Conversely, the use of formative assessments helps teachers obtain feedback about how well students are learning and particular difficulties they might be having. The standard summative assessment scheme at course level is to perform either an examination or an assessment form. However, these methods cannot collect all learning process information. Since the formative assessment strongly emphasizes integrating “what people learned” with “how people learned”, the formative assessment occurs when teachers feed information back to students in ways that enable the student to learn better, or when students can engage in a self-reflective process. Therefore, while assessing learning performance using the portfolio has become increasingly popular, technology is facilitating its evolution and management (Torrance & Pryor, 1998;
Campbell et al, 2000; Lankes, 1995). Moreover, learning performance assessment based on the learning portfolio is a very useful concept for some fields of learning assessment, such as psychological testing, knowing how subjects take the test can be more important than their answers.
Traditional portfolio assessment relies on man-made data collection and a writing-centered learning process. Difficulties in data storage, search and management after long-term implementation have become problematic in developing and implementing portfolio assessment (Chang, 2002). In contrast, a web-based learning portfolio can be collected, stored and managed automatically by computers when learners interact with an e-learning platform. Therefore, learning performance assessment using a web-based learning portfolio has received significant attention recently (Lankes, 1995; Rahkila & Karjalainen, 1999; Wu & Leung, 2002). Rasmussen et al. (Rasmussen et al. 1997) suggested that Internet-based instruction could also allow student progress to be evaluated through participation in group discussions and portfolio development. Lankes (Lankes, 1995) stated that implementing computer-based student assessment portfolios is an innovative educational innovation owing to its ability not only to offer an authentic demonstration of accomplishments, but also enable students to take responsibility for their completed tasks. Rahkila (Rahkila & Karjalainen, 1999) also proposed using the user profiles with log data for the learning performance assessment, finding that it can be applied to interactively control learning effectively. Rahkila emphasized that the learning portfolio assessment is supported by the cognitive–constructive theory of learning (Rahkila & Karjalainen, 1999; Bruner, 1996). Zaiane (Zaiane & Luo, 2001) proposed applying web access logs and advanced data mining techniques to extract useful patterns that can help educators evaluate on-line course activities. Wang et al. (Wang et al. 2003) found that learning behavior information, commonly referred to as a learning portfolio, can help teachers understand why a learner obtained a high or low grade. Carrieira (Carrira & Crato, 2004) proposed monitoring users’ reading behaviors to infer their interest in particular articles.
However, developing a precise learning performance assessment scheme using web-based learning portfolio is a challenging task for web-based learning systems. Data mining, or knowledge discovery, attempts to obtain valuable knowledge from data stored in large repositories. Data mining has been considered as an appropriate method of knowledge discovery to excavate the implicit information (Dunham, 2002). This study presents a data mining approach that integrates four computational intelligence schemes, i.e., the refined K-means clustering algorithm, the neuro-fuzzy classifier (Nauck & Kruse, 1999), the proposed feature reduction scheme, and the fuzzy inference (Lin & Lee, 1996) , to evaluate on-line learning behavior and learning performance. The four computational intelligence schemes are employed to logically determine fuzzy membership functions for the neuro-fuzzy classifier, discover the fuzzy rules relating to the learning performance assessment, reduce the feature dimension of the discovered fuzzy rules, and infer the learning performance using the discovered fuzzy rules based on the learning portfolio of an individual learner, respectively.
The proposed learning performance assessment scheme was implemented on the personalized e-learning system, and its effectiveness was demonstrated in a real-world teaching scenario. Experimental results show that the proposed learning assessment scheme can correctly measure learners’ learning performance according to their learning portfolios as well as help teachers save a lot of time for the learning evaluation during the learning process. Significantly, the learning evaluation results were applied to help teachers examine the learning progress of learners and interactively control learning for the personalized e-learning system. The remainder of this study is organized as follow. Section 2 describes the problem description based on the gathered learning portfolios for the proposed learning performance assessment scheme. Section 3 explains the proposed learning performance assessment scheme. Section 4 presents the detailed experiments. Conclusions are drawn in Section 5.
Problem Description
Personalized E-learning System (PELS) with Learning Performance Assessment Mechanism Based on Learning Portfolios
The personalized e-learning system (PELS) based on the Item Response Theory, which includes an off-line courseware modeling process, four intelligent agents and four databases, is presented in our previous study for adaptive courseware recommendation (Chen,, Lee & Chen, 2005), (Chen, Liu & Chang, 2006). However, the PELS mainly focuses on performing adaptive learning based on the difficulty parameters of courseware and learner ability of individual learner, the learning performance assessment is lacked feature in this system. In this paper, the functionalities of the PELS system are extended to include the learning performance assessment agent
in order to perform the evaluation of learning performance using the gathered learning portfolios of individual learners. The extended system architecture is shown as Figure 1.
User Profile Database Learner Learning Interface Agent Courseware Recommendation Agent Test Agent Courseware Modeling Process Courseware Management
Agent Teacher AccountDatabase XML-based Courseware database Learning Performance Assessment Agent User Account Database Personalized Learning Module Courseware Construction Module Testing Items Database
Figure 1. The system architecture
Figure 2 shows the entire layout of the learning interface on PELS. In the left frame, system shows the course categories, course units and the list of all courseware in the courseware database using a hierarchical tree topology structure. While a learner clicks a courseware for learning, the content of selected courseware will be exhibited in the upper-right window. Besides, the feedback interface is arranged in the bottom-right window. The proposed system can get learner’s feedback response from the interface of feedback agent through learner replies one randomly testing question related to the conveyed learning content. The answer of testing question helps system to get the learner’s comprehension percentage for the recommended courseware. System passes the feedback response to the courseware recommendation agent to infer the learner’s ability using the item response theory (Baker & Frank, 1992) detailed in our previous study (Chen,, Lee & Chen, 2005; Chen, Liu & Chang, 2006). After a learner presses the button of “submit”, this system will reveal a list of the recommended courseware based on his current ability. After the learner selects the next courseware according to the suggestion of the courseware recommendation agent for further learning, the learner can continue to learn the selected courseware. The PELS will continue to run the learning cycle until the evaluated learner ability satisfies the stop criterion. Next, the learning procedure will enter the final testing stage to perform a summative assessment through replying 25 randomly selected testing questions. The results of final testing will be used to verify the evaluation quality of the proposed learning performance assessment approach in the analysis of experimental results. Besides, the learner can also log in the discussion board on PELS to publish the learning questions of the individual self or contribute helpful ideas for the learned course unit. The PELS will automatically gather the useful learning portfolios of individual learners for the learning performance assessment during learning processes.
Considered Learning Portfolio in the User Profile Database
The IMS Global Learning Consortium defined that ePortfolios are collections of personal information about a learner that represent accomplishments, goals, experiences, and other personalized records that a learner can present to schools, employers, or other entities (http://support.imsglobal.org/ePortfolio/). The ePortfolio specification developed by IMS Global Learning Consortium enables the use of the Internet for personalized, competency-based learning and assessment, enhanced career planning, and improved employment opportunities. In the meanwhile, the proposed ePortfolio specification supports many kinds of portfolios, including assessment ePortfolios, presentation ePortfolios, learning ePortfolios, personal development ePortfolios, and working ePortfolios. The IMS Global Learning Consortium also summarized that ePortfolio can contain personal information about the owners, achievements, interests and values, test and examination results, and so on. Next, the learning portfolio information collected by PELS for the proposed learning performance assessment approach is presented based on the IMS ePortfolio specification. This learning portfolio information was saved into the user profile database according to the learner’s interaction with PELS. Hence, the learning performance was graded according to their PELS learning portfolios. The eight gathered learning factors are described in detail as follows:
1. Reading rate of course materials (RR)
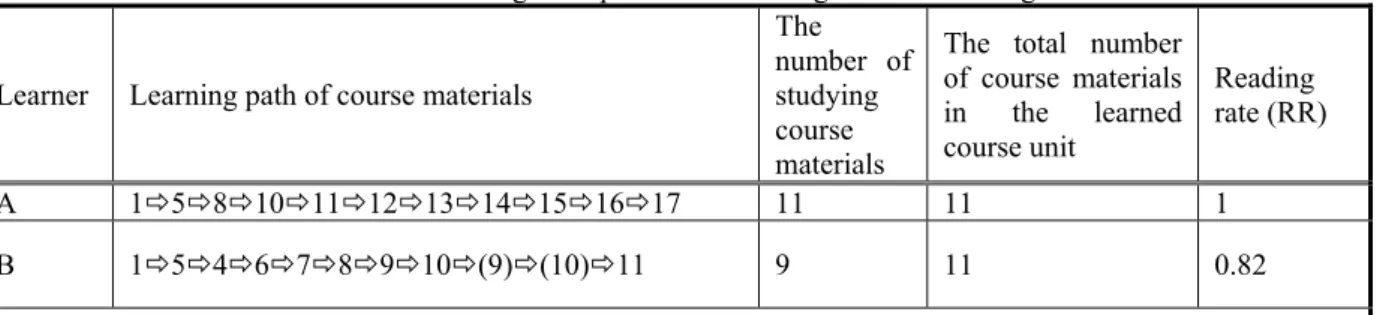
After a learner has logged onto the PELS system, the PELS automatically counts and accumulates the reading amount of the learned course materials for each learner. The learning parameter is progressively increased for each section learning process. Thus, the reading rate of course materials is defined as the rate of studying course materials in a course unit, and the notation RR is employed to represent the learning factor. Table 1 presents an example of calculating the reading rate for both the learners A and B in the learning course unit.
Table 1. A calculating example for the learning factor of reading rate
Learner Learning path of course materials
The
number of studying course materials
The total number of course materials in the learned course unit Reading rate (RR) A 1Ö5Ö8Ö10Ö11Ö12Ö13Ö14Ö15Ö16Ö17 11 11 1 B 1Ö5Ö4Ö6Ö7Ö8Ö9Ö10Ö(9)Ö(10)Ö11 9 11 0.82
2. Total accumulated reading time of all learned course materials (RT)
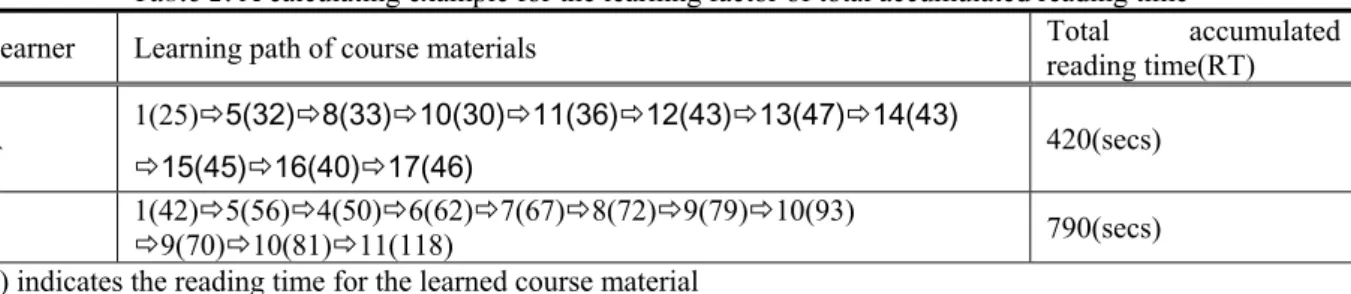
The total accumulated reading time of each learner is calculated by summing up the reading time of all learned course materials on the PELS system, and the notation RT is used to represent the learning factor. Table 2 presents an example of calculating the total accumulated reading time for both the learners A and B in the learning course unit.
Table 2. A calculating example for the learning factor of total accumulated reading time
Learner Learning path of course materials Total accumulated reading time(RT)
A 1(25)Ö5(32)Ö8(33)Ö10(30)Ö11(36)Ö12(43)Ö13(47)Ö14(43)
Ö15(45)Ö16(40)Ö17(46) 420(secs)
B 1(42)Ö5(56)Ö4(50)Ö6(62)Ö7(67)Ö8(72)Ö9(79)Ö10(93) Ö9(70)Ö10(81)Ö11(118) 790(secs) ( ) indicates the reading time for the learned course material
3. Learner ability evaluated by PELS (LA)
After studying the recommended courseware, the PELS (Chen, Lee & Chen, 2005; Chen, Liu & Chang, 2006) can dynamically estimate a learner’s ability according to the item response theory (Baker & Frank, 1992) by collecting the replied responses of the learner to the randomly selected testing questions in the learned course unit. The value denotes the learner’s ability in the learned course unit measured by the PELS system during the learning process, and the range of learner’s ability are limited from -3 (i.e. lowest ability) to +3 (i.e. highest ability). As a learner logs in this system, if the user account database does not have any history records in the selected course unit for this learner, then his initial ability will be regarded as 0. That is, the system assumes beginner’s ability is moderate level. As a learner clicked the recommended courseware for learning, his/her ability in this course unit will be re-evaluated according to his/her feedback responses and the corresponding difficulty parameter of the learned courseware. The notation LA is used to represent the learning factor of learner ability in this paper.
In the PELS, the quadrature form proposed by Bock and Mislevy (Baker & Frank, 1992) was employed to approximately estimate learner’s ability as follows:
∑
∑
θ θ θ θ θ = θ q k n k k q k k k n , k ) ( A ) | u ,..., u , u ( L ) ( A ) | u ,..., u u ( L ˆ 2 1 2 1(1)
where θˆ denotes the learner’s ability of estimation, L(u1,u2,L,un|θk) is the value of likelihood function at a level below their ability level θ and learner’s responses are k u1,u2,...,un, θ is the k kth split value of ability in the standard normal distribution, and A(θ represents the quadrature weight at a level below k) their ability level θ . k
In Eq. (1), the likelihood function L(u1,u2,L,un|θk) can be further described as follows:
∏
= − = n j u k j u k j k n P jQ j u u u L 1 1 2 1, , , | ) ( ) ( ) ( L θ θ θ(2)
where ( ) ) ( 1 ) ( j k j k b D b D k j e e P − − + = θ θ θ, Qj(θk)=1−Pj(θk),Pj(θ) denotes the probability that learners can understand the
j
th courseware at a level below their ability level θ , k Qj(θ represents the probability k)that learners cannot understand the jth courseware at a level below their ability level θ , k bj is the difficulty parameter of the
j
th courseware, and D is a constant 1.702, and U is the understanding or not junderstanding answer obtained from learner feedback to the jth courseware, i.e. if the answer is understanding then Uj =1; otherwise, Uj =0.
4. Correct response rate of randomly selecting testing questions (CR)
After a learner has studied the recommended course material, the PELS tests the learner on his understanding by randomly selecting a relevant question from the testing item database. The rate of correct responses to test questions helps determine the learner’s degree of understanding for all learned courseware, and the notation CR is used to represent the learning factor in this paper. For example, if a learner gave seven correct responses and three incorrect responses for ten randomly selecting testing questions from the testing item database, then the correct response rate is 0.7.
5. Posted amount of articles on the forum board (PN)
The PELS system can automatically count the total number of posted articles and answered questions on the forum board for each learner during the learning process. The value usually shows a learner level of participation in group discussion, and the notation PN is used to represent the learning factor in this paper. For example, if a learner posted three articles and answered five questions on the forum board, then the posted amount of articles on the forum board is eight pieces.
6. Accumulated score on the forum board (AS)
The PELS system gives various scores for the various interactive behaviors among learners on the forum board. In this study, the PELS will automatically increment a learner’s score of one point when he/she logs onto the forum board, and accumulate a learner’s score of two points if he/she posts an article on the forum board. The accumulated score on the forum board represents the level of useful feedback given by a learner, and the notation AS is used to represent the learning factor in this paper. For example, if a learner logged onto the forum board two times and posted three articles, then the accumulated score on the forum board will be eight points.
7. Effort level of studying course Materials (EL)
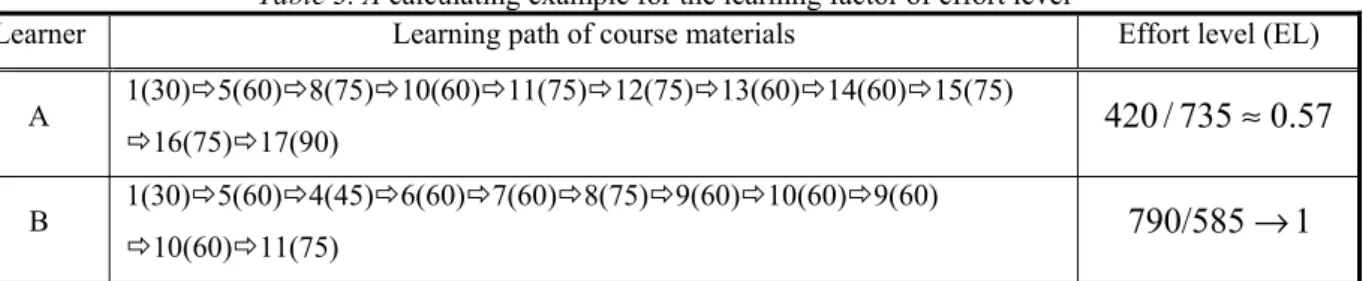
Since each course material in the PELS system is assigned a required minimum reading time by course experts based on the courseware content, the effort level is defined as the actual reading time compared with the required minimum reading time for the learned courseware, and the notation EL is used to represent the learning factor in this paper. Suppose the actual reading time of learners A and B in the learned course unit is 420 seconds and 790 seconds, respectively, and listed as Table 2. Table 3 presents an example of calculating the effort level for the learners A and B in the learned course unit. In this study, the range of the effort level is limited from 0 to 1. Restated, the value of the effort level will be assigned as 1 if the calculated value is over 1.
Table 3.A calculating examplefor the learning factor of effort level
Learner Learning path of course materials Effort level (EL)
A 1(30)Ö5(60)Ö8(75)Ö10(60)Ö11(75)Ö12(75)Ö13(60)Ö14(60)Ö15(75)
Ö16(75)Ö17(90)
420
/
735
≈
0
.
57
B 1(30)Ö5(60)Ö4(45)Ö6(60)Ö7(60)Ö8(75)Ö9(60)Ö10(60)Ö9(60)
Ö10(60)Ö11(75)
790/585
→
1
8. Final test grade (G)
This study measures the final test grade through the summative assessment scheme of fixed-length testing examination after the entire learning process is completed, and the notation G is used to represent the learning factor in this paper.
Mining Learning Performance Assessment Rules Based on Learning Portfolios
Flowchart of Mining Learning Performance Assessment Rules
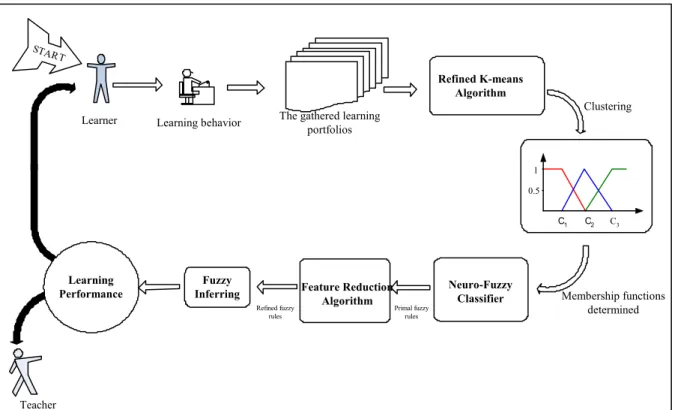
Figure 3 shows the entire flowchart of the proposed learning performance assessment scheme. The proposed refined K-means algorithm is initially employed to logically determine the fuzzy membership functions of each learning factor based on real data distribution of learning portfolios for mining learning performance assessment rules by the neuro-fuzzy classifier (Nauck & Kruse, 1999). After the fuzzy rules for learning performance assessment are identified by the neuro-fuzzy classifier, the feature reduction scheme is employed to simplify the linguistic terms of the discovered learning performance assessment rules under keeping a satisfied accuracy rate of learning performance assessment. This procedure aims to obtain simplified learning performance assessment rules for promoting the inferring efficiency in web-based learning systems as well as discover the main learning factors that affect the learning outcomes. Finally, the fuzzy inference is employed to grade the learning performance by the simplified fuzzy rules for individual learners. The following sections give details for the proposed learning performance assessment scheme for individual learners.
Teacher Learning Performance START Fuzzy Inferring 0.5 1 Feature Reduction Algorithm Refined fuzzy rules Primal fuzzy rules Neuro-Fuzzy Classifier
Learner Learning behavior The gathered learning
portfolios Refined K-means Algorithm Clustering C1 C2 C3 Membership functions determined
Figure 3. The flowchart of learning performance assessment
Mining Learning Performance Rules Using Web-based Learning Portfolios
Determining Fuzzy Membership Functions by the Refined K-means Algorithm for the Neuro-Fuzzy Classifier
This study employed the neuro-fuzzy classifier to discover the fuzzy knowledge rules from the learning portfolios for learning performance assessment. To identify the fuzzy knowledge rules by the neuron-fuzzy classifier, the membership functions used in the neuro-fuzzy classifier must be logically determined according to the data distribution of learning portfolios in advance. In this work, the proposed refined K-means clustering algorithm improved from the original K-means clustering algorithm (Xu & Wunsch, 2005) was employed to determine the centers of the triangle fuzzy membership functions automatically according to the data distribution
of each learning factor in learning portfolios for the neuro-fuzzy classifier herein. To obtain appropriate and interpretable learning performance assessment rules by the neuro-fuzzy classifier, this study sets the number of clusters in the refined K-means clustering algorithm as three based on the requirements of learning performance assessment in real teaching scenario. In other words, each considered learning factor contains three linguistic terms, i.e. low, moderate, and high, to describe a fuzzy rule. After that, the membership functions of the triangle fuzzy sets were automatically determined according to three cluster centers of each learning factor. Suppose the centers of three linguistic terms determined by the refined K-means clustering algorithm are respectively
c
1,2
c
, andc
3, the membership functions for the linguistic terms “low”, “moderate”, and “high” can be formulated as follows:i. The membership function for the linguistic term “low”
⎪
⎪
⎩
⎪⎪
⎨
⎧
≥
<
<
−
−
≤
=
2 2 1 1 2 2 10
1
)
(
c
x
if
c
x
c
if
c
c
x
c
c
x
if
x
Lowμ
(3)
ii. The membership function for the linguistic term “moderate”
⎪
⎪
⎪
⎪
⎩
⎪⎪
⎪
⎪
⎨
⎧
≥
<
<
−
−
=
<
<
−
−
≤
=
3 3 2 2 3 3 2 2 1 1 2 1 1 Moderate0
1
0
)
(
c
x
if
c
x
c
if
c
c
x
c
c
x
if
c
x
c
if
c
c
c
x
c
x
if
x
μ
(4)
iii. The membership function for the linguistic term “high”
⎪
⎪
⎩
⎪⎪
⎨
⎧
≥
<
<
−
−
≤
=
3 3 2 2 3 2 2 High1
0
)
(
c
x
if
c
x
c
if
c
c
c
x
c
x
if
x
μ
(5)
Next, the difference of the proposed refined K-means clustering algorithm with the original K-means clustering algorithm is compared and explained herein. Suppose there are
s
patterns in the gathered learning portfolios, the original K-means clustering algorithm is employed to find thek
centers for each learning factor, wheres
k
≤
, and the set of thek
cluster centers are represented as follows:{
l r k}
s c c c c
C ∈ 1,..., ,..., ,...,
(6) where Cs is the set of the
k
cluster centers, cl is the cluster center with the nearest Euclidean distance to the left boundary, and cr is the cluster center with the nearest Euclidean distance to the right boundary.In the proposed refined K-means clustering algorithm, the cluster centers cl and cr determined by the original K-means clustering algorithm are tuned by the refined value
δ
; moreover, the other cluster centers are unchangeable. The refined value is computed as follows:2
)
min(
)
max(
S
S
δ
=
+
(7) wheremax
( )
S
andmin
( )
S
represent the maximum and minimum feature values of patterns in each learning factor, respectively.Therefore, the new cluster centers determined by the refined K-means clustering algorithm can be represented as follows:
{
l r k}
new
s c c c c
C( )∈ 1,..., −δ,..., +δ,..., (8) where C(new) is the new set of the
k
cluster centers.Figure 4 gives an example to explain how to tune the membership functions by the refined value
δ
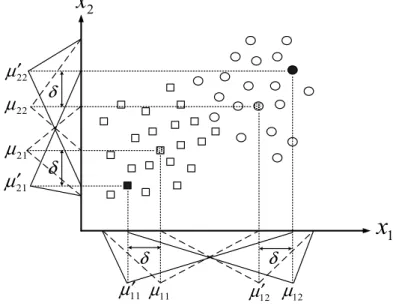
defined in the proposed refined K-means clustering algorithm. In Fig. 4, the circle and square notations with black and grey colors represent respectively the cluster centers determined by the K-means and refined K-means clustering algorithms. Moreover, the dotted and solid lines respectively represent the membership functions determined by the K-means and refined K-means clustering algorithms. Compared with the original K-means clustering algorithm, we find that the refined K-means clustering algorithm has benefits in terms of promoting classification ability for the boundary patterns between different classes and reducing the number of unknown patterns due to expanding the boundary range while employing the neuro-fuzzy classifier to discover the learning performance assessment rules based on learning portfolios. The later experimental results will confirm these benefits. 1x
2x
δ
δ
δδ
11μ
′
μ
12′ 21μ
′
22μ
′ 22μ
21μ
11μ
μ
12Figure 4. Tuning membership functions by the refined value
δ
, where the circle and square notations with black and grey colors respectively represent the cluster centers determined by the K-means clustering algorithm and refined K-means clustering algorithm, and the dotted and solid lines respectively represent the membershipfunctions determined by the K-means and refined K-means clustering algorithms
Neuro-Fuzzy Classifier for Mining Learning Performance Assessment Rules
After the triangle fuzzy membership functions were determined by the refined K-means clustering algorithm, the neuro-fuzzy classifier proposed by Nauck (Nauck & Kruse, 1999) was employed to infer the fuzzy rules for the learning performance assessment based on learning portfolios. Figure 5 shows the learning architecture of the used neuro-fuzzy classifier which can be represented as four-layer feed-forward networks. The first layer is the input layer which consists of input neurons and each neuron corresponds to an input feature. The second layer is the fuzzification layer which consists of fuzzy set neurons and each neuron corresponds to a linguistic term, such as low, moderate, and high, and so on. The third layer is the rule layer which consists of rule neurons and each neuron corresponds to a fuzzy rule. The fourth layer is the class layer which consists of class neurons and each neuron corresponds to a class label. To explain the detailed operation procedures of the neuro-fuzzy classifier, the notations used in Fig. 5 are first explained as follows:
x
k is thek
th input feature,μ
kl denotes thel
thmembership function of the
k
th input feature, Rulej
is thej
th fuzzy rule, and Classi
is thei
th output class. In addition,ar
j denotes the activation strength of thej
th neuron in the rule layer, andac
i denotes the activation strength of thei
th neuron in the class layer. Moreover, the input layer only receives input features from the gathered learning portfolios and directly passes the input features to the fuzzification layer for computing the fired membership degrees. Each fuzzy set neuron in the fuzzification layer could connect to several rule neurons and each rule neuron only connects to one class neuron, but each class neuron could be simultaneously connected by different rule neurons since different antecedent parts of fuzzy rules could lead to the same consequent part.1 ac aci acc i Class Classc 1
ar
ar
2ar
jar
r 1Rule Rule 2 Rule j Rule r
11
μ
μ
12μ
1mμ
klμ
n1μ
n2μ
nm1
Input Input k Input n
1
x
x
kx
n1 Class
Figure. 5 Four-layer learning architecture of the employed neuro-fuzzy classifier
In this study, the employed neuro-fuzzy classifier follows six steps to generate fuzzy rules for learning performance assessment, and summarized as follows:
Step 1. Computing the activation strength of each fuzzy neuron in the rule layer by the minimum operator, and
formulated as follows:
{ }
( ) ,..., 2 , 1min
j k n k ju
ar
==
(9) where
ar
j is the activation strength of the antecedent part of thej
th rule neuron,u
(kj) represents the membership degree of thej
th rule fired by thek
th input feature, which can be computed as{
k k km}
j
k
u
u
u
u
( )=
max
1,
2,...,
, andm
is the number of the defined linguistic terms of each input feature. Step 2. Computing the activation strength of each class neuron in the class layer by the maximum operator, andformulated as follows:
{ }
() ,..., 2 , 1max
i j z j iar
ac
i ==
(10) where
ac
i is the activation strength of the consequent part of thei
th class neuron,ar
j(i) represents the activation strength of thei
th class neuron fired by thej
th rule which is the set member of the activation strengths of the rule neurons represented asar
j(i)∈
{
ar
1,
ar
2,...,
ar
j,...,
ar
r}
, andz
i is the number of the fired fuzzy rules of thei
th class neuron, andz
i≤
r
.2
1
,
2
1
where
,
1r
,...,
,
j
c
,...,
,
i
)
X
(
ac
)
j
(
t
y p p ) j ( i i=
∑
=
=
=(11)
where
t
i(
j
)
is the class register value of thei
th class for thej
th rule,ac
i(j)(
X
p)
is the activation strength of thei
th class neuron fired by thep
th training pattern for thej
th rule, andy
is the total number of training patterns.Step 4.Finding the class label with the largest class register value for each fuzzy rule, and formulated as follows:
)}
j
(
t
{
max
arg
)
j
(
i c ,..., , i=12=
τ
(12)
where
τ
(
j
)
represents the class label with largest class register value for thej
th rule.Step 5. Evaluating the performance for each fuzzy rule, and formulated as follows:
∑
τ ≠ = τ−
=
i, c ,..., , i i ) j ((
j
)
t
(
j
)
t
)
j
(
p
2 1(13)
where
p
(
j
)
represents the performance of thej
th fuzzy rule,τ
(
j
)
is the class label with the largest class register value for thej
th fuzzy rule.Step 6. Collecting the fuzzy rules with the best performance in each class as the learning performance
assessment rules.
Feature Reduction Scheme for Simplifying the Learning Performance Assessment Rules
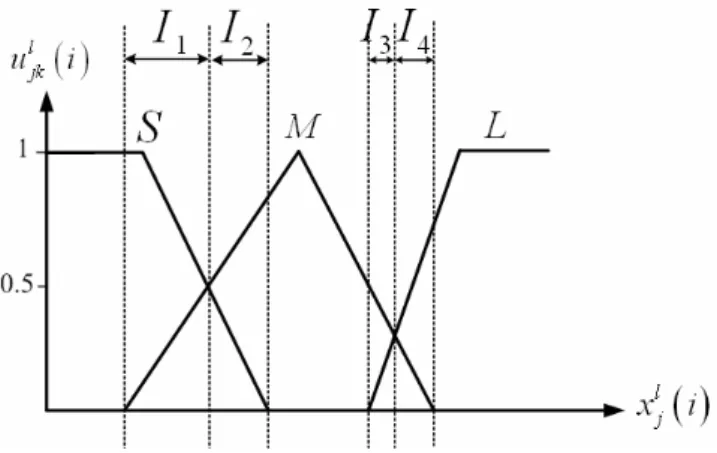
To generate greater efficient and even accurate fuzzy rules, the original fuzzy rules discovered by the neuro-fuzzy classifier can be refined by the proposed feature reduction scheme. In the feature reduction process, it is assumed that there are sufficient relevant features in the original feature set to discriminate clearly between categories, and that some irrelevant features can be eliminated to improve efficiency and even accuracy. Generally, elimination of redundancy will improve efficiency without losing accuracy, and elimination of noise will improve both efficiency and accuracy (Chakraborty & Pal, 2004). In particular, the antecedent parts of fuzzy rules discovered by the neuro-fuzzy classifier always contain all features so that the main relevant features related to the classification accuracy cannot be clearly revealed as well as the inference efficiency is descended. More significantly, the antecedent parts of the fuzzy rules discovered by the neuro-fuzzy classifier containing all features will lead to over strict fired conditions so that many patterns cannot be inferred, and called as unknown patterns herein. The number of unknown patterns will obviously reduce the classification accuracy rate. Moreover, the simplified fuzzy rules for learning performance assessment are more easily interpreted by teachers, thus helping teachers to tune their teaching strategies. Based on these reasons, this study proposes a feature reduction scheme to simplify the discovered fuzzy rules. To obtain the simplified fuzzy rules, the proposed feature reduction scheme only performs the feature reduction scheme to the fuzzy rules with the best performance in each class. After that, the feature reduction is performed based on the proposed performance evaluation method for all feature combinations of the antecedent parts containing in each discovered fuzzy rule. Figure 6 shows that the linguistic terms used in a fuzzy rule usually have overlapped intervals between two neighborhood linguistic terms, such as the intervals
I
1,
I
2,
I
3,
and
I
4. In these overlapped intervals, a training pattern with feature value mapped in the corresponding overlapped interval will simultaneously fire the antecedent parts of two linguistic terms defined in a feature dimension and the fired strengths of two linguistic terms are different. For example, the membership degree of the linguistic term “Small” fired by a training pattern with feature value mapped in the intervalI
1 is larger than the linguistic term “Moderate”. In contrast, the membership degree of the linguistic term “Small” fired by a training pattern with feature value mapped in the intervalI
2 is smaller than the linguistic term “Moderate”. Based on the observation, an excellent feature combination in a discovered fuzzy rule should trigger the membership degree on the fired linguistic term as large as possible, but trigger the membership degree on the other non-fired linguistic terms as small as possible when the discovered fuzzy rule is fired by a training pattern. Herein, the fired linguistic term indicates the linguistic term with the largest membership degree fired by a training pattern, and the other linguistic terms are viewed asthe non-fired linguistic terms. This study names the difference between the membership degree of the fired linguistic term with the summation of the membership degrees of the non-fired linguistic terms as the match degree. To develop the proposed feature reduction scheme, the match degree is first defined as follows:
( )
( )
∑
( )
λ ≠ = λ−
=
n k , k l jk l j l ji
u
i
u
i
u
1(14)
where
u
lj( )
i
represents the match degree of thej
th feature of thel
th fuzzy rule fired by thei
th training pattern,u
jkl(
i
)
is the membership degree of thek
th linguistic term of thej
th feature of thel
th fuzzy rule fired by thei
th training pattern,n
represents the number of the defined linguistic terms in each fuzzy rule,λ
indicates the linguistic term with the largest membership degree fired by thei
th training pattern.After the match degree is obtained, the performance of the discovered fuzzy rule with the considered feature combination can be measured as follows:
( )
ϕ
ϕ∑∑
= ==
j 1 1 t i l j l qi
u
v
(15)
where
v
ql represents the performance of thel
th fuzzy rule under theq
th feature combination,t
is the number of training patterns,ϕ
is the number of features,u
jl(
i
)
is the membership degree of thej
th feature of thel
thfuzzy rule fired by the
i
th training pattern.Moreover, the total number of feature combinations for a discovered fuzzy rule can be computed as follows:
(
)
∑
=−
=
p jj
!
p
j
!
!
p
g
1(16) where
g
is the total number of feature combinations for a discovered fuzzy rule,p
is the total number of feature dimensions,j
is the number of the considered features.Figure 6. The overlapped regions between various linguistic terms, where
u
jkl(
i
)
is the membership degree of thek
th linguistic term of thej
th feature of thel
th fuzzy rule fired by thei
th training pattern, andx
lj(
i
)
isthe feature value of the
i
th training pattern corresponding to thej
th feature of thel
th fuzzy ruleFuzzy Inference by the Discovered Fuzzy Rules for the Learning Performance Assessment
This section explains how to infer the learning performance according to the discovered fuzzy rules by fuzzy inference. The discovered fuzzy production rules are formed by IF-THEN rules represented as follows:
B Y THEN A X and A X IF = = =
where
X
i andY
denote linguistic variables, andA
i andB
represent linguistic terms.A defuzzification strategy aims to convert the outcome of fuzzy inference into a crisp class label. In this study, the maximum operator (Lin & Lee, 1996) is employed as the defuzzification scheme, to infer the crisp class label from the respective fired degrees of membership functions. Restated, the result of the learning performance assessment is assigned as the class label with the largest membership degree fired by a training pattern among the discovered fuzzy rules.
Experiments
The personalized e-learning system (PELS) was published on the web site http://192.192.6.86/irt4 to provide personalized e-learning services and assess the learning performance of individual learners by web-based learning portfolios. To verify the evaluation quality of the discovered fuzzy rules for the learning performance assessment, some third-year students of Jee-May Elementary School (http://www.jmes.tpc.edu.tw/), who had majored in the “Fractions” course unit in elementary school mathematics, were invited to test this system. The experimental results are described as follows.
The Format of Learning Portfolio Gathered by PELS
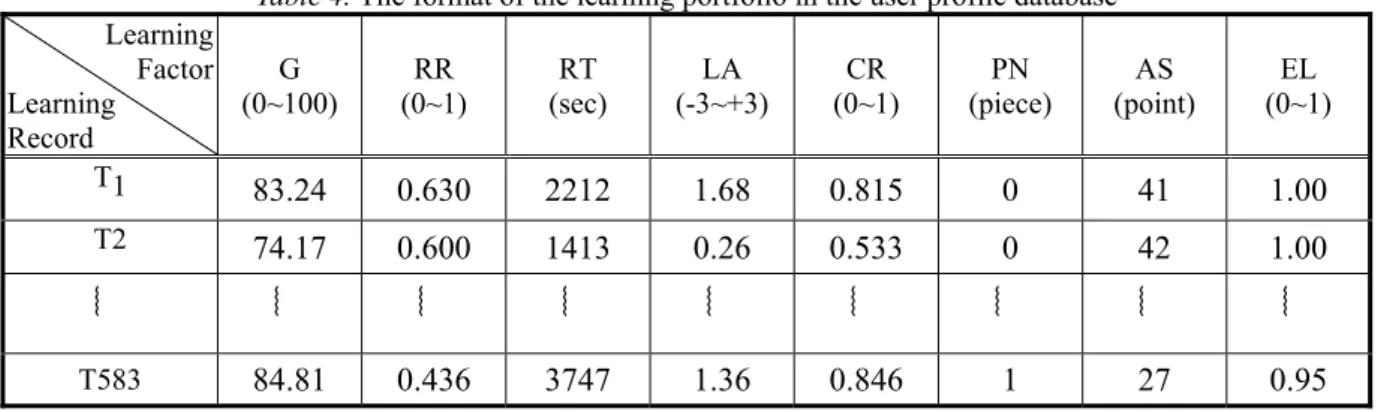
The “Fractions” unit currently includes a total of 17 course materials with various difficulty levels, each conveying similar concepts. The system was used by 583 learners from 18 different classes of Taipei County Jee-May Elementary School (http://www.jmes.tpc.edu.tw/). Among the eight gathered learning factors, the final testing score G was obtained through the summative assessment scheme of fixed-length testing examination after the entire learning process is completed. Table 4 shows the format of the partial learning portfolios in the user profile database gathered by PELS.
Table 4. The format of the learning portfolio in the user profile database
Learning Factor Learning Record
G
(0~100) (0~1) RR (sec) RT (-3~+3) LA (0~1) CR (piece) PN (point) AS (0~1) EL
T1 83.24 0.630 2212 1.68 0.815 0 41 1.00
T2 74.17 0.600 1413 0.26 0.533 0 42 1.00
︴ ︴ ︴ ︴ ︴ ︴ ︴ ︴ ︴
T583 84.81 0.436 3747 1.36 0.846 1 27 0.95
Evaluating Accuracy Rate of Learning Performance Assessment Evaluation Method
To measure the accuracy rate of learning performance assessment for the proposed method, the score level method was used to evaluate the accuracy rate of the predicted learning performance. In this evaluation method, each learner is assessed according to one of three score levels based on the mapping membership degrees of learning factor G. For example, the score level of a learner with a final test score of 86.16 was set to moderate level if the linguistic term of moderate level has the largest mapping membership degree among all linguistic terms of the learning factor G.
Experimental Results
In our experiments, half the learning portfolios among 583 learners selected randomly were used as training data and the remaining learning portfolios were used as testing data. Table 5 illustrates the number of learning records in each grade level. To obtain simple and interpretable fuzzy rules for learning performance assessment, the number of cluster centers in the K-means algorithm is set to 3. That is, each learning factor contains three
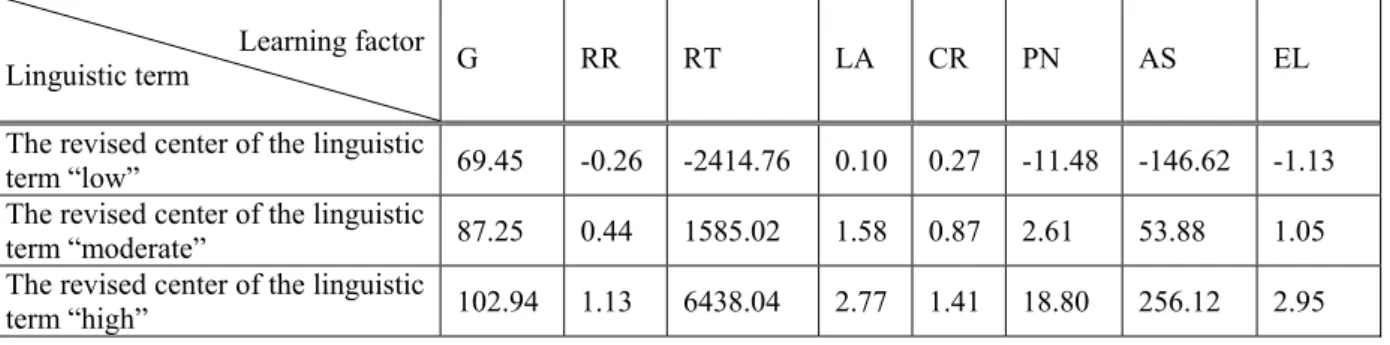
various linguistic terms to describe a fuzzy rule, and named as “low”, “moderate”, and “high” herein. Table 6 shows the determined centers of the linguistic terms for eight learning factors by the K-means algorithm. To obtain fuzzy rules for learning performance assessment more accurately, the proposed refined K-means algorithm was employed to tune the centers of the linguistic terms listed in Table 6. Tables 7 and 8 display the revised amount of cluster centers for each learning factor and the revised centers of the linguistic terms of eight learning factors by the refined K-means algorithm, respectively. Figure 7 reveals the membership functions of triangle fuzzy sets for eight learning factors determined by the revised centers of the linguistic terms in the refined K-means algorithm. Basically, the left and right widths of triangle membership functions of the linguistic terms “moderate” for each learning factor are determined by the differences between the self-center with the left and right neighborhood centers, respectively. Moreover, the left and right widths of triangle membership functions of the linguistic terms “low” and “high” for each learning factor are determined by the difference between the self-center with the left or right neighborhood center as well as the boundary of each learning factor.
Table 5. The number of learning records in each grade level
Training data set Testing data set Whole data set
Data set
Item Low Moderate High Low Moderate High Low Moderate High
Number of
patterns 51 194 47 65 188 38 116 382 85
Total number of
patterns 292 291 583
Table 6. The determined centers of the linguistic terms for eight learning factors by the K-means algorithm
Learning factor
Linguistic term G RR RT LA CR PN AS EL
The centers of the linguistic term
“low” 81.95 0.25 739.24 1.25 0.77 1.52 28.38 0.74
The centers of the linguistic term
“moderate” 87.25 0.44 1585.02 1.58 0.87 2.61 53.88 1.05
The centers of the linguistic term
“high” 90.44 0.63 3284.04 1.62 0.91 5.08 90.12 1.08
Table 7. The revised amount of cluster centers for each learning factor
Learning factor
Revised amount G RR RT LA CR PN AS EL
The revised amount
δ
12.5 0.5 3154 1.15 0.5 13 175 1.87Table 8. The revised centers of the linguistic terms of eight learning factors by the refined K-means algorithm
Learning factor
Linguistic term G RR RT LA CR PN AS EL
The revised center of the linguistic
term “low” 69.45 -0.26 -2414.76 0.10 0.27 -11.48 -146.62 -1.13
The revised center of the linguistic
term “moderate” 87.25 0.44 1585.02 1.58 0.87 2.61 53.88 1.05
The revised center of the linguistic
term “high” 102.94 1.13 6438.04 2.77 1.41 18.80 256.12 2.95
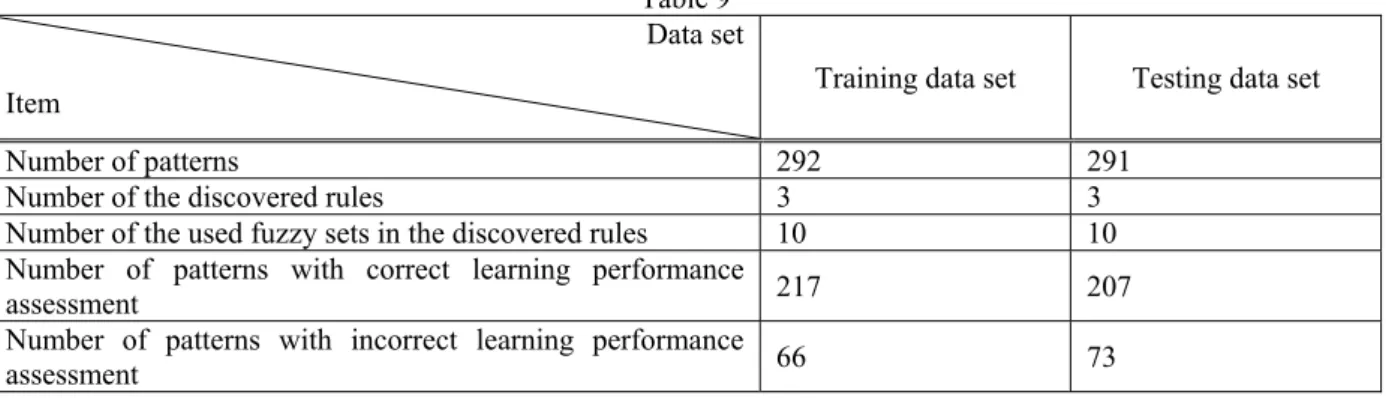
Next, the neuro-fuzzy neural network with the refined K-means algorithm for logically determining membership functions was employed to discover the formative evaluation rules based on the learning portfolios of the training data set. There are totally 24 fuzzy rules discovered by the employed neuro-fuzzy neural network in our
experiment. Among all discovered fuzzy rules, there are 10, 9, and 5 rules discovered for assessing the low, moderate, and high grade levels, respectively. Table 9 shows three fuzzy rules with the best performance for assessing three different grade levels based on gathered learning portfolios. In our experiment, ten independent runs were performed to yield an average performance for the training and testing data sets. Table 10 displays the averaged accuracy rate of learning performance assessment evaluated by the discovered rules listed in Table 9. The averaged accuracy rates of learning performance assessment for the training and testing data sets are 74.3% and 71.1%, respectively. 69.45 87.25 102.94 0 0.5 1 G -0.26 0.44 1.13 0 0.5 1 RR -2414.760 1585.02 6438.04 0.5 1 RT 0.1 1.58 2.77 0 0.5 1 LA 0.27 0.87 1.41 0 0.5 1 CR -11.48 2.61 18.8 0 0.5 1 PN -146.62 53.88 256.12 0 0.5 1 AS -1.13 1.05 2.95 0 0.5 1 EL
Figure 7. The membership functions of learning factors determined by the refined K-means algorithm
Table 9. The learning performance assessment fuzzy rules discovered by the neuro-fuzzy network with the
refined K-means algorithm for determining fuzzy membership functions
Antecedent part Consequent part
Learning factor
The discovered rule RR RT LA CR PN AS EL G
The rule 1 M M L L M M M Low
The rule 2 M M M M M M M Moderate
The rule 3 H M M M M M M High
Table 10. The accuracy rate of learning performance assessment evaluated by the discovered rules listed in
Table 9 Data set
Item Training data set Testing data set
Number of patterns 292 291
Number of the discovered rules 3 3
Number of the used fuzzy sets in the discovered rules 10 10
Number of patterns with correct learning performance
assessment 217 207
Number of patterns with incorrect learning performance
Number of patterns with unknown learning performance
assessment 9 11
Averaged accuracy rate of learning performance assessment 0.743 0.711
Table 11. All combinations of seven learning factors in the antecedent parts of the discovered fuzzy rules
evaluated in various training cycles Training cycle The combined learning factors
1~7 1
x
~x
7 8 1x
,x
2 9 1x
,x
3 10 1x
,x
4M
M
125 1x
,x
3,x
4,x
5,x
6,x
7 126 2x
,x
3,x
4,x
5,x
6,x
7 127 1x
,x
2,x
3,x
4,x
5,x
6,x
7 0 20 40 60 80 100 120 140 -10 0 10 20 30 40 50 60 70 80 90Training Procedure of Rule 3
P er for m anc e
Figure 8. The performance evaluation plot of the discovered rule 1 for assessing the low score level
Although the used neuro-fuzzy classifier with the refined K-means algorithm can discover as few fuzzy rules as possible to assess the learning performance of an individual learner accurately, the obtained fuzzy rules always contain all learning factors so that the main learning factors that affect the learning performance cannot be revealed clearly. To simplify the obtained fuzzy rules, the feature reduction scheme was employed to further reduce the fuzzy rules of learning performance assessment. In the proposed feature reduction scheme, the performance index defined in Eq. (17) for all combinations of learning factors of the antecedent parts of discovered rules will be used to find the main learning factors that affect the learning performance. Table 11 lists all combinations of seven learning factors contained in the antecedent parts of the discovered fuzzy rules, where
x
i represents thei
th considered learning factor, and their performances were respectively evaluated in various training cycles. Figures 8, 9 and 10 show the performance evaluation plots of the discovered rules 1, 2 and 3 for assessing the low, moderate and high score levels, respectively. Table 12 shows the learning factor combinations with top six excellent performances for three discovered fuzzy rules. In particular, the learning factor combination with best performance index among three discovered fuzzy rules isx
3,x
2 andx
1. The result indicates that the third learning factor of the discovered fuzzy rule 1, i.e. learner ability (LA), is the main learning factor for assessing the learners with low score level. Similarly, the results also indicate that the second and first learning factors are the main learning factors for the discovered fuzzy rules 2 and 3, respectively. Table 13 shows the simplified learning performance assessment rules after performing the proposed feature reduction scheme. Table 14 displays the accuracy rate of learning performance assessment by these simplified fuzzy rules.Compared with the results of learning performance assessment listed in Table 10, we find that the accuracy rate of the learning performance assessment using the simplified fuzzy rules is only slightly poor than the discovered fuzzy rules without performing feature reduction scheme. However, the simplified fuzzy rules provide benefits to teachers in terms of easily understanding main learning factors that affect learning performance for learners with various score levels (Paiva & Dourado, 2004; Mikut, Jakel & Groll, 2005). Moreover, this idea can be beneficially applied to immediately examine the learning progress of learners, and to perform interactively control learning for web-based learning systems. In the meanwhile, the simplified fuzzy rules will obviously promote the inference efficiency of learning performance assessment for web-based learning systems (Paiva & Dourado, 2004; Mikut, Jakel & Groll, 2005).
0 20 40 60 80 100 120 140 -10 -5 0 5 10 15 20
Training Procedure of Rule 3
P er for m anc e
Figure 9. The performance evaluation plot of the discovered rule 2 for assessing the moderate score level
0 20 40 60 80 100 120 140 -10 -5 0 5 10 15 20 25 30
Training Procedure of Rule 3
P er for m anc e
Figure 10. The performance evaluation plot of the discovered rule 3 for assessing the high score level
Table 12. The top six combined learning factors with excellent performance of learning performance assessment
for three discovered rules
The discovered rule 1 The discovered rule 2 The discovered rule 3
Training cycle The combined learning factor Performance
index Training cycle
The combined
learning factor
Performance
index Training cycle
The combined learning factor Performance index 3
x
3 82.71 2x
2 16.78 1x
1 27.50 19x
3,x
4 62.98 15x
2,x
4 16.29 8x
1,x
2 22.14 14x
2,x
3 49.75 4x
4 15.79 10x
1,x
4 21.65 44x
2,x
3,x
4 47.58 30x
1,x
2,x
4 15.00 30x
1,x
2,x
4 20.02 9x
1,x
3 47.57 8x
1,x
2 14.61 12x
1,x
6 18.98 21x
3,x
6 46.59 49x
2,x
4,x
6 14.34 32x
1,x
2,x
7 18.25Table 13. The discovered learning performance assessment rules after performing feature reduction
Antecedent part Consequent part Learning factor
The discovered rule RR RT LA G
The rule 1 L Low
The rule 2 M Moderate
The rule 3 H High
Table 14. The accuracy rate of learning performance assessment by the simplified fuzzy rules listed in Table 13
Data set
Item Training data set Testing data set
Number of patterns 292 291
Number of the discovered rules 3 3
Number of the used fuzzy sets in the
discovered rules 3 3
Number of patterns with correct learning
performance assessment 212 204
Number of patterns with incorrect learning
performance assessment 80 87
Number of patterns with unknown learning
performance assessment 0 0
Accuracy rate of learning performance
assessment 0.726 0.701
Conclusion
This study presents an effective learning performance assessment approach which contains the neuro-fuzzy network with the refined K-means algorithm for logically determining membership functions and the proposed feature reduction scheme to discover simplified and small amount fuzzy rules for evaluating learning performance of individual learners based on the gathered learning portfolios. The proposed method can help teachers to perform precise formative assessments according to the web-based learning portfolios of individual learners in a web-based learning environment. The inferred learning performance can be applied as a reference guide for teachers and as learning feedback for learners. Such a feedback mechanism enables learners to understand their current learning status and make suitable learning adjustments. Additionally, teachers can determine the main factors affecting learning performance in a web-based learning environment according to the interpretable learning performance assessment rules obtained. These factors can be used by teachers to tune their teaching strategies. Meanwhile, teachers can devote themselves to teaching job, since they save significant time in performing learning evaluation.
Acknowledgment
The authors would like to thank the National Science Council of the Republic of China, Taiwan for financially supporting this research under Contract No. NSC94-2520-S-026-002.
References
Baker, B. B., Baker, F. B., & Frank B. B. (1996), Item Response Theory: Parameter Estimation Techniques,
New York: Marcel Dekker.
Campbell, D., Nettles. D., & Melenyzer, B. (2000). Portfolio and Performance Assessment in Teacher Education, Boston: Allyn and Bacon.
Carrira, R., & Crato, J. M. (2004). Evaluating Adaptive User Profiles for News Classification. International Conference on Intelligent User Interfaces, January 13-16, 2004, 206-212.
Chakraborty, D., & Pal, N. R. (2004). A Neuro-Fuzzy Scheme for Simultaneous Feature Selection and Fuzzy
Rule-Based Classification. IEEE Transactions on Neural Networks, 15, 110–123.
Chang, C.-C. (2002). Building A Web-Based Learning Portfolio for Authentic Assessment. Proceedings of the International Conference on Computers in Education (Vol. 1), 129-133.
Chen, C.-M., Lee, H.-M., & Chen, Y.-H. (2005). Personalized E-Learning System Using Item Response Theory.
Computers & Education, 44 (3), 237-255.
Chen, C.-M., Liu, C.-Y., & Chang, M.-H. (2006). Personalized Curriculum Sequencing Using Modified Item Response Theory for Web-based Instruction. Expert Systems with Applications, 30 (2), 378-396.
Dunham, M. H. (2002). Data Mining: Introductory and Advanced Topics, Prentice Hall.
Gagnés, R, (1997). The Conditions of Learning and Theory of Instruction, New York: Holt, Reinehart &
Winston.
Lankes, A. M. D. (1995). Electronic Portfolios: A New Idea in Assessment, (ERIC Digest EDO-IR-95-9),
Available April 11, 2006 at http://searcheric.org/digests/ed390377.html.
Lin, C.-T., & Lee, C. S. G. (1996). Neural Fuzzy Systems: A Neuro-Fuzzy Synergism to Intelligent Systems,
Prentice-Hall.
Nauck, D., & Kruse, R. (1999). Obtaining Interpretable Fuzzy Classification Rules from Medical Data. Artificial Intelligence in Medicine, 16, 149-169.
Mikut, R., Jakel, J., & Groll, L. (2005).Interpretability Issues in Data-Based Learning of Fuzzy Systems.Fuzzy Sets and Systems, 150 (2), 179–197.
Paiva, R. P., & Dourado, A. (2004). Interpretability and Learning in Neuro-Fuzzy Systems. Fuzzy Sets and Systems, 147 (1), 17-38.
Rahkila, M., & Karjalainen, M. (1999). Evaluation of Learning in Computer based Education Using Log Systems. 29th ASEE/IEEE Frontiers in Education Conference, 1, 12A3/16-12A3/21.
Rasmussen, K., Northrup, P., & Lee, R. (1997). Implementing Web-based Instruction. In Khan, B. H. (Ed.),
Web-Based Instruction, Englewood Cliffs, NJ: Educational Technology, 341-346.
Torrance, H., & Pryor, J. (1998). Investigating Formative Assessment: Teaching, Learning and Assessment in the Classroom, Buckingham: Open University Press.
Wang, W., Weng, J.-F., Su, J.-M., & Tseng, S.-S. (2003). Learning Portfolio Analysis and Mining in SCORM Compliant Environment. The 34th ASEE/IEEE Frontiers in Education Conference, TC2-17-TC2-34.
Wu, A. K. W., & Leung, C. H. (2002). Evaluating Learning Behavior of Web-Based Training using Web Log. In Proceedings of the International Conference on Computers in Education,736-737.
Xu, R., & Wunsch, D. II (2005). Survey of Clustering Algorithms. IEEE Transactions on Neural Networks, 16
(3), 645-678.
Zaiane, O. R., & Luo, J. (2001). Towards Evaluating Learners' Behavior in a Web-based Distance Learning Environment. IEEE International Conference on Advanced Learning Technologies, 357-360.