ECONOMIC EFFICIENCY ANALYSIS OF WAFER FABRICATION FACILITIES
Wen-Chih Chen Chen-Fu Chien
Ming-Hsuan Chou
Dept. of Industrial Engineering and Management Dept. of Industrial Engineering and Engineering Manage-ment
National Chiao Tung University National Tsing Hua University
Hsinchu, 30010, TAIWAN ROC Hsinchu, 30013, TAIWAN ROC
ABSTRACT
Semiconductor industry is capital intensive and competi-tive, and thus efficiently utilizing resources to provide products and services is essential for maintaining competi-tive advantages. Knowing whether the resource is properly utilized is the foundation for future improvements and/or decision making. This study investigates the economic ef-ficiency of fabrication facility (fab) operations. We de-velop a two-stage overall efficiency model, which clearly defines and explains the “real” performance of fab produc-tion operaproduc-tions and the non-producproduc-tion issues. The model provides an overall performance index while considering different aspects. A single performance index can be used to evaluate and rank the performance for period review. Factors affecting performance can be identified. Further-more, according to a real case, an ex post relative effi-ciency analysis is conducted and the initial results are re-ported. The case study can help providing diagnosis for inefficient production facilities and identifying best prac-tices of efficient production units.
1 INTRODUCTION
Semiconductor manufacturing is a very capital incentive and competitive industry. Knowing how to utilize re-sources to provide products and services efficiently to maximize the profits is essential to sustain in this competi-tive business and towards success. Performance analysis is a foundational tool for monitoring, diagnosing and improv-ing the business activities and processes, and can thus steer the future direction of business strategies.
There are many different methods for performance evaluation in various applications. Benchmarking, learning from the best similar practices, is one of the helpful meth-ods. Performance benchmarking was popularized in the late 80’s by the successful stories of Hewlett-Packard and Xerox, (Camp 1989). It is a set of processes and practices used to determine (i) reference values for selected per-formance indices, and (ii) factors for key processes
affect-ing performance. Performance indices selected should be sufficient to represents all important objectives of a firm. Generally, there are trade-offs among firm’s objectives, and the trade-offs often lead to inconsistent conclusions among performance based on different indices. It is hence desired to establish a single index effectively representing the overall performance considering all aspects of a firm. In addition, understanding factors and/or practices affect-ing the performance is another key activity in benchmark-ing studies. Studybenchmark-ing the overall performance index and possible factors diagnoses the performance and suggests the improvement direction and possible approaches.
There are several benchmarking studies focusing on semiconductor industry, particularly regarding to the man-ufacturing aspect. Leachman and Hodge (1996) provide the first complete benchmarking study report in the competi-tive semiconductor manufacturing (CSM) program, which includes several leading companies around the world. Sev-en key performance indices (KPIs) are proposed in their study: cycle time per wafer layer, line yield, die yield, stepper productivity, direct labor productivity, total labor productivity, and on-time delivery. Associations between practices and performance are also presented. This is the first industry wide benchmarking study with rich data in semiconductor manufacturing. The CSM program also yields other relevant studies such as (Nickerson and Sloan 1997). Extending the studies in CSM program, Leachman, Ding, and Chien (2007) use data envelopment analysis (DEA) to provide an overall relative efficiency index. They use total wafer starts, number o steppers, direct and indi-rect headcount, and clean room size as the inputs and die output and effective revenue as the outputs. Factors and practices are also examined and identified according to the overall single performance index. Carbone (2000) applies DEA to evaluate the efficiencies of different production areas within a semiconductor fabrication facility (fab). In his work, machine failure rate, scrap rate, cycle time, and machine downtime are the resources, and outputs are wafer move rate, overall equipment efficiency, and activity ratio (actual moves/planned moves). Chien, Hsiao, and Wang Proceedings of the 2008 Winter Simulation Conference
(2004) also list a comprehensive set of performance indices used in semiconductor manufacturing practices, and they further categorize them as management indices and per-formance indices.
This paper aims to study economic efficiency on fab operations, particularly to evaluate the relative perform-ance of fabrication facilities. The study is motivated by the need of performance review and performance rank for each fabrication facility. The main function of a fab is manufac-turing, or named production, which utilizes resources to produce products to meet the demand. We propose a two-stage overall efficiency model, which clearly defines and classifies the “real” performance of fab production opera-tions and the non-production issues. The evaluation model provides an overall performance index while considering different aspects by adopting DEA method. A single per-formance index can used to evaluate and rank the perform-ance for period review. Furthermore, we also report the initial results of a benchmarking study according to a real case. The proposed model and method is demonstrated, and an ex post relative efficiency analysis is conducted. The case study can help providing diagnosis for inefficient decision making units and identifying best practices for ef-ficient decision making units.
The remainder of this paper is organized as follows. Section 2 presents a model for fabrication production proc-ess. The model gives a clearer picture of fabrication and a better reasoning of performance evaluation method pro-posed in Section 3. Section 3 also addresses some appeal-ing properties of our model. Section 4 provides the initial results of a benchmarking study based on a real case. Con-clusions are given in Section 5.
2 FABRICATION PRODUCTION PROCESS This study focuses on the performance analysis on fabs, particularly the manufacturing department. Fabs are the places where all production activities happen, and can be viewed as decision units utilizing resources, e.g., labor, equipments, etc., to provide products (outputs). A good
production unit can provide more outputs by using re-sources as few as possible. As one can observe, the physi-cal final product produced and delivered by a fab is wafers. In the literature and practices, typical productivity indices adopted use total wafer produced as the outputs. See (Chien, Hsiao, and Wang 2004; Leachman and Hodge, 1996; Leachman, Ding, and Chien 2007) for example. This is questionable and may underestimate the production per-formance as we will address. In this study, we propose a two-stage model to describe the transformation process from resources to final products in a fab.
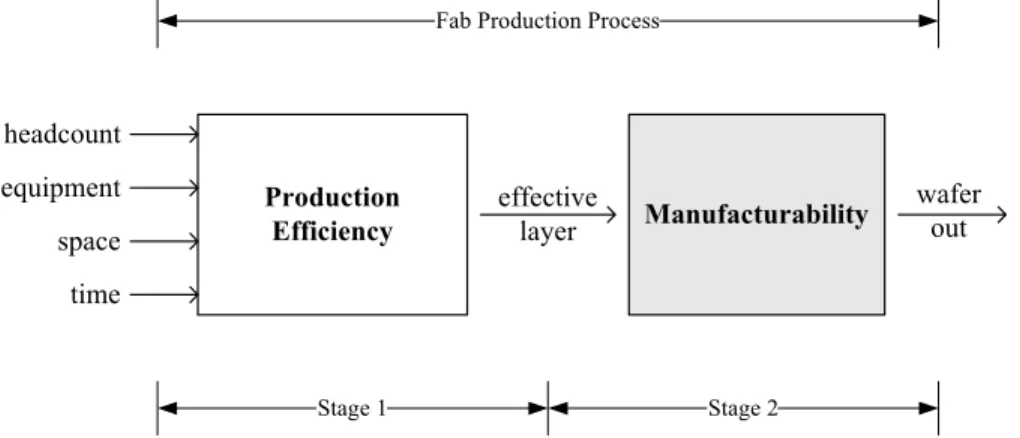
Figure 1 presents the two-stage process which de-scribes the activities in a fab. The first stage (Stage 1) is related to production efficiency, which is a process provid-ing maskprovid-ing layers (outputs) by consumprovid-ing labor, capital investments including equipments and space, and time. The first three resources are commonly found in other studies. Time, which is not as straightforward as the first three, is the total time used in the production. Given the same level of labor, equipment and space, more layers re-quire longer time. Similarly, for example, less labors (equipments) generally results in longer time to generate required layers, and this reveals the substitutability among resources. To have a clear understanding, it is better to in-terpret the output of Stage 1, layers, as a service provided than a product. Thus the performance at this stage is di-rectly related to production efficiency. A good perform-ance indicated in Stage 1, namely providing more layers by fewer resources, suggests that the production process is productive.
The second stage (Stage 2) shows the process of trans-forming layers to wafers. Different types of wafer products require different number of layers; this is related to manu-facturability. Design for manufacturability (DFM) is an engineering concept getting important nowadays, which includes a set of methodologies, of designing products in such a way that they are easy to manufacture. The manu-facturability is resulted from both engineering supports, particularly in R&D activities of design or manufacturing such as manufacturing recipe. It is also affected by the
Production Efficiency headcount equipment space time effective layer Manufacturability wafer out Fab Production Process
Stage 1 Stage 2
business strategies, e.g., allocating products to each fab. Some products require fewer layers per wafer and are eas-ier to produce. A fab allocated with products easeas-ier to pro-duce definitely will be easier to have superiors perform-ance than others. Number of layers is the number of processes required in wafer manufacturing. Larger number of wafer outputs with fewer layers is always preferred since it means fewer efforts in manufacturing.
It is worth mentioning that the combinations of re-source-output pair in both stages are identical to the most commonly used productivity indices. Index (effective layer / headcount) is identical to layer labor productivity, and (effective layer / equipment) is the layer labor productivity. Index (effective layer / space) corresponds to the effective-ness of space usage, and (effective layer / time) is the re-ciprocal of layer cycle time. The combination of wafer out and four resources have identical meanings as four indices but with respect to wafer. Number of layers required per wafer, of course, is one practical means to measure the product complexity.
Although number of wafer outputs is commonly used as part of a productivity index in conventional fab opera-tion performance evaluaopera-tion. Our two-stage model shows that using wafer output as the output may underestimate the performance of fabricator operations, particularly the manufacturing teams. This is because that the final outputs consist activities determined by and contributed from other departments, such as R&D (in manufacturing recipes) and central production planning department (in product alloca-tion). An efficient manufacturing team may produce less wafers due to poor manufacturability. In fact, the “real” re-sponsibility of a manufacturing team is to process various layers based on certain manufacturing recipes using what-ever resources on hand. That is the manufacturing team consumes resources to provide services (the layer process-ing) so that the final product (wafer) is produced by going through the complete required processes. The proposed model provides a better picture on the process of trans-forming resources invested to final products. Therefore, a fair performance evaluation can be conducted with fewer arguments, a more effective diagnosis can be provided, and true responsibility for each department can be identified.
Detailed definitions of resources and outputs are listed as followed:
• Effective Layers (L): is the total number of effec-tive masking layers produced monthly. In prac-tices, it can be collected as (total layers produced) × (average layer yield rate).
• Effective wafer outs (W): is the total number of effective wafers produced monthly. It can be col-lected as (total number of wafers produced)
×
(average wafer yield rate).• Headcount (HC): is the total labor employed in each month including direct and indirect labor. It also includes the management and assistant staff.
• Equipments (MC): is defined as the total installed capacity of steppers and scanners (exposure tools) used in the fab during the particular month. Since lithography equipment is generally the fab bottle-neck among all machine types, it serves as the best proxy for the equipment capacity of the fab. The literature uses total number of steppers and scanners, e.g., Leachman, Ding, and Chien (2007). Number of tools however ignores the dif-ference in production capability of the machines. For example, new tools may have higher through-put than old machines, and/or a more expensive machine may have better throughput as well. The difference on resulted throughput can yield sig-nificant impact on production performance. Hence, instead of tool number, weighted sum of installed tool capacity are used in our model for a better proxy.
• Space (S): is the total floor space used and avail-able for manufacturing. It reflects the infrastruc-ture investment, which becomes the limit of pro-duction capability.
• Time (T): is total time needed to produce total number of layers, and is computed as (total num-ber of layers)
×
(average cycle time per layer). It should be noticed that total layers, including ef-fective layers and defects, are considered. Time is a resource and defects result in resource waste; thus defects should be taken into account.3 MEASURING ECONOMIC EFFICIENCY
Conventional benchmarking studies in semiconductor manufacturing use different productivity indices, such as labor productivity and equipment productivity. However, trade-offs exist among productivity indices and can lead to inconsistent conclusions. DEA, introduced by Charnes, Cooper, and Rhodes in 1978, is a mathematical program-ming approach to compute relative efficiency. DEA con-siders many resources and outputs simultaneously and pro-vides a single overall efficiency score. Leachman, Ding, and Chien (2007) investigate the fab operation efficiency using DEA as the evaluation tool.
According to the proposed two-stage production proc-ess model, the output-oriented CCR DEA model (Charnes, Cooper, and Rhodes 1978) is employed to measure the ef-ficiency for both stages as follows:
; 0 , , . . max , t j t rk t k S j j rj t ik S j j ij t k S j O r y y I i x x t s t t j t k ∈ ∀ ≥ ∈ ∀ ≥ ∈ ∀ ≤
∑
∑
∈ ∈ λ φ λ λ φ λ φ (1)where t∈
{ }
1,2 representing Stages 1 and 2. Sets tI and
t
O are the resource set and output set, respectively, for stage t. Namely, I1= {HC, MC, S, T}, O1={L} ,
} {
2 L
I = and O2={W}. Set t
S stands for the collected records for stage t. Moreover,
x
ij andy
rj are the amounts of resource i and output r for record j, respectively, given corresponding stage for record set St. Subscript krepre-sents the record under evaluation, and t
S k∈ . Let 1* k
φ
and 2* kφ
be the optimal values corresponding to Stages 1 and 2 in (1), respectively. They are the effi-ciency scores for Stages 1 and 2. Value t*k
φ
indicates that the record k can generate t*k
φ
times of current output level while using the same level of resources. Clearly, t*≥1k
φ
, 1 * 1 = kφ
indicates that record k is CCR-efficient in produc-tion. Larger value of 1*k
φ
reveals more inefficient in pro-duction, namely, it has more significant edge losing to the best records. Similarly, if 2*=1k
φ
, record k is said to be CCR-efficient in manufacturability; record k has products that are the easiest to produce. A higher 2*k
φ
value shows less manufacturability, i.e., more difficult to produce.Moreover, the dual of model (1) is as follows (Char-nes, Cooper and Rhodes 1978):
. 0 , 0 , 1 }, { \ . . min , t r t i O r rk r t I i ik i O r rj r I i ik i v u O r v I i u y v k S j x u y v t s x u t t t t r i ∈ ∀ ≥ ∈ ∀ ≥ = ∈ ∀ ≥
∑
∑
∑
∑
∈ ∈ ∈ ∈ (2)Model (2) is equivalent to the following problem:
. 0 , 0 , 1 . . min t r t i t O r rj r I i ik i O r rk r I i ik i v u O r v I i u S j y v x u t s y v x u t t t t r i ∈ ∀ ≥ ∈ ∀ ≥ ∈ ∀ ≤
∑
∑
∑
∑
∈ ∈ ∈ ∈ (3)For Stage 1, Model (3) can be rewritten as follows:
. 0 , 0 , 0 , 0 , 0 , 1 . . min 1 ≥ ≥ ≥ ≥ ≥ ∈ ∀ ≤ + + + + + + L T S MC HC j L j T j S j MC j HC k L k T k S k MC k HC v u u u u S j L v T u S u MC u HC u t s L v T u S u MC u HC u (4) Let HC L HC w v u = , MC L MC w v u = , S L S w v u = , and T L T w v u = , Model (4) is rewritten as follows:
. 0 , 0 , 0 , 0 , 1 . . min 1 ≥ ≥ ≥ ≥ ∈ ∀ ≤ + + + + + + T S MC HC j j T j j S j j MC j j HC k k T k k S k k MC k k HC w w w w S j L T w L S w L MC w L HC w t s L T w L S w L MC w L HC w (5)
Model (5) has a nice interpretation. Indeed, HC/L is the number of headcount needed per layer, which is a commonly used labor productivity in the industry. More precisely, the reciprocal of the labor productivity. MC/L measures the equipment productivity; S/L represents the return rate on space, and T/L is the layer cycle time. There-fore, Model (5) evaluates record k by examining the weighted productivity on four aspects. Without assigning subjective predetermined weights of four aspects, weights are selected in favor (minimize the weighted index) of re-cord k, while normalizing other rere-cords’ score being no larger than one using the same weights.
In contrast to Stage 1, Stage 2 is more straightforward since there is only one resource and one output. The con-ventional single ratio approach can be easily adopted. The corresponding Model (1) t=2 will give the same results as using wafer per layer, “how many layers needed to be-come a complete wafer?” as the comparison metric.
4 PERFORMANCE ANALYSIS
This section presents the initial economic efficiency analy-sis results for a real case in Taiwan. The study is based on the comparison of four different production sites (fabs) within the same corporate. Thus this study has a more similar comparing basis than the investigation conducted by Leachman, Ding, and Chien (2007) since their study compares records from different companies around the world.
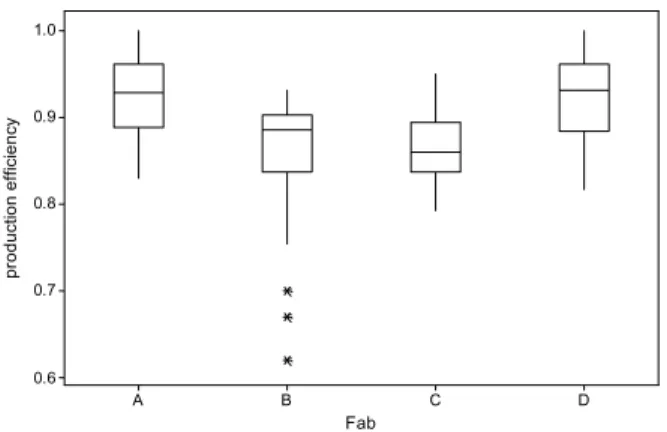
In the study, records for the last three years are col-lected for each fab, which represent monthly resources consumed and outputs produced. There are total 156 re-cords and the data are pooled together for comparison based on Model (1). Figures 2 and 3 are box plots for the CCR-efficiency scores on production efficiency and manu-facturability, respectively. In fact, the y-axis represents the reciprocal of t*
k
φ
in Model (1); a larger value is better. The x-axis associates with four fabs. There are some differ-ences among fabs on production efficiency (Figure 2); Fab C has the worst average production efficiency and Fabs A and D perform better than the other two. Fab C has poor manufacturability CCR-efficiency score (Figure 3), which indicates Fab C produces more complex products than the others. Fab C is worse than other three fabs within 10% in production efficiency, however, it has significant gap (dis-advantage) to the others in terms of manufacturability.D C B A 1.0 0.9 0.8 0.7 0.6 Fab pr oduc tion eff ic ienc y
Figure 2: Box plot of production efficiency
D C B A 1.00 0.95 0.90 0.85 0.80 Fab m anuf ac turabi lit y
Figure 3: Box plot of manufacturability
Another popular DEA model proposed by Banker et al. (1984) is as follows: ; 0 , 1 , , . . max , t j S j j t rk t k S j j rj t ik S j j ij t k S j O r y y I i x x t s t t t j t k ∈ ∀ ≥ = ∈ ∀ ≥ ∈ ∀ ≤
∑
∑
∑
∈ ∈ ∈ λ λ θ λ λ θ λ θ (6)where t∈
{ }
1,2 representing Stages 1 and 2. Model (6) has additional convexity constraint,∑
j∈Stλj =1, comparing to (1). The difference of optimal values for a particular re-cord k between models (1) and (2),* * t k t k θ φ , measures the
scale effect, named scale inefficiency (Banker, Charnes, and Cooper 1984). Clearly, * 1
* ≤ t k t k θ φ ; 1 * * = t k t k θ φ indicates that
records k is at the proper production scale, the most pro-ductive production scale (MPSS). 1
* * < t k t k θ φ reveals that k is
scale inefficient, namely k is not at the MPSS (Banker Charnes and Cooper 1984), too large or too small. Smaller
* * t k t k θ
φ shows more difference to the proper size it should be.
Moreover, the optimal solution of (1) related to k,
∑
∈= j St j k
*
λ
σ , provides information on k regarding to the relative scale position to the corresponding MPSS.
σ
k =2suggests that k is double to the size of MPSS, and scaling down in production scale may increase the productivity.
8 . 0 = k
σ
says size of k is only 80% to the right size it should be.Figures 4 and 5 are box plots for scale efficiency and the relative scale to the MPSS, respectively. Figure 4 shows that all records of Fabs B and C are scale inefficient, they are never in MPSS. Fab A is smaller than other three fabs. Fab A is ever only half of the MPSS while Fabs B and C can be as large as twice of the MPSS (Figure 5).
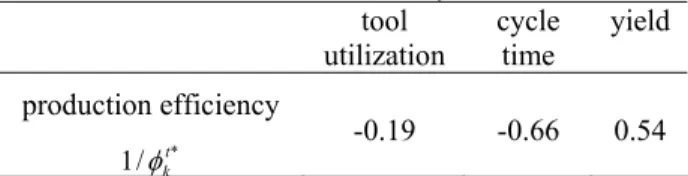
We also study the factors that determine the perform-ance, particularly the production efficiency. Table 1 sum-marizes the correlation coefficients between production ef-ficiency and three factors: tool utilization, cycle time and
yield. The correlation is measured using records of four fabs. It is found that utilization and cycle time are nega-tively associated with production efficiency (1/ t*
k
φ
). It means that longer cycle time associates with using more resources or producing less outputs. On the other hand, yield is positively correlated with production efficiency. Higher yield rate comes along with better performance in production efficiency.The initial results demonstrate that the proposed me-thod is able to provide useful information for fab operation improvements. More detailed study is on-going and com-plete results will be available.
5 CONCLUSION
Semiconductor industry is very competitive, in which effi-ciently utilizing resources to provide products and services is essential for maintaining competitive advantages. Know-ing whether the resource is properly utilized is the founda-tion for future improvements and/or decision making. This study aims to investigate economic efficiency on fabrica-tion operafabrica-tions. We propose a two-stage fabricafabrica-tion pro-duction model, which clearly defines and explains the “real” performance of fab production operations and the non-production issues manufacturability. A DEA model is built to provide an overall performance index considering different aspects. A single performance index can used to evaluate and rank the performance for period review. Fur-thermore, according to a real case, an ex post relative effi-ciency analysis is conducted and the initial results are re-ported. The initial results show that our model gives a clear picture on fabrication facility performance and better ex-planations on performance difference. It also hints that a complete case study can help providing diagnosis for inef-ficient decision making units and identifying factors affect-ing performance.
REFERENCES
Banker, R.D., A. Charnes, and W. W. Cooper. 1984. Some Models for Estimating Technical and Scale Inefficien-cies in Data Envelopment Analysis. Management Sci-ence 30:1078–1092.
Camp, R. C. 1989. Benchmarking: The search for indus-trial best practices that lead to superior performance. New York, NY and Milwaukee, WI, Quality Re-sources and ASQC Quality Press.
Carbone, T. A. 2000. Measuring efficiency of semiconduc-tor manufacturing operations using data envelopment analysis (DEA). In Proceeding 2000 IEEE/SEMI Adv. Semiconductor Manufacturing Conference, 56–62. Charnes, A., W.W. Cooper, and E. Rhodes. 1978.
Measur-ing the efficiency of decision makMeasur-ing units. European Journal of Operational Research 2(6):429-444. D C B A 1.000 0.975 0.950 0.925 0.900 0.875 0.850 Fab Sc al e eff ic ienc y
Figure 4: Box plot of scale efficiency in production
D C B A 2.00 1.75 1.50 1.25 1.00 0.75 0.50 Fab pr oduc tion sc al e
Figure 5: Box plot of scale efficiency in manufacturability
Table 1: Correlation coefficients between factors and pro-duction efficiency
tool utilization cycle time yield production efficiency * / 1 t k φ -0.19 -0.66 0.54
Chien, C.-F., A. Hsiao, and I. Wang. 2004. Constructing semiconductor manufacturing performance indexes and applying data mining for manufacturing data anal-ysis. Journal of the Chinese Institute of Industrial En-gineer 21(4):313-327.
Leachman, R.C., and D. A. Hodges. 1996. Benchmarking semiconductor manufacturing. IEEE Transactions on Semiconductor Manufacturing 9(2):158-169.
Leachman, R.C., S. Ding, and C.-F. Chien. 2007. Eco-nomic efficiency analysis of wafer fabrication. IEEE Transactions on Automation Science and Engineering 4(4):501-512
Nickerson, J. A., and T. W. Sloan. 1997. Data reduction techniques and hypothesis testing for analysis of ben-chmarking data. International Journal of Production Research 37(8):1717-1741.
AUTHOR BIOGRAPHIES
WEN-CHIH CHEN received the B.S. degree in Industrial Engineering from the National Tsing Hua University, Tai-wan in 1995. He received his Ph.D. from School of Indus-trial and Systems Engineering at Georgia Institute of Tech-nology, USA, in 2003. Dr. Chen is an Assistant Professor at Department of Industrial Engineering and Management in National Chiao Tung University, Taiwan. His current research interests focus on performance evaluation and de-cision making analysis in semiconductor manufacturing. Email: [email protected].
CHEN-FU CHIEN was born in 1966 in Taiwan, Republic of China. He received the B.S. degree with double majors (with Phi Tao Phi Honor) in Industrial Engineering and Electrical Engineering from the National Tsing Hua Uni-versity, Taiwan in 1990. He received the M.S. and Ph.D. degrees in Industrial Engineering, with two minors in Sta-tistics and Business, from the University of Wisconsin-Madison, U.S.A. in 1994 and 1996, respectively. Dr. Chien is a Professor in the Department of Industrial Engineering and Engineering Management, National Tsing Hua Uni-versity (NTHU). Since 2005, he is on-leave from NTHU to serve as Deputy Director of Industrial Engineering Divi-sion in Taiwan Semiconductor Manufacturing Company that is the world largest semiconductor foundry. He is a Fulbright Scholar in the Department of Industrial Engi-neering and Operations Research, University of California-Berkeley (2002-2003) and a Visiting Professor in Cam-bridge University (2004-2005, sponsored by Royal Soci-ety). He is a Steering Committee of Industrial Engineering Division in National Science Council, Taiwan. He is a member of IEEE, IIE, and INFORMS. He is now Board Member of the Chinese Institute of Decision Sciences and Chinese Institute of Industrial Engineers (CIIE). He re-ceived the Distinguished Young Industrial Engineer Award, the Distinguished Young Faculty Research Award
from NTHU, Best Paper Award from CIIE, Best Research Awards from the National Science Council, Distinguished Industrial Collaboration Award from the Ministry of Edu-cation, Best Engineering Paper Award by Chinese Institute of Engineers, and Tier 1 Principal Investigator (Top 3%) of National Science Council (2005-2008), Taiwan. His re-search and development efforts center on decision analysis, dada mining, modeling and analysis for semiconductor manufacturing, and production strategy.
MING-HSUAN CHOU is a M.S. student in the Depart-ment of Industrial Engineering and Engineering Manage-ment National Tsing Hua University, Taiwan. Her research interests include data envelopment analysis, performance evaluation and operations research.