應用線上分析處理與資料探勘監控網路入侵
58
0
0
全文
(2) 應用線上分析處理與資料探勘監控網路入侵 Monitoring Network Intrusion by OLAP and Data Mining. 研 究 生:曾于彰. Student:Yu-Chang Tseng. 指導教授:曾憲雄博士. Advisor:Dr. Shian-Shyong Tseng. 國 立 交 通 大 學 資 訊 科 學 系 碩 士 論 文. A Thesis Submitted to Institute of Computer and Information Science College of Electrical Engineering and Computer Science National Chiao Tung University in partial Fulfillment of the Requirements for the Degree of Master in Computer and Information Science June 2004 Hsinchu, Taiwan, Republic of China. 中華民國九十三年六月.
(3) 應用線上分析處理與資料探勘監控網路入侵 研究生:曾于彰. 指導教授:曾憲雄博士. 國立交通大學資訊科學系. 摘要. 隨著網路使用量的成長,網路服務的地位變得越來越重要,並且有越來越多的攻 擊被設計來入侵這些網路服務。許多研究探討了如何有系統地從各種資料來源分 析網路入侵行為,為了取各研究方法之所長來監控網路入侵行為,我們在這篇論 文中提出了網路入侵偵測系統(NIMS)來整合 KDD cup 99、Snort 警告記錄等等資 料,並且對這整合的資料進行多維度、多概念層級的網路行為分析。網路入侵偵 測係統共分為三個階段,分別是資料前處理階段、建立維度概念層級與資料立方 體(Data cube)階段以及資料分析階段。在資料前處理階段中,我們利用多來源資 料格式整合演算法來整合不同來源的資料格式,並且根據整合而得到的資料格式 利用資料來源轉換演算法來彙整多種不同的資料來源。在建立維度概念層級與資 料立方體(Data cube)階段以及資料分析階段中,我們利用維度概念層級知識擷取 演算法來導引網路領域專家建立網路資料概念層級,根據網路資料概念層級,在 前一階段彙整而成的資料便可轉換成資料立方體來進行多維度及多概念層級的 分析。在資料分析階段中,導引式監控介面協助管理者有效率的監控網路入侵行 為,並且允許使用者根據其所想要的維度顆粒大小,將資料立方體的網路資料匯 出,利用資料探勘工具對網路入侵行為進行更進一步地分析。 關鍵字:網路入侵、資料探勘、線上分析處理、監控、資料立方體. I.
(4) Monitoring Network Intrusion by OLAP and Data Mining Student: Yu-Chang Tseng. Advisor: Dr. Shian-Shyong Tseng. Depart of Computer and Information Science National Chiao Tung University. Abstract As. the. growth. of. network. environment. dramatically. increases,. the. network-based applications and services become more important, and a variety of network intrusions have also been developed to intrude these services. Previous researchers have developed different systematic approaches to analyze different network traffic sources. For monitoring network intrusion by taking advantages of these systematic approaches, a Network Intrusion Monitoring System (NIMS) Architecture is proposed in this thesis to integrate multiple data sources such as data set in KDD cup 99 and Snort alert log, etc. and to analyze network traffic data cross different concept level of each dimension. The NIMS Architecture consists of three phases: Data Preprocessing Phase, Concept Hierarchy and Data Cube Construction Phase and Data Analysis Phase. In Data Preprocessing Phase, the Multi-Source Data Format Integration (MSDFI) Algorithm is proposed to integrate multiple data source formats and Data Source Transformation (DST) Algorithm is proposed to merge multiple data sources according to the integrated data format generated by MSDFI algorithm. In Concept Hierarchy and Data Cube Construction Phase, the Dimension Concept Hierarchy Knowledge Acquisition (DCHKA) algorithm is proposed to guide experts to construct concept hierarchies of the integrated data. With the concept hierarchies, network traffic data can be easily transformed into a data cube for analyzing network traffic cross every concept level of each dimension. In Data Analysis Phase, the Guided Monitoring Interface (GMI) is proposed to assist administrators in monitoring network intrusions efficiently. At last the network traffic data at different concept level can be exported to DMAS according to the decisions of. II.
(5) administrators for mining more information and intrusion patterns at different concept level. Keyword: Intrusion, Data Mining, OLAP, Monitoring, Data Cube.. III.
(6) 誌謝. 這篇論文的完成,必須感謝許多人的協助與支持。首先必須感謝我的指導教 授,曾憲雄老師,由於他耐心的指導和勉勵,讓我得以順利完成此篇論文。此外, 在老師的帶領下,這兩年來,除了學習應有的專業知識外,對於待人處世的方面 也啟發不少,而研究上許多觀念的釐清更是讓我受益匪淺,真的十分感激。同時, 必須感謝我的口試委員,賴溪松教授、蔡文能教授與黃國禎教授,他們對這篇論 文提供了不少寶貴的建議。. 其次要感謝三位博士班的學長,林順傑學長、林耀聰學長和王慶堯學長。除 了在網路入侵偵測領域上讓我了解不少的知識外,在研究上或是系統的發展上都 提供了不少的建議及協助,且這篇論文能夠順利完成也得力於三位學長的幫忙。. 另外也要感謝實驗室的學長、同學以及學弟們,曲衍旭學長、翁瑞鋒學長、 溫建豪、蕭斯聰、黃柏智、吳政霖、李育松。不管是論文上或是系統的建置上都 給我許多的協助與建議。同時也感謝其他的同學,溫建豪、陳家瑜、鄭佩琪、王 威、楊哲青,陪我度過這忙碌以及充實的碩士生涯。. 要感謝的人很多,無法一一詳述,在此僅向所有幫助過我的人,致上我最深 的謝意。. IV.
(7) Table of Content Abstract (In Chinese)................................................................................................... I Abstract........................................................................................................................ II Acknowledgement (In Chinese) ................................................................................IV Table of Content..........................................................................................................V List of Figures.............................................................................................................VI List of Algorithms .................................................................................................... VII Chapter 1: Introduction..........................................................................................1 Chapter 2: Related Work .......................................................................................4 2.1 Traditional network intrusion analysis approach ............................4 2.2 Using OLAP for log analysis...............................................................5 Chapter 3: Network Intrusion Monitoring System Architecture .......................7 3.1 Motivation.............................................................................................7 3.2 Architecture design..............................................................................9 Chapter 4: Data Preprocessing Phase .................................................................13 4.1 Data Format Integration ...................................................................13 4.2 Data Source Transformation ............................................................16 Chapter 5: Concept Hierarchy and Data Warehouse Construction ................20 5.1 Concept Hierarchy Construction .....................................................20 5.2 Data Warehouse Construction .........................................................26 5.3 Dimension table maintenance ...........................................................29 Chapter 6: Guided Monitoring Interface and Data Mining..............................30 6.1 Guided Monitoring Interface............................................................31 6.2 DMAS..................................................................................................38 Chapter 7: Experiments........................................................................................41 7.1 Experiments Network Environment ................................................41 Chapter 8: Conclusion ..........................................................................................46 References...................................................................................................................48. V.
(8) List of Figures Figure 3.1: Network Intrusion Monitoring System Architecture. 10. Figure 4.1: Integrated Feature Vector Format Example. 16. Figure 4.2: Data Source Transformation Procedures. 17. Figure 5.1: Network Traffic Feature Vector Format. 22. Figure 5.2: The Concept Hierarchy Example of Snort Alert. 25. Figure 5.3: Network Traffic Fact Table. 27. Figure 5.4: Network Traffic Dimensions. 27. Figure 5.5: Data Cube Star Schema for Network Traffic Data. 28. Figure 6.1: Query Meta-data Example. 33. Figure 6.2: The Example of Alert Name Distributions in the Minute Concept Level of Time Dimension. 36. Figure 6.3: The Example of Alert Name Distributions in the Day Concept Level of Time Dimension. 37. Figure 6.4: The Example of Alert Priority Distributions in the Day Concept Level of Time Dimension. 37. Figure 7.1: NIMS Prototype in Experiments. 42. Figure 7.2: Concept Levels of Each Dimension of Network Traffic Data in Experiment 7.1 and Experiment 7.2.. 42. Figure 7.3: The Size of Dimension Table of Each Dimension of Network Traffic Data in Experiment 7.1 and Experiment 7.2. 43. Figure 7.4: Result of Experiment 7.1. 44. Figure 7.5: Result of Experiment 7.2. 45. VI.
(9) List of Algorithms Algorithm 1: Multi-Source Data Format Integration (MSDFI) Algorithm. 15. Algorithm 2: Data Source Transformation (DST) Algorithm. 18. Algorithm 3: Dimension Concept Hierarchy Knowledge Acquisition (DCHKA) Algorithm. 21. Algorithm 4: Cube Query Meta-data Construction (CQMC) Algorithm. VII. 32.
(10) Chapter 1:. Introduction. With the rapid development of Internet, the Internet is becoming more and more complicated, and the security on Internet is also becoming one of the most important issues today. However there are still many insecure areas in Internet today that can be compromised for different intentions. At this moment, many intrusions such as probing, user to root (U2R), remote to local (R2L) and Denial of Service (DoS) may threaten Internet service providers seriously. All of these intrusions could be treated as anomaly network behaviors. In order to detect and prevent these anomaly network behaviors, many IDSs or Firewalls have been developed to detect and prevent well-known intrusion patterns through packet based information, connection based information, or some statistical network information. These kinds of approaches may operate well if the significant features occurred in its collected information. However, many intrusions may not be detected by traditional analysis approaches.. Although some researches use machine learning method, like decision tree, classification, and data mining approach, to discover unknown patterns, lots of hidden intrusion patterns may still be escaped from these approaches because of insufficient information. Therefore, we are concerned with how to design a system architecture to help administrator discover intrusion patterns with network traffic data.. Previous researchers have developed systematic approaches to analyze network traffic [1], [7], [12], [15]. In those network traffic data sources, the data formats are usually pre-defined and hard to change. Continuous Query systems [7], [9] from the database field share many of the concerns of acquiring and filtering continuous 1.
(11) streams of data, but do not have the ability of easily adding new function over the data.. As we know, the traditional network intrusion analysis methods mentioned above usually use different data sources. Some researches have discussed how to get better analysis results using appropriate analytical methods. Our idea is to integrate multiple data sources to get an integrated data source, on which previous data mining researches can be applied. Multiple data sources contain different data formats, so they need to be preprocessed and transformed to an integrated data with a common data format. Therefore, a common data format is thus defined. In this thesis, a Network Intrusion Monitoring System Architecture will be proposed to integrate multiple data sources such as data set in KDD cup 99, Snort alert log, etc. and construct concept hierarchies of each dimension for monitoring and analysis. With OLAP and Data Mining technique, integrated network traffic data can be analyzed on different concept levels of multiple dimensions in the data cube and exported to Data mining tools such as DMAS[21] for discovering intrusion patterns.. The proposed Architecture consists of three phases: Data Preprocessing Phase, Concept Hierarchy and Data Cube Construction Phase and Data Analysis Phase. In Data Preprocessing Phase, the Multi-Source Data Format Integration (MSDFI) Algorithm is designed to integrate multiple data source formats into a common network traffic data format which can be used to merge multiple network traffic data sources. Data Source Transformation (DST) Algorithm is designed to integrate multiple network traffic data sources according to the common network traffic data format that MSDFI algorithm generated. In Concept Hierarchy and Data Cube 2.
(12) Construction Phase, the Dimension Concept Hierarchy Knowledge Acquisition (DCHKA) algorithm is designed to guide experts to construct concept hierarchies of each dimension of network traffic data for monitoring network intrusion. With the concept hierarchies of network traffic data, network traffic data can be easily transformed into a data cube. Since network traffic data has the characteristic of high dimensionality, its cube contains many dimensions and measures. Although OLAP server can offer some basic operations to analyze data cube, administrators still have difficulties to analyze network traffic in data cube efficiently. In Data Analysis Phase, the Guided Monitoring Interface (GMI) is designed to assist administrators in monitoring network intrusions efficiently. Through GMI, administrators can get data all the time and export the network traffic data at desired concept levels of all dimensions to DMAS for further mining.. As mentioned above, the amount of feature vectors to be aggregated and number of measures in the feature vector would affect the processing time of data cube. As shown in Experiments 7.1 and 7.2, the processing time of data cube can be acceptable and the network traffic data also can be analyzed in nearly real time.. The main contributions of this thesis are listed below: 1. Merging multiple data sources into an integrated data source for increasing the diversity of network intrusion analysis. 2. Constructing concept hierarchies of network traffic data for monitoring network intrusions cross every concept level of each dimension. 3. Assisting administrators exporting network traffic data in desired granularities of each dimension for network intrusion mining. 3.
(13) Chapter 2: 2.1. Related Work. Traditional network intrusion analysis approach As the cost of the information processing and Internet accessibility falls,. more and more organizations are becoming vulnerable to a wide variety of cyber threats. According to a recent survey by CERT/CC (Computer Emergency Response Team/Coordination Center), the rate of cyber attacks has been more than doubling every year in recent times. It has become increasingly important to establish our information systems, especially those used for critical functions in the military and commercial sectors, resistant to and tolerant of such attacks.. Intrusion detection includes identifying a set of malicious actions that compromise the integrity, confidentiality, and availability of information resources. Traditional methods for intrusion detection are based on extensive knowledge of signatures of known attacks, where monitored events are matched against the signatures to detect intrusions. These methods extract features from various audit streams, and detect intrusions by comparing the feature values to a set of attack signatures provided by human experts. The signature database has to be manually revised for each new type of intrusion that is discovered. A significant limitation of signature-based methods is that it is hard to detect emerging cyber threats, since by their very nature these threats may be launched using previously unknown attacks. In addition, even if a new attack is discovered and its signature is developed, often there is a substantial latency in its deployment across networks. These limitations have led to an increasing interest in intrusion detection techniques based upon data mining. 4.
(14) Previous researchers have developed systematic approaches to analyze network traffic [1], [12], [15], [7] and the format of network traffic is usually pre-defined and hard to change. Continuous Query systems [9], [7], share many of the concerns of acquiring and filtering continuous streams of data from the database field, but do not have the ability to easily add new function over that data.. 2.2. Using OLAP for log analysis OLAP can organize and present data in various formats in order to. accommodate the diverse needs of the different analysis approaches. OLAP server provides server operations for analyzing multidimensional data cube: (1) Roll-up: The roll-up operation collapses the dimension hierarchy along a particular dimension(s) so as to present the remaining dimensions at a coarser level of granularity. (2) Drill-down: In contrast, the drill-down function allows users to obtain a more detailed view of a given dimension. (3) Slice: Here, the objective is to extract a slice of the original cube corresponding to a single value of a given dimension. No aggregation is required with this option. Instead, server allows the user to focus on desired values. (4) Dice: A related operation is the dice. In this case, users can define a subcube of the original space. In other words, by specifying value ranges on one or more dimensions, the user can highlight meaningful. 5.
(15) blocks of aggregated data. (5) Pivot: The pivot is a simple but effective operation that allows OLAP users to visualize cube values in more natural and intuitive ways.. [10] discussed a specific implementation of using OLAP (On-Line Analytical Processing) technology on log analysis. The OLAP architecture is flexible in analyzing data; however only single data source is used in this architecture. Data source is limited to Windows NT system log and concept hierarchies are pre-defined. The diversity of data source and the quality of concept hierarchies would affect the ability of analysis.. A Network Intrusion Monitoring System Architecture based on OLAP is proposed in this thesis to integrate multiple network traffic data sources. Various systematic analysis approaches can be applied through OLAP server using operations such as drill-down, roll-up, slicing, etc., and OLAM is then used to increase the diversity of network analysis result.. 6.
(16) Chapter 3:. Network. Intrusion. Monitoring. System. Architecture 3.1. Motivation As we know, the traditional methods for network intrusion analysis are. using different data sources. These approaches analyzed network traffic data according to the data format they defined in advance. Different researches discussed how to get better analysis results in different analytical methods. Some of these data sources have different features from others and some are different only on the concept level. Our idea is to integrate multiple data sources to get a more complete data source. With this integrated data source, many previous approaches can be applied on it.. The integrated data source, however, is just a flat structure due to the lack of no concept hierarchy. Sometimes, using generalized concept based upon a concept hierarchy in the data source can provide more information or meaning than using original feature-value representation. For example, if a host without any popular service has outbound traffic of 100,000 packets per second, it may be treated as a host generated “very large traffic” in a short period. In most environments, it is abnormal due to the distributed denial of service (DDoS) attacking signature. If knowledge of network environment can be abstracted from domain experts by a systematic Knowledge Acquisition process, concept hierarchies of each feature of the integrated complete data source can be used to show more meaningful information. Analyzing network traffic data from. 7.
(17) different concept levels in different viewpoints will get more interesting results by monitoring network intrusions. So, constructing concept hierarchies for the integrated network traffic will make network analysis result more meaningful.. We have two main goals for network intrusion monitoring and analysis. First, integrate multiple sources to get a more complete source so that many analysis approaches proposed by previous researches can be applied. Second, construct concept hierarchies of the integrated data source for more information being analyzed on different dimensions and different concept levels. So the following questions arise: (1) How to integrate multiple data sources? (2) How to analyze data from different concept level? (3) How to analyze data efficiently?. In order to increase diversity of network traffic data and dimensionality of analyzing network intrusion, a Network Intrusion Monitoring System Architecture is proposed to integrate different format data and construct concept hierarchies of each dimension for monitoring and analysis. With OLAP and Data Mining technique, integrated network traffic data can be analyzed on multiple dimension and different concept level in data cube using operations like roll-up, drill-down, slicing, etc.. 8.
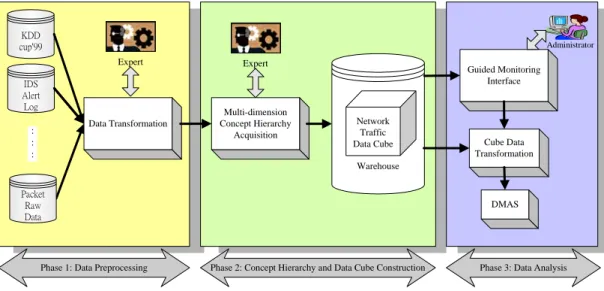
(18) 3.2. Architecture design For dealing with the questions mentioned above, Network Intrusion. Monitoring System shown in Figure 3.1 consists of three phases: Data Preprocessing Phase, Concept Hierarchy and Data Cube Construction Phase and Data Analysis Phase. In Data Preprocessing Phase, the Multi-Source Data Format Integration (MSDFI) Algorithm is proposed to integrate multiple data source formats into an integrated data format. Data Source Transformation (DST) Algorithm is proposed to integrate multiple network traffic data sources according to the integrated data format generated by MSDFI algorithm. In Concept Hierarchy and Data Cube Construction Phase, the Dimension Concept Hierarchy Knowledge Acquisition (DCHKA) algorithm is proposed to guide experts to construct concept hierarchies of each dimension of network traffic data .With the concept hierarchies, network traffic data can be easily transformed into a data cube for analyzing network traffic cross every concept level of each dimension. In Data Analysis Phase, the Guided Monitoring Interface (GMI) was proposed to assist administrators in monitoring network intrusions efficiently. At last the network traffic data at desired concept levels of all dimensions can be exported to DMAS for mining more information and intrusion patterns.. 9.
(19) KDD cup'99. Administrator. Expert. Expert. Data Transformation. Multi-dimension Concept Hierarchy Acquisition. IDS Alert Log : : :. Guided Monitoring Interface. Network Traffic Data Cube. Cube Data Transformation. Warehouse Packet Raw Data. DMAS. Phase 1: Data Preprocessing. Phase 2: Concept Hierarchy and Data Cube Construction. Phase 3: Data Analysis. Figure 3.1: Network Intrusion Monitoring System Architecture. 3.2.1 Data Preprocessing Phase Network traffic data such as data set in KDD cup 99, Snort alert log, etc. from every monitored host are transformed into a data set. By integrating different network traffic data, we can obtain more information from integrated network traffic data.. In this Phase, different format network traffic data can be integrated into a common format network traffic data by Multi-Source Data Format Integration (MSDFI) Algorithm. In other words, different data formats are integrated into one common feature format. With the common feature format, multiple data sources can be transformed into one data set according to our Data Source Transformation (DST) algorithm.. 10.
(20) 3.2.2 Concept Hierarchy and Data Warehouse Construction Phase After multiple data sources are integrated, a large data set which however is a flat data resource can be analyzed to obtain information behind the value in network abnormal status analysis. For example, if a host without any popular service has outbound traffic of 100,000 packets per second, it may be treated as a host generated “very large traffic” in a short period. In most environments, it is abnormal due to the distributed denial of service (DDoS) attacking signature. If knowledge of network environment can be abstracted from domain experts by a systematic Knowledge Acquisition process, concept hierarchy of each feature of the integrated complete data source can be used to show more meaningful information. Analyzing network traffic data from different concept levels in different viewpoints will get more interesting results by monitoring network intrusions. So, constructing concept hierarchy for the integrated network traffic will make network analysis result more meaningful.. A Dimension Concept Hierarchy Knowledge Acquisition (DCHKA) algorithm is proposed here to obtain concept hierarchies of each dimension for network traffic data from domain expert. With the concept hierarchy, integrated Network traffic data can be transformed into a data cube on OLAP server. OLAP server offers many operations for us to analyze data from different dimension and concept level. Administrators can roll up or drill down the concept level for further analysis.. 11.
(21) 3.2.3 Guided Monitoring Interface and Data Mining Phase Guided Monitoring Interface (GMI) assists administrator in analyzing the data cube for monitoring anomaly status caused by network intrusion. With a transformation procedure, administrators can export data from data cube to some data mining tool, such as DMAS[21]. Using Data Mining techniques, administrator can get more analysis result of network intrusion.. Network traffic data has the characteristic of high dimensionality. Because of containing many dimensions and concept levels, network traffic cube becomes very complicated. In order to offer administrators a systematic and efficient way to analyze data cube, a Guided Monitoring Interface (GMI) is proposed. Administrators are guided by Cube Query Meta-data Construction (CQMC) Algorithm to generate meta-data of abnormal network status. GMI then transforms the meta-data into a real data cube query language, and shows administrators the data exported from data cube. When abnormal network status is noticed by administrators, network traffic cube data are transformed into files which DMAS can read. Therefore data mining techniques can go deep into data and get more analysis results.. Through Network Intrusion Monitoring System, multiple data sources can be integrated to increase diversity of analysis approaches. Integrated data source can be analyzed on different dimensions and different concept levels to get more information.. 12.
(22) Chapter 4:. Data Preprocessing Phase. Because of adopting different network traffic data format, different researches use different methods and have different analysis results. For taking advantage of different analytical methods, integration of multiple data sources is a very important procedure. Multiple data sources contain different data formats, so they need to be preprocessed and transformed to an integrated data with a common data format.. In Multi-Source Data Format Integration (MSDFI) Algorithm, the concept of a new data source is generalized to the connection level first. If the concept of the new data source is already at connection level, the generalization is omitted. Second, features with different types of new data sources are added into the integrated data source. At last, the integrated data format can be used to merge multiple network traffic data sources.. Data Source Transformation (DST) Algorithm shows how to integrate multiple network traffic data sources according to the integrated data format that MSDFI algorithm generated.. 4.1. Data Format Integration. For integrating network traffic data format, there exist some issues that we have to consider: (1) Appropriate basic concept level of Schema Integration level In different data source, network traffic data are collected based on different scale. Network traffic can be aggregated by a connection, a host, or a period of 13.
(23) time. Different scale network traffic data can not be integrated directly. Multiple data scales have to be unified first and then the integration of multiple data sources can be realized.. MSDFI algorithm treats a connection as a basic unit in integrating multiple sources. Abnormal packets are caused by malicious users. A bad intension of malicious users would bring not only abnormal packets but also abnormal connections. In other words, many abnormal packets in a connection will cause the abnormality of connection they belong to. So it is reasonable to use a connection as a basic unit in integrating multiple sources.. (2) Type of values A value may present a number or a ratio. When a numerical feature is selected, not only the meaning of the feature but also the meaning of the value are important. A unified meaning of values should be established to integrate numerical features.. Ratio is calculated by dividing individual number by total number. Two ratios cannot be aggregated unless we know each ratio’s total number. MSDFI Algorithm adopts COUNT as the origin type of a numerical feature. Simple calculation is required when analyzing ratio data. No matter what kind of value type is needed in analysis processing, the desired values can be calculated eventually.. 14.
(24) (3) Features that only appear in parts of data Network traffic data contains several type of protocols and each protocol may contain special feature that does not appear in other protocols. For example, UDP has no urgent pointer, so the feature “number of urgent packets” is useful for TCP packets but meaningless for UDP packets.. MSDFI Algorithm fills up these features with zero or null. Zero means null in statistical point of view. In aggregating process, zero will not affect aggregation result. This is the real meaning of this value.. With above issues being concerned, Multi-Source Data Format Integration (MSDFI) Algorithm is proposed to integrate multiple network traffic data.. Algorithm 1: Multi-Source Data Format Integration (MSDFI) Algorithm Input:. New Data source Features and Previous Feature Vector. Output: Extended Feature Vector Format. Step 1:. Generalize the concept level of new data source features to connection.. Step 2:. Choose one feature from new data source features as the target feature.. Step 3:. Determine the type of target feature Step 3.1: If the type of target feature is numerical, transform the meaning of number into COUNT. Step 3.2: If the type of target feature is categorical, ask experts how to aggregate target features.. 15.
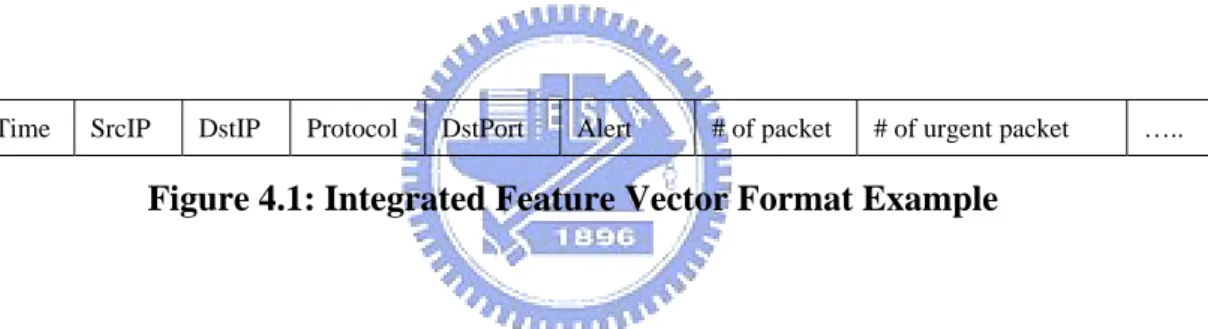
(25) Step 4:. Ask experts if the target feature exists in previous feature vector Step 4.1: If the target feature already exists, discard target feature. Step 4.2: Add the target feature into previous feature vector. Step 5:. If there exists any feature in new data source which has not been processed then go to Step 2; else the algorithm ends.. After data sources are integrated by MSDFI algorithm, an Integrated Feature Vector Format would be generalized for collecting network traffic data. For example, by integrating KDD’99 data set feature and Snort alert log data, we can get an integrated feature vector format shown in Figure 4.1.. Time. SrcIP. DstIP. Protocol. DstPort. Alert. # of packet. # of urgent packet. …... Figure 4.1: Integrated Feature Vector Format Example. According to Feature Vector Format, network traffic data can be collected online to offer the material for network analysis.. 4.2. Data Source Transformation After the integrated network traffic data format is generated, network traffic. data can be on-line collected and transformed into the integrated network traffic data in Network Intrusion Monitoring System. There are two procedures of data source transformation as shown in Figure 4.2:. 16.
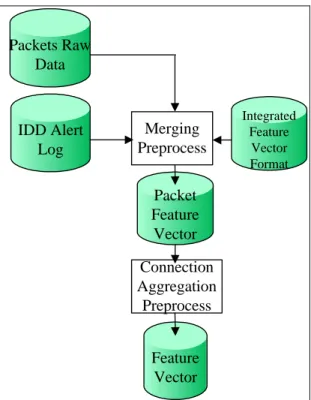
(26) Packets Raw Data. IDD Alert Log. Merging Preprocess. Integrated Feature Vector Format. Packet Feature Vector Connection Aggregation Preprocess Feature Vector. Figure 4.2: Data Source Transformation Procedures. In Merging Procedure, features from multiple data sources are merged into packets row data according to the integrated Feature Vector Format. Feature values from different data sources are transformed into proper data type and filled into corresponding Packet Feature Vector identified by KEY features. KEY features consist of several features: Time, Source IP, Destination IP, Protocol, Port (ICMP TYPE). In Connection Aggregation Procedure, Packet Feature Vectors with the same KEY feature values are aggregated into one connection feature vector. Connection feature vectors are generated from aggregating packet feature vectors in prevention of loosing all packet-based information. Finally data are transformed into millions of connection feature vectors after collecting network traffic data in about 20 hours.. 17.
(27) Algorithm 2: Input:. Data Source Transformation (DST) Algorithm. Feature Vector Format, Packets Raw Data and Snort Alert Log. Output: Connection Feature Vectors. Procedure 1: Merging Procedure Step 1:. Choose one packet data from Packets Raw Data as target packet.. Step 2:. Transform target packet raw data into a new Packet Feature Vector according to the feature vector format.. Step 3:. Find alert in Snort alert log which has the same KEY values as target packet. Add the features in Snort alert log into the corresponding features in Feature Vector.. Step 4:. Fills zero into other features in target Packet Feature Vector.. Step 5:. If there exists any packet in Packets Raw Data which has not been processed then go to Step 1; else the algorithm ends.. Procedure 2: Connection Aggregation Procedure Step 1:. Choose one Packet Feature Vector from Vectors generated in Procedure 1 as target Packet Feature Vector.. Step 2:. Find all packet feature vectors that have the same KEY feature values as target packet feature vector.. Step 3:. Add a new Connection Feature Vector as target.. Step 4:. Set the KEY feature values of target connection feature vector as the KEY feature values of target packet connection feature values.. Step 5:. Set other feature values as the aggregation result of packet feature vectors found in Step 2.. 18.
(28) Step 6:. If there exists any Packet Feature Vector which has not been processed then go to Step1; else the algorithm ends.. After collecting packets raw data and merging multiple data sources, packet feature vectors are aggregated into connection feature vectors. These feature vectors are used to build data cube in OLAP server for multi-dimensional analysis.. 19.
(29) Chapter 5:. Concept Hierarchy and Data Warehouse. Construction If network traffic concept hierarchies for integrated data source are constructed by Knowledge Acquisition process, the integrated network traffic data can be analyzed in different concept level. For example, the behavior of a host can be evaluated by analyzing IP dimension in ip-address concept level; however, behaviors of a subnet can be evaluated by analyzing network traffic in class-c concept level after concept hierarchies are constructed. With constructing concept hierarchies and data cube, evaluating behaviors in every concept level of IP dimension is natural because of roll-up and drill-down operations that OLAP server offered. Without constructing concept hierarchies and data cube, administrators have to search manually for network traffic data of a subnet from a flat data source for evaluating behavior of a subnet. Analyzing network behaviors on every concept level of every dimension would become easier with the assistance of the constructed concept hierarchies and data cube.. In this chapter, we describe how Dimension Concept Hierarchy Knowledge Acquisition (DCHKA) algorithm is used to construct concept hierarchies and how concept hierarchies are used to build a data cube.. 5.1. Concept Hierarchy Construction In the process of concept hierarchy construction, expertise of each. dimension is transformed into concept hierarchies according to a systematic knowledge acquisition process. Following the steps in Dimension Concept 20.
(30) Hierarchy Knowledge Acquisition (DCHKA) algorithm, experts are guided to construct concept hierarchy of each dimension step by step.. Concept hierarchy is constructed from bottom to top because the origin data collected in previous phase are based on the lowest concept level. Experts are guided to generalize concept from lower concept level to higher level and to define the mapping relations between values appearing in lower concept level and higher concept level. Repeat the steps in DCHKA algorithm for each dimension in the feature vector format and a concept hierarchy would be constructed at last.. Algorithm 3: Dimension Concept Hierarchy Knowledge Acquisition (DCHKA) Input:. Feature Vector Format. Output: Dimension hierarchy Step 1:. Choose one feature from feature vector format.. Step 2:. Ask experts if there is higher concept level of this feature. If there is a higher concept level then go to Step 3; else go back to Step1.. Step 3:. Ask experts for a name for this higher concept level.. Step 4:. Ask experts for all possible values in this higher concept level of this feature.. Step 5:. Ask experts whether there exists any concept level between base level and higher level. If there exists any level which can be defined between the higher level and the lower level then go to Step 2; else go to Step 6.. Step 6:. Ask experts for the mapping relations of values between every two adjacent levels.. Step 7:. If there exists any concept level higher than the highest concept level then go to Step3; else go to Step 8.. 21.
(31) Step 8:. If there exists any feature in feature vector format which has not been processed then go to Step 1; else the algorithm ends.. Concept hierarchy can be constructed by DCHKA algorithm and expertise is transferred into concept hierarchies of each dimension. With the help of expertise in the form of concept hierarchy, behaviors in different concept level can be evaluated and analyzed. The following is an example of constructing concept hierarchy of Alert dimension.. Example 5.1 : Constructing dimension concept hierarchy according to DCHKA Alert feature is chosen as our target dimension from network traffic feature vector format as shown in Figure 5.1. The Alert feature from Snort alert log was merged into the integrated data in data preprocessing phase. Snort alerts have been categorized into several classes according to the type of intrusions and alert classes are labeled with its priority from highest priority 1 to lowest priority 3. Experts can answer the questions according to the existing knowledge in the following steps or increase concept levels in their own opinion.. Step 1: Choose one feature from feature vector format as shown in Figure 5.1. Time. SrcIP. DstIP. Protocol. DstPort. Alert. # of packet. # of urgent packet. …... Figure 5.1: Network Traffic Feature Vector Format. Step 2:. Ask experts whether there is any concept level higher than the base. concept level of this feature.. 22.
(32) Step 3:. Ask experts for a name for this higher concept level.. Alert Class Alert. Step 4:. Ask experts for all possible values in this higher concept level of this. feature. Alert Class attempted-recon Misc-attack Web-application-activity Misc-activity network-scan ……. Step 5:. Ask experts whether there exists any concept level between base level. and higher level. If there exists any level which can be defined between the higher level and the lower level then go to Step 2; else go to Step 6. Step 6:. Ask experts for the mapping relations of values between every two. adjacent levels. Alert Class. Alert. Attempted-recon. SCAN Squid Proxy attempt ICMP PING NMAP SNMP request udp TFTP Get 23.
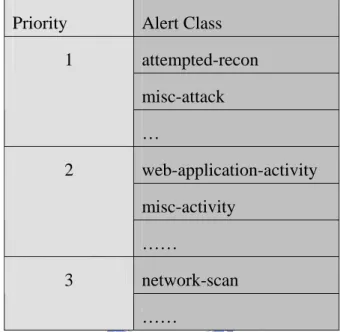
(33) …… Misc-attack. MS-SQL Worm propagation attempt MISC UPnP malformed advertisement ……. Web-application-activity WEB-IIS view source via translate header …… Misc-activity. ICMP PING CyberKit 2.2 Windows ICMP PING speedera ……. network-scan. SCAN UPnP service discover attempt ……. Step 7:. If there exists any concept level higher than the highest concept level. then go to Step3; else go to Step 8. Step 3:. Ask experts for a name for this higher concept level.. Priority Alert Class Alert. Step 4:. Ask experts for all possible values in this higher concept level of this. feature. Priority 1 2 3. 24.
(34) Step 5:. Ask experts whether there exists any concept level between base level. and higher level. If there exists any level which can be defined between the higher level and the lower level then go to Step 2; else go to Step 6. Step 6:. Ask experts for the mapping relations of values between every two. adjacent levels. Priority 1. Alert Class attempted-recon misc-attack …. 2. web-application-activity misc-activity ……. 3. network-scan ……. Figure 5.2: The Concept Hierarchy Example of Snort Aert.. Step 7:. If there exists any concept level higher than the highest concept level. then go to Step3; else go to Step 8. Step 8:. If there exists any feature in feature vector format which has not been. processed then go to Step 1; else the algorithm ends.. After the concept hierarchy of alert is constructed, administrators can evaluate network status from different concept level. The number of alerts of every alert priority can represent the distributions of bad intension behaviors, and administrators can drill-down to alert class level to analyze network status in advance.. 25.
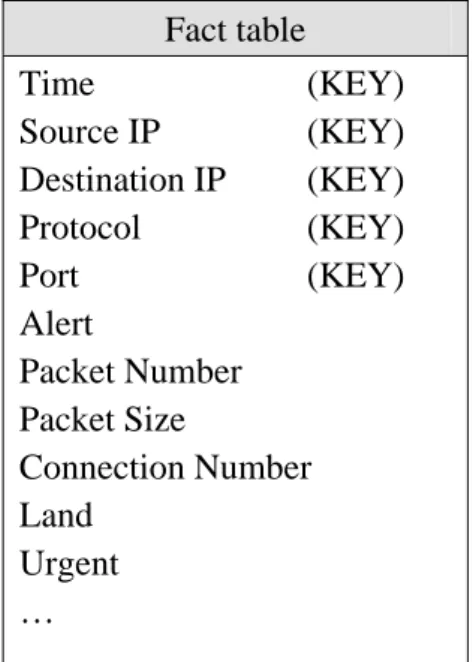
(35) 5.2. Data Warehouse Construction OLAP server provides server operations for analyzing multidimensional data. cube: roll-up, drill-down, slice, dice, pivot, etc. With the assistance of OLAP server operations, network traffic data can be analyzed in multiple dimensions and cross every concept level.. After constructing dimension concept hierarchies, network traffic data cube can be built according to the following steps:. (1) Choosing data cube schema The most common modeling paradigm is the star schema, in which the data warehouse contains (i) a large central table (fact table) containing the bulk of the data, with no redundancy, and (ii) a set of smaller attendant tables (dimension tables), one for each dimension. The schema graph resembles a starburst, with the dimension tables displayed in a radial pattern around the central fact table. In network traffic data, star schema is the most suitable schema for the relation between raw data and concept hierarchies.. (2) Choosing fact table Fact table is the place where network traffic integrated data are stored. Integrated data are transformed into connection feature vectors in Data Preprocessing Phase, and then stored in fact table without generalization or aggregation. The format for fact table is the same as connection feature vector mentioned in Data Preprocessing Phase. Some field is related to dimension table and others are measures. The format of Network Traffic Fact Table is shown in Figure 5.3. 26.
(36) Fact table Time (KEY) Source IP (KEY) Destination IP (KEY) Protocol (KEY) Port (KEY) Alert Packet Number Packet Size Connection Number Land Urgent … Figure 5.3: Network Traffic Fact Table. (3) Choosing dimensions Behaviors can be evaluated by measures from different dimension. Measures are aggregated according to the chosen dimension and concept level that administrators are interested in. For example, if Source Time dimension and Minute concept level are chosen, connections during one minute are treated as a group. Measures of connections are aggregated to be measures of the connections group and behaviors of this group are evaluated by the aggregated measures. Network traffic data contains dimensions as shown in Figure 5.4. Time Dimension Source IP dimension Destination IP Port Dimension Alert Dimension … Figure 5.4: Network Traffic Dimensions 27.
(37) (4) Choosing measures Features which are used to evaluate behaviors can be chosen to be measures. Measures are aggregated when concept level is generalized from low concept level to higher concept level. In network traffic data, feature such as Packet Number, Packet size, Connection Number, Number of Urgent packets, Land, etc. are chosen to be measures. Administrators traverse cross every concept level to estimate the status of network by observing the changing of measures. For example, total packets size can be used to evaluate behavior of a host or a subnet. When concept level generalized to the subnet concept level, total packets size of all hosts belong to the same subnet are aggregated to get the total packets size of a subnet.. Following the steps mentioned above, a star schema as shown in Figure 5.5 of network traffic data cube can be constructed.. Figure 5.5: Data Cube Star Schema for Network Traffic Data. 28.
(38) 5.3. Dimension table maintenance Dimensions in network traffic data have the characteristic that the number of. values in each concept level is large. For example, the number of all possible values of ip addresses is 256*256*256*256, but only tiny fragment which ranges from thousands to ten thousands will appear in our network traffic data. It is stupid and impossible to maintain all ip addresses in Source IP dimension table or Destination IP dimension table. Only ip addresses which communicate to monitored hosts are maintained in dimension table. When a new ip address appears, the new ip address is added into dimension table and the corresponding higher concept level value is confirmed. If the higher concept level value of the new ip address does not exist in dimension table either, new higher concept level value is added. As time goes on, the size of dimension table becomes very large so that a proper method to decease the size of dimension table such as deleting the ip addresses that do not appear for a long time is needed.. Other dimensions such as Alert and Port have the similar characteristic. It is unnecessary to store values that never appear or not appear for a long time in network traffic data into dimension tables. This will cause the low performance of OLAP server because of dispensable join time and query time. So dimension tables with this characteristic should be adjusted dynamically for higher system performance.. 29.
(39) Chapter 6:. Guided. Monitoring. Interface. and. Data. Mining Network traffic data has the characteristic of high dimensionality. Network traffic data cube contains many dimensions and measures. Although OLAP server had offered some basic operations to analyze data cube, administrators still have difficulties to analyze network traffic in data cube efficiently. The dimension and concept level information that are desired have to be transformed into a data cube language, such as Multidimensional Expressions (MDX) on Microsoft Analysis Service. Without any assistance, Administrators are required to have the ability to transform the dimension and concept level information into a data cube query language for monitoring network status using data cube. Administrators can study the data cube query language and query the desired data on their own or be guided to specify the dimension and concept level information about the desired data. The information about the desired data can be transformed into query meta-data and the rest work of query from data cube can be handled by a transformation component according to query meta-data automatically. After the dimension information of interesting network traffic data are specified, administrators can analyze the network status cross every concept level by changing the concept level information. Data mining techniques can be applied to help administrators analyze the interesting network traffic data cross every level in every dimension. Network traffic can be divided into clusters according to the similarity of their behaviors and administrators can analyze the behavior similarity for intrusion pattern discovery. Other Data Mining techniques can be applied to get different helpful information and patterns of network intrusion.. 30.
(40) Guided Monitoring Interface (GMI) is proposed to assist administrators in analyzing data cube efficiently. Administrators can build up query meta-data of the desired data, and GMI transforms the meta-data into a data cube query language to get data from data cube. After query meta-data is built, administrators can get data through GMI all the time and export the network traffic data to DMAS for mining more information and patterns from network traffic data.. This chapter describes how GMI assists administrators in monitoring network abnormal status. According to the data that GMI displayed, data cube and DMAS are connected to go deep into network abnormal status. With data mining techniques, we can get more analysis results about network intrusions.. 6.1. Guided Monitoring Interface Basic analytical operations can be handled by Structured Query Language. (SQL) and relational databases, but SQL is very cumbersome and lacks important semantics for dimensional analysis. OLAP databases, however, have been designed for analytical use. For example, Multidimensional Expressions (MDX) on Microsoft Analysis Service is a language that helps unlock the capabilities of Microsoft OLAP databases. With assistance of GMI, administrators can specify the information of dimension and concept level without the monotonous process of learning data cube language.. Cube Query Meta-data Construction (CQMC) Algorithm is proposed to guide administrators to construct the meta-data of query step by step, which indicates the dimensions and granularity of the desired data. After query 31.
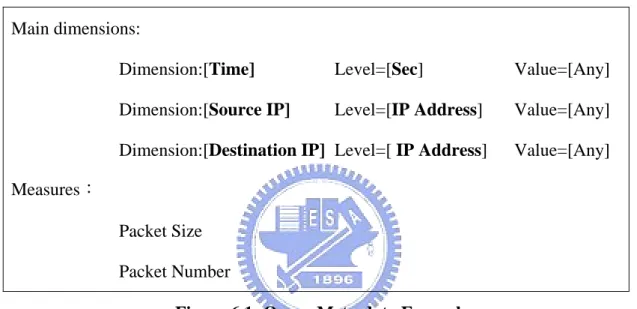
(41) meta-data is built, GMI transforms meta-data into MDX query language. Administrators can get the queried result through GMI all the time.. Administrators are first guided to specify the main dimensions of the desired data. The main dimensions that administrators selected decide how the connection feature vectors are aggregated. Second, the concept level of the main dimension is specified to decide what level the connection feature is generalized to. Third, administrators specify measure that decides which feature to be aggregated. For example, if the data of outgoing traffic from each host is interesting for administrators then Source IP is the main dimension, IP address is the concept of Source IP dimension and packet size is a measure. Packet size features in connection feature vectors are aggregated with the same Source IP address.. Algorithm 4: Cube Query Meta-data Construction (CQMC) Algorithm Step 1: Choose one main dimension according to the requirement of administrators. Step 2: Select the concept level of the dimension chosen in Step 1. Step 3: Set the value of the dimension. Step 3.1: If a specific value in concept level selected in Step 2 of the dimension chosen in Step1 is desired. Set the value as a specific value. Step 3.2: If all possible values are desired, set the value to “ANY”. Step 4: If there are still desired dimensions not been processed then go to Step 1; else go to Step 5. Step 5: Select Measures.. 32.
(42) According to different monitoring requirement, administrators are guided by CQMCA algorithm step by step to construct cube query meta-data and query result are shown on GMI later. With the help of GMI, administrators can analyze the cube systematically and efficiently.. There is an example query meta-data of status of connections between every ip address during every second, as shown in Figure 6.1. Main dimensions: Dimension:[Time]. Level=[Sec]. Value=[Any]. Dimension:[Source IP]. Level=[IP Address]. Value=[Any]. Dimension:[Destination IP] Level=[ IP Address]. Value=[Any]. Measures: Packet Size Packet Number Figure 6.1: Query Meta-data Example. Administrators can evaluate network status by specifying meta-data of the interesting network data. There are two fundamental query types in network traffic data listed below:. Type 1: Query network traffic data in different dimensions while time dimension is set as a specific concept level.. Example 6.1: Querying outgoing packet numbers of each IP during every minute. 33.
(43) Main dimension: Time. Level=[Min]. Value=[Any]. Source IP. Level=[IP Address]. Value=[Any]. Measure: Packet Size. In recent years, many viruses would cause the vast amount of outgoing packets from an affected host. Outgoing traffic of each host in every minute can be used to help administrators evaluate behavior of each host. On the same principle, we can monitor the size of packets going to each host or each service on every host and so on.. Type 2: Query network traffic data in different dimensions and evaluate behaviors between specific members.. Example 6.2: Querying the packet number of ICMP_ECHO_REQUEST packets and ICMP_ECHO_REPLY packets of each host.. Main dimension: Time. Level=[Min]. Value=[Any]. Port. Level=[Port]. Value=[ECHO_REQUEST]. Source IP. Level=[IP Address]. Value=[Any]. Destination IP. Level=[IP Address] Value=[Any]. Measure: Packet Number. 34.
(44) Main dimension: Time. Level=[Min]. Value=[Any]. Port. Level=[Port]. Value=[ECHO_REPLY]. Source IP. Level=[IP Address]. Value=[Any]. Destination IP. Level=[IP Address]. Value=[Any]. Measure: Packet Number. A famous DDoS tool, TFN2K[3], uses ICMP_ECHO_REPLY packets to communicate with agents that had been hacked and installed DDoS program for denial of service intrusion. In normal situation, one ICMP_ECHO_REQUEST packet. causes. one. ICMP_ECHO_REPLAY. packet. or. no. ICMP_ECHO_REPLAY packet so that the number of ICMP_ECHO_REQUEST packets should be more than the number of ICMP_ECHO_REPLY packets. In a hacked host with the TFN2K agent program, the ICMP_ECHO_REPLY packets would exceed the ICMP_ECHO_REQUEST packets in packet number. TFN2K agents could be monitored by administrators using queries as shown in Example 6.2.. The principles of these two types can help administrators evaluate the behaviors of various network intrusions to monitor the network intrusions. More query types can be specified according to the various considerations of administrators for evaluating their interesting intrusions.. 35.
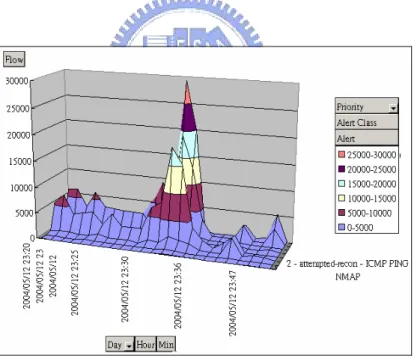
(45) After extracting the concept level and dimension information of desired data, the GUI would display the interesting data of administrators for network monitoring. An example of the Alert Name distributions in the Minute concept level of Time dimension is shown in Figure 6.2. In this figure, the “SCAN UPnP service discover attempt” alert and the “MISC UPnP malformed advertisement” alert form the two peaks whose total flow reaches 30MB and 18MB in a minute. UPnP, the new Universal Plug and Play[13] feature that try to discover new hardware on the LAN can be used by intruders to setup a DrDoS[8] attacking network. Such huge traffic of unusual UPnP packets in one minute would remind administrators of noticing UPnP service in every monitored host for prevention of being a part of DrDoS attacking network.. Figure 6.2: The Example of Alert Name Distributions in the Minute Concept Level of Time Dimension. When administrators are aware of the abnormal network situation, it is vary easy for administrators to change the concept levels of each dimension by choosing different concept level through GMI which could immediately update 36.
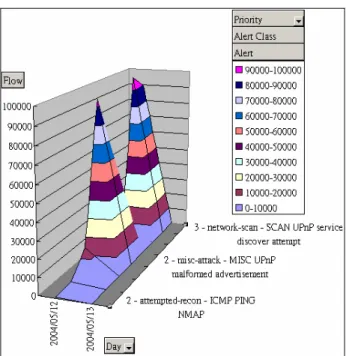
(46) the network data of their interesting granularity. There are another two examples of choosing different concept levels of the Time dimension and the Alert dimension as shown in Figure 6.3 and Figure 6.4. In these two examples, we can monitor the abnormal network status at different concept level to obtain more useful information.. Figure 6.3: The Example of Alert Name Distributions in the Day Concept Level of Time Dimension. Figure 6.4: The Example of Alert Priority Distributions in the Day Concept Level of Time Dimension 37.
(47) 6.2. DMAS DMAS, a well-developed data mining tool, applies data mining techniques. to offer administrators more information about the network abnormal status. Administrators get cube query result through GMI and analyze the network status. Because of the desire of further analysis of network abnormal status, DMAS is adopted to apply data mining techniques. Data stored in data cube are multi-dimensional and conceptual. There is a large difference between Cube Data and the input file format of DMAS. Transformation Component (CDTC) is proposed to be the bridge of data cube and DMAS. CDTC exports data from network traffic data cube to DMAS according to the meta-data constructed by administrators. Although many OLAP products develop OLAM bounded and data transformation is resolved, the diversity of analysis approaches will be restricted by the implementation of data mining algorithms.. 6.2.1 Clustering Network traffic can be clustered by several measures. Connections clustered into the same cluster have similar features. That means these connections may be caused by similar behaviors. Administrators can use cluster algorithms to analyze connections that is similar to abnormal connections for discovering network intrusion patterns.. Before cluster algorithms are applied, data have to be preprocessed. We have to consider two things about the meanings that measures represent. First, because measures in network traffic data represent different meanings, each measure has its own value range. For example, packet number ranges up to thousands times than connection numbers in one second. The feature 38.
(48) distributed over very large number would dominate the cluster result if cluster algorithm is applied on origin data. Second, some measures are more meaningful for clustering in network traffic analysis. So these measures should dominate the cluster result a little bit.. Normalization: Measures are recalculated so as to fall within a small specified range, such as 0.0 to 1.0. we use min-max normalization to normalize measures.. ν '=. ν − min. A. max A − min. A. Meaning Weight: Each measure has its own weight factor to adjust the importance in cluster result.. Weight ×ν '. 6.2.2 Association analysis Association analysis is the discovery of association rules showing attribute-value conditions that occur frequently together in a given set of data. Using association analysis we can analyze what kind of attribute-value conditions occurring frequently while network status was abnormal. Numeric measures in network traffic data have to be preprocessed before association analysis is applied.. Discretization techniques can be used to reduce the number of values. 39.
(49) for a given continuous attribute, by dividing the range of the attribute into intervals. Interval labels can then be used to replace actual data values. Many discretization techniques can be applied recursively in order to provide a hierarchical partitioning of the attribute values. Equiwidth and Equidepth are two well-known partition rules.. Two Data mining techniques mentioned above are the just two most well-known techniques. There are still many techniques that can be applied into network traffic analysis to help administrators analyze the interesting network traffic data and discover intrusion patterns. More discussions about this topic is left to the future work.. 40.
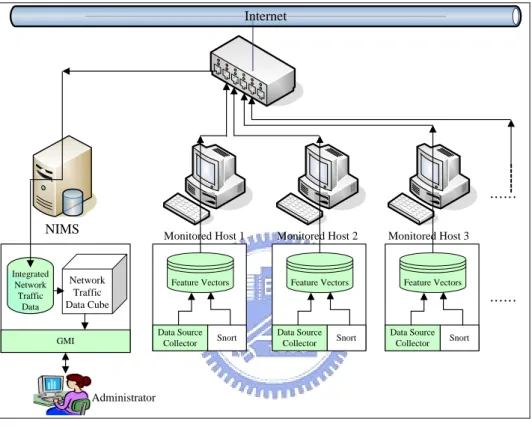
(50) Chapter 7:. Experiments. In this thesis, the Network Intrusion Monitoring System Architecture as shown in Figure 3.1 is proposed to integrate multiple data sources and construct concept hierarchies for monitoring and analysis. OLAP is used because of offering roll-up, drill-down, etc. operations to analyze network traffic data cross every concept level. OLAP is designed to analyze long-term data and the analysis result is used to assist in decision making. In network intrusion monitoring, network traffic data are collected continuously so that the network traffic data stored in data warehouse will become vary huge. Network traffic data has the characteristic of high dimensionality and the number of measures is in proportion to aggregating time of data cube. If the time of transforming network data into a data cube lasts for days, it is too late to monitor the network status for proper reaction to intrusions.. As mentioned above, the amount of feature vectors to be aggregated and number of measures in the feature vector would affect the processing time of data cube. As shown in Experiments 7.1 and 7.2, the processing time of data cube was acceptable. Although network traffic data cannot be analyzed in real time, it can be analyzed in nearly real time.. 7.1. Experiments Network Environment The network traffic data in our experiments is collected through the NIMS. prototype built as shown in Figure 7.1. Snort and Data Source Collector in monitored host are installed to collect network traffic data and Snort alert log and then these data are merged into feature vectors according to the network traffic feature vector format that we generated as shown in Figure 5.1. Feature Vectors. 41.
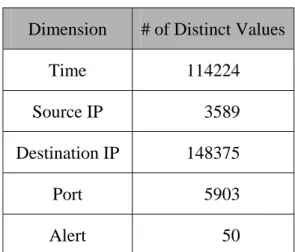
(51) in 10 monitored hosts are transferred to the NIMS server and maintained in data warehouse. Network traffic data cube is constructed according to the concept hierarchies as shown in Figure 7.2. The numbers of distinct values in the fact table of each dimension deciding the size of each dimension table are shown in Figure 7.3. Internet. …… NIMS Integrated Network Traffic Data. Monitored Host 1. Network Traffic Data Cube. Monitored Host 2. Feature Vectors. Monitored Host 3. Feature Vectors. Feature Vectors. …… Data Source Collector. GMI. Snort. Data Source Collector. Snort. Data Source Collector. Snort. Administrator. Figure 7.1: NIMS prototype in experiments. Time Dimension. Source IP Dimension. Destination IP Dimension. Day. ClassA. ClassA. Port Dimension. Alert Dimension. Hour. ClassB. ClassB. Protocol. Priority. Minute. ClassC. ClassC. Service. AlertClass. Second. IP Address. IP Address. Port. Alert. Figure 7.2: Concept levels of each dimension of network traffic data in Experiment 7.1 and Experiment 7.2. 42.
(52) Dimension. # of Distinct Values. Time. 114224. Source IP. 3589. Destination IP. 148375. Port. 5903. Alert. 50. Figure 7.3: The size of dimension table of each dimension of network traffic data in Experiment 7.1 and Experiment 7.2. 7.2. Data Cube Performance In order to evaluate the performance of processing large amount of data of. data cube, network traffic data which are collected in 20 hours and reach 1,600,000 feature vectors are used as the experimental data.. Experiment 7.1: The data cube processing time with different numbers of feature vectors.. Different data cube processing times vs. different numbers of Feature Vectors in Experiment 7.1 are shown in Figure 7.3. The processing time of total 1,600,000 feature vectors is about 100 seconds, and it means the network traffic data collected in 20 hours can be transformed into a data cube in less than 2 minute. As the growth of the number of feature vectors, the processing time increases. 43.
(53) slowly. The time of processing 1,600,000 feature vectors is 2.5 times than that of processing 200,000 feature vectors.. Second 120 100 80 60. 數列1. 40 20. 14 00 00 0. 10 00 00 0. 60 00 00. 20 00 00. 0 Feature Vectors. Figure 7.4: Result of Experiment 7.1. Experiment 7.2: The processing time of data cube with different numbers of measure.. Different data cube processing times vs. different number of measures in Experiment 7.3 are shown in Figure 7.4. The number of measures increases from 3 to 21 and the processing time needed grows linearly. The time of processing 1,600,000 feature vectors with 21 measures is 70 seconds more than the time of processing 1,600,000 feature vectors with 3 measures. The time difference of adding 3 measures is 10 seconds in average.. 44.
(54) Seconds 180 160 140 120 100. 數列1. 80 60 40 20 0 3. 6. 9. 12. 15. 18. 21. measures. Figure 7.5: Result of Experiment 7.2. The data cube processing time is proportion to the number of feature vectors and the number of measures. The experimental network traffic data were collected for 20 hours and contained 1,600,000 feature vectors. All feature vectors can be processed in a few minutes and the processing time grows almost linearly to the increasing of the number of feature vectors and measures.. 45.
(55) Chapter 8:. Conclusion. In this thesis, a Network Intrusion Monitoring System (NIMS) Architecture was proposed to integrate multiple data sources such as data set from KDD cup 99, Snort alert log, etc. and construct concept hierarchies of each dimension for monitoring and analysis. Integrated network traffic data can be analyzed on different concept levels of multiple dimensions in data cube. Moreover, intrusion patterns can be discovered in the desired granularity of each dimension by using Data mining tools such as DMAS.. The proposed Network Intrusion Monitoring System Architecture consists of three phases: Data Preprocessing Phase, Concept Hierarchy and Data Cube Construction Phase and Data Analysis Phase. In Data Preprocessing Phase, the Multi-Source Data Format Integration (MSDFI) Algorithm was proposed to integrate multiple data source formats into an integrated network traffic data format. Data Source Transformation (DST) Algorithm was proposed to merge multiple network traffic data sources according to the integrated data format generated by MSDFI algorithm. In Concept Hierarchy and Data Cube Construction Phase, the Dimension Concept Hierarchy Knowledge Acquisition (DCHKA) algorithm was proposed to guide experts to construct concept hierarchies of each dimension of network traffic data .With the concept hierarchies of network traffic data, network traffic data can be easily transformed into a data cube for analyzing cross every concept level of each dimension. In Data Analysis Phase, the Guided Monitoring Interface (GMI) was proposed to assist administrators in analyzing network traffic efficiently. At last the network traffic data at desired concept level of each dimension can be exported to DMAS for mining more information and intrusion patterns. 46.
(56) The processing time of data cube is in proportion to the number of feature vectors and measures. Two experiments were made to show that the processing of transforming network traffic data into a data cube is nearly in real time. Time of the processing needed increases almost linearly as the growth of the number of feature vectors and measures.. There are two issues that we didn’t discussed in this thesis will restrict the ability of our NIMS Architecture. Feature Selection, the features chosen for analysis from integrated data sources would affect the result of the analysis. Time slicing is also important for network intrusion analysis. The time slicing mechanism in time dimension would affect the way which connection vectors are aggregated in time dimension. These two issues are left to future work for advanced discussion.. 47.
(57) References [1] Cabreraa, J. B. D. et al. (2001) “Proactive detection of distributed denial of service attacks using MIB traffic variables - A feasibility study.” Proc. of Integrated Network Management, 2001 IEEE/IFIP International Symposium, 2001. [2] Chang, K. C. (2002) “Defending against flooding-based distributed denial of service attacks: A tutorial.” IEEE Communications Magazine, Vol. 40, Iss. 10, Oct 2002.. [3] Dittrich, D. (1999) “The DoS Project's Tribe Flood Network distributed denial of service attack tool.” http://staff.washington.edu/dittrich/misc/tfn.analysis.txt.. [4] Dittrich, D. (2000) “DDoS: Is there really a threat?” Proc. of USENIX Security Symposium, Aug. 16, 2000.. [5] Dodge, R.C., Jr. Wilson. (2003) "Network Traffic Analysis from the Cyber Defense Exercise" IEEE International Conference on , Volume: 5 , 5-8 Oct. 2003.. [6] Eddie, K. Robert, M. (2000) "The Click modular router." ACM Transactions on Computer Systems, Vol. 18, no. 3, pp. 263-197, Aug. 2000.. [7] Erhard, W., Gutzmann, M.M. et al. (2000) "Network Traffic Analysis and Security Monitoring UniMon" High Performance Switching and Routing, 2000. ATM 2000. Proceedings of the IEEE Conference on , 26-29 June 2000 Pages:439 – 446.. [8] Gibson, S. (2002) “The Distributed Reflection DoS Attack.” http://www.grc.com/dos/drdos.htm. [9] Jianjun C. et al. (2000) “NiagaraCQ: A scalable continuous query system for internet databases.” In Proceddings of ACM SIGMOD 2000, 2000, pp. 379-390. [10] Leong Y. S. C. “Log (2003) “Analysis as an OLAP Application – A Cube to Rule Them All”, Practical assignment for GIAC GSEC certification, June 2003.. 48.
(58) [11] Lin, Y. T. et al. (2003) “Design and implement of new object-oriented rule base management system.” Experts Systems with Applications 25, pp. 369-385, 2003.. [12] Maheshkumar S., Gursel S.(2003), "Application of Machine Learning Algorithms to KDD Intrusion Detection Dataset within Misuse Detection", Proceedings of the International Conference on Machine Learning; Models, Technologies and Applications. MLMTA'03, June 23 - 26, 2003. [13]. Microsoft. Corporation.. (2001). "Microsoft. Security. Bulletin. MS01-059.". http://www.microsoft.com/technet/security/bulletin/MS01-059.mspx. [14] Mike, F., George, V. (2002). "Agile and Scalable Analysis of Network Events." Proceedings of the second ACM SIGCOMM Workshop on Internet measurment, November 2002.. [15] Park, K. Lee, H. (2001). “On the effectiveness of route-based packet filtering for distributed DOS attack prevention in power-law Internets.” Proc. of ACM Sigcomm 2001, Aug. 2001.. [16] Robert G. M., Jahanian F. (1998) “An extensible probe architecture for network protocol performance measurement” in Proceedings of ACM SIGCOMM’98, Sept. 1998, pp.215-227.. [17] Samuel M. et al. “Continuously adaptive continuous queries over streams.” In Proceedings of ACM SIGMOD 2002, 2002.. [18] CERT Coordination Center. (2003) “DDoS attacks.” http://www.cert.org, 2002.. [19] Vern, P. (1999) "Bro: A system for detecting network intrusders in real-time." Computer Networks, Vol. 31, no. 23-24, pp. 2435-2463, Dec. 1999.. [20] Xu, J., Lee, W. (2003). “Sustaining availability of web services under distributed denial of service attacks.” IEEE Trans. on Computers, Vol. 52, Iss. 2, Feb. 2003.. [21] Y. S. Chu, S. S. Tseng, W. C. Chen (2002), “An Intelligent Knowledge Discovery System,” The 6th World Multiconference on Systemics, Cybernetics and Informatics, Orlando, Florida, July, 2002.. 49.
(59)
數據
+7
相關文件
As is known, practices of Medicine Buddha correspond to the concept of development of the pure land in the human world; since Master Taixu, Master Hong Yi and Master Yin Shun in
– Assume that there is no concept with significan t correlation to Mountain..
The academic achievement of math of high-grade elementary school students is significant related to their SES and the self-concept in math, but is non-related to their
This study proposed the Minimum Risk Neural Network (MRNN), which is based on back-propagation network (BPN) and combined with the concept of maximization of classification margin
To solve this problem, this study proposed a novel neural network model, Ecological Succession Neural Network (ESNN), which is inspired by the concept of ecological succession
According to this viewpoints, the concept of marketing is not confined to external marketing & sale for external customers only, it adds the concept of ”making employee
Lastly, using Voting Analytic Hierarchy Process (VAHP) model to estimate manufacturers and consumers’ green camping product design, and furthermore construct service
By using Balanced Scorecard (BSC), the purpose of this study is to construct indicators of school management with Analytic Hierarchy Process (AHP) for L junior high school in
