行政院國家科學委員會專題研究計畫 期中進度報告
精神分裂症致病基因之定位研究(2/3)
計畫類別: 個別型計畫 計畫編號: NSC92-3112-B-002-019- 執行期間: 92 年 05 月 01 日至 93 年 04 月 30 日 執行單位: 國立臺灣大學醫學院精神科 計畫主持人: 胡海國 計畫參與人員: 劉智民 報告類型: 完整報告 報告附件: 出席國際會議研究心得報告及發表論文 處理方式: 本計畫可公開查詢中 華 民 國 93 年 4 月 29 日
1
基因體醫學國家型科技計畫
National Research Program for Genomic Medicine
National Science Council, the Executive Yuan, ROC.
計畫名稱-精神分裂症致病基因之定位研究
A Positional Cloning Study of Schizophrenia
報告類別:□ 新進研究計畫 □ 修正後計畫書
年度成果報告
(New Proposal)
(Revised Proposal)
(Progress Report)
計畫類別: 個別型計畫 □ 整合型計畫
(Individual
Project)
(Program
Project)
計畫編號:
91-GMP029-1
計畫主持人 (Principle Investigator):胡海國 Hai-Gwo Hwu
共同主持人 (Co-Principle Investigator):劉智民 Chih-Min Liu
執行單位 (Institution):國立台灣大學醫學院精神科
Department of Psychiatry, Medical College, National
Taiwan University
2
National Research Program for Genomic Medicine
National Science Council, the Executive Yuan, ROC.
Progress Report—Research Project
基因體醫學國家型科技計畫
國科會延續性計畫進度報告
個別型計畫 (Individual Project)
Program Classification:
Genomic Medicine
Bioinformatics
Proteomics & Structural Genomics
ELSI
Project Number
:91-GMP029-1
NSC Funding Number: NSC 92-3112-B-002-019
(93年度國科會預核編號) (in Chinese) 中文精神分裂症致病基因之定位研究
Title of Project 計畫名稱 (in English) 英文A Positional Cloning Study of Schizophrenia
(in Chinese) 中文國立台灣大學醫學院精神科
Institution
研究(執行)單位
(in English) 英文
Department of Psychiatry, Medical College, National
Taiwan University
(in Chinese) 中文胡海國
Principle Investigator 計畫主持人 (in English) 英文Hai Gwo Hwu
FY 2002
2003
2004 Total
Budget
4,778,900
(NGC:2000,000)4,791,800
(NGC:7,109,760) 4,835,400 (NGC:9,878,400)(in NT dollars: 1USD = 34 NTD)
Signature of the PI:_______________Date:_________________
3
TABLE OF CONTENTS
POCOS Annual Report(May 2003-April 2004)... 4
1. Response to previous reviewers’ critiques... 4
2. Specific
Aims ... 7
3. Progress Results Summary ... 8
4. Projected Timeline & Brief Summary of Plans for Next Year... 40
5. Personnel ... 41
6. Publications and/or Patents ... 42
6a. Publications ... 42
6b. Patents ... 42
Appendix... 43
Appendix 1: Neuregulin 1 as a candidate Gene Influencing Schizotypal
Personality Features or Sustained Attention in Adolescents…………...44
Appendix 2: A A SNP Fine Mapping Study on Chromosome 1q42.1 Reveals
Vulnerability Genes of GNPAT and DISC1 in Schizophrenia: Association with
Impairment of Sustained Attention...54
4
Progress Report
1. Response to previous reviewers’ critiques
The reviewers’ comments (A):
This project is of fine mapping study, and only uses a candidate region as narrow as 2cM for SNP genotyping study. The reviewers suggest that traditional linkage approach is unlikely and suggest to use linkage disequilibrium approach using trios.
Answer:
We share the same concerns as the reviewer’s over the resolution of conventional linkage analysis; therefore the transmission disequilibrium tests (TDT) were conducted in addition to traditional linkage analyses. To extract as much information as possible from the data that have
been collected, we performed TDT that uses pedigree data such as PDT, TDT/S-TDT and TRANSMIT program. Quantitative trait outcomes were also considered by using QTDT program.
Multipoint transmission tests were also carried out using the TRANSMIT program. In addition, haplotype analysis using pedigree data were carried out using the FBAT program. The reviewers’ comments (B):
The reviewers also stated that a carefully through out analytical plan is needed to laid out as to why around 100 SNPs is required can be extracted. Specifically, it would seem wise to carry out this fine mapping approach in two stages.
Answer:
As a matter of fact, the two-stage strategy has been adopted in this project. For the first screening step, we selected 31 trios at random plus 2 normal controls; these DNA samples were placed into a 96-well plate for SNP genotyping. Allele frequencies, Hardy Weinburg equilibrium (HWE), Mendelian inheritance (MI), inter-marker LD coefficients, missing rate etc, were estimated. Markers that failed HWE and MI, data were rechecked for quality control concern. SNP markers were considered in the second stage genotyping for all samples if the three conditions were met; 1) no violation of MI, 2) missing rate less than 30%, 3) minor allele frequency larger than 10%. For example, 120 SNPs located at 1q42.1 were identified using bioinformatic tools, after our first stage screening; only 45 were retained for the second stage typing. Although, TDT and haplotype analysis (haplotype were grouped by LD information) were conducted based on the 45 SNPs as preliminary results, the information were not used as one of our criterion to enter second stage typing due to small sample size.
The two-stage strategy will be used through out the rest of the project.
Ideally, in a cluster of SNPs with strong LD, only a few needs to be selected (preferably CSNP) for the second stage genotyping, in the example of 1q42.1, this information was not used due to low retention rate (45/120 = 37.5%). LD information will be used as one of the criterion if more SNPs are available in other regions.
The reviewers’ comments (C):
My recommendation is that the investigators are asked to prepare for a sensible analytical plan….
Answer:
5
1) Although the project is for fine mapping, the range of the candidate region may span more than a few centi-Morgans, probability of IBD sharing from multiple STRP markers using affected sibpair will be first checked to confirm the likelihood of the region.
2) If the region does show a positive signal of linkage from the results of probability of IBD sharing using STRP markers, two- stage SNP genotyping will be launched. The first stage is for the screening using subset of samples. SNP markers that met certain criterion will be genotyped in the second stage using all samples.
3) The analyses for the SNP markers consist of two parts.
(1) For single SNP: the following programs will be carried out: Transmission Disequilibrium Test and Sib Transmission Disequilibrium Test, Pedigree Transmission Test, Quantitative Transmission Test, TRANSMIT program, Family Based Association Test, etc.
(2) For multipoint SNP: inter-marker LD coefficient will first be determined (for example using the GOLD program), the TRANSMIT program will be performed for haplotype analysis. Haplotype Family Based Association Test (HaploFBAT) will also be carries out. In additional, haplotypes will be estimated by using the SIMWALK2 program then the information will be used in the analysis of haplotype transmission test.
4) As for the available quantitative outcomes, heritability for each of them will be calculated to decide the possible genetic component. QTDT will be performed for those with higher value of heritability.
5) The interpretation of positive association will depend on a few factors: (1) p-values after multiple comparison adjustment
(2) Available sample size under the assumption for each of the test (3) Consistent trend across different tests.
The above analytical plan will be revised according to the development of new methodology. Reference:
PDT program
― Martin, Monks, Warren, Kaplan, Am J Hum Genet, 67:146-154 (2000). TDT/S-TDT program
― Spielman, et al. Am J Hum Genet, 52:506-516 (1993). ― Spielman, Ewens, Am J Hum Genet, 62:450-458 (1998). TRANSMIT program
― David Clayton, Am. J. Hum. Genetics, 65:1170-7 (1999). QTDT program
― Abecasis, Cardon and Cookson, Am J Hum Genet, 66:279-292 (2000). FBAT program
― Laird, Horvath, Xu, Genetic Epi, supp 1, 19:36-42 (2000). ― Rabinowitz, Laird , Hum. Heredity, 50:211-223 (2000). ― Horvath, Xu, Laird ,European J Hum Genet. 9:301-306 (2001). HaploFBAT program
― Laird NM ,Genet Epidemiol, 26(1):61-69 (2004). GOLD program
― Abecasis, Cookson , Bioinformatics, 16(2):182-183 (2000). SIMWALK2 program
― Weeks, Sobel, O'Connell, Lange, Am J. Hum Genet, 56, 1506-1507 (1995).
6
The IMA Volumes in Mathematics and its Applications, eds TP Speed, MS Waterman (Springer-Verlag, 1996), pages 49-63.
― Sobel, Lange, Am. J. Hum. Genet. 58, 1323-1337 (1996). The reviewers’ comments (D):
In addition, the investigators should provide a rationale to prioritize the four remaining candidate regions for genotyping…
Answer:
We, the investigators, reconsider the genotyping plan. We finally had the following conclusions:
a. To do a STRP genotyping with 6 marker around each of the initial dinucleotide repeat markers of D6S296 (6p22), D8S1222(8p14), D15S976 (15q14), and D22S278 (22q12), which was found to have suggestive evidence of linkage with schizophrenia in our previous study. This work intended to replicate the original finding, and to reduce the number of candidate regions, and to narrow down the chromosome region for further SNP genotyping.
b. To do a set of SNP genotyping study on possible candidate genes, which have expression in CNS and have possible pathophysiological significance related to schizophrenia theoretically, reported in literature located in these 4 other candidate chromosome regions. This work intends to catch up the frontier work of world schizophrenia genetic studies. Those candidate genes reported in literature near those candidate regions found by our previous study might be meaningful to us POCOS project.
c. To do serial SNP genotyping studies on the other four candidate regions with the sequence of (1) D22S278 (22q12), (2) D6S296 (6p22), (3) D15S976(15q14), (4)D8S1222(8p14).
The rationale for this sequence is that: The reason for choosing D22S278 (22q12) as the first candidate region to do fine mapping is that there are many functional genes in this region. There is no report of candidate genes, except in the region of 22q11, in this region. It is worthwhile to do it as quick as possible. The D6S296 (6p22) was as the second candidate region to do fine mapping. The reason is similar to the first one. Actually, there is rare report of candidate genes in this region yet, other than TNFA, NOTCH4 and MRDS1 (6p24.3).
The 3rd and the 4th candidate regions are D15S976 (15q14) and D8S1222 (8p14). The reason is that there already some promising candidate genes found in these two regions.
However, we intend to speed up all fine genotyping studies in all these 4 candidate regions as soon as possible in this 3-year study period. After all, all research centers were not definitely sure that the candidate genes are really true vulnerability genes. It deserves us to find the candidate genes by ourselves for further neurobiological studies. This is the only was to be in the frontier line to do schizophrenia molecular genetic study.
7
2. Specific Aims
This positional cloning study of schizophrenia (POCOS) has three specific aims: (1) To locate and identify the vulnerability genes of the phenomenological phenotype as well as the endophenotypes of schizophrenia (SCH) at specific chromosome regions; (2) To find specific polymorphism of candidate genes associated with endophenotypes and/or phenomenological phenotypes of schizophrenia; (3) To collect more data of continuous performance test (CPT) and Wisconsin Card Sorting Test (WCST) in the families with DNA samples.
8
3. Progress Results Summary
We focused the following seven works in this period (4/1/2003~4/30/2004):
1. Collecting more data of Continuous Performance Test (CPT) and Wisconsin Card Sorting Test (WCST) of the TSLS family with DNA sample for endophenotype definition.
2. Preparation of the DNA samples of Taiwan Schizophrenia Linkage Study (TSLS), totally 586 coaffected sibpair families, 2389 DNA samples.
3. Completion of the fine mapping study, including analysis, of chromosome 1q42.1 in 102 coaffected sibpair families of schizophrenia.
4. Replication of the SNPs of significant results in the fine mapping studies of chromosome 1q42.1 in the randomly selected 203 families of TSLS samples.
5. Replication of linkage evidences of five chromosome regions (1q42.1, 6p24-22, 8p21, 15q13-14, 22q12) with 30 simple tandem repeat polymorphisms (STRPs) markers in all the family samples to guide further fine-mapping studies.
6. Searching for polymorphism in the POCOS located vulnerability gene for neurobiological and/or clinical studies.
7. Phenotype refinement according to the clinical phenotype and neuropsychological endophenotypes of CPT and WCST for further genetic association study.
8. We prepare to genotype the polymorphisms (SNPs) in 10 positional candidate genes, including RGS4 on chromosome 1q21, MRDS1 on chromosome 6p24, DTNBP1 on 6p22, TNF-alpha and NOTCH4 on 6p21, PPP3CC and NRG1 on 8p12-21, G72 on 13q and DAAO interacting with G72, and CHRNA7 on 15q14.
9. We have also selected 99 SNPs markers for SNP fine mapping on the candidate region of 22q12, around the STRP marker D22S278. Three step methods will be adopted too in this genotyping work. We hypothesize that we may obtain one or two significant candidate genes in this specific candidate region of 22q12. Currently, the first stage work of SNP validation has been completed.
10. We prepare to genotype 3 SNPs in NRG1 gene in 905 adolescent assessed by schizotypal personality questionnaire (SPQ) and CPT to test the hypothesis NRG1 is a candidate gene for schizotypal personality features. The genotyping work has been completed and the preliminary result will be presented as the following section.
Collection of CPT and WCST data
The work of collecting more data of CPT and WCST of study families with DNA sample has been preceded smoothly.
Up to now, we have collected 573 and 570 families with CPT and WCST data, respectively of 600 TSLS families with DNA samples.
We also collected blood samples for genetic study: (1) collecting fresh blood of 20subjects for FISH study on the validity study of a novel positive probe for identifying possible balanced translocation of t(1:11) (q42.1;q14.3) (attached manuscript submitted); (2) collecting serum of the 11 sample patients with C/C and C/T genotypes of the novel SNP polymorphism of DISC1gene.
9
This is a laborious work for genotyping study in this year. Up to the present time, The DNA sample have been well prepared.
Fine mapping using SNP genotyping on the 1q42.1 candidate region near marker D1S251 using 102 NTUH samples (3rd work)
Please see the attached manuscript, ‘A SNP Fine Mapping Study on Chromosome 1q42.1 Reveals Vulnerability Genes of GNPAT and DISC1 in Schizophrenia: Association with Impairment of Sustained Attention’
Replication study of haplotype association analysis between GNPAT gene and schizophrenia (Work No. 4)
We randomly selected 203 sibpair families from our TSLS sample (total available family
number is 388 families) in order to replicate the previous of significant association between GNPAT gene polymorphisms and schizophrenia in our MPSS family sample (3rd work). Five SNPs (SNP 482, 485, 479, 488, 489) from the 3rd work with the total distance of 32 kbp were selected for the replication study.
We found the five SNPs were in a high LD block using GOLD program (please see Fig 1). Single point association analysis didn’t reveal significant association with any of the five SNPs using either Transmit v2.5.4 or FBAT v1.4.1 (see Table 1). Haplotype association analysis revealed not significant association with the risk haplotype (2.2.2.2.2) reported in the 3rd work (Table 2). We failed to replicate the significant association between schizophrenia and GNPAT gene in a larger family sample. However, the risk haplotype was reported to be associated with the sustained attention deficit assessed by CPT in the previous study. We prepare to do further analysis to stratify the larger sample according to the CPT data to see if the risk haplotype of GNPAT gene is associated with specific subtype of schizophrenia assessed by CPT.
Replication of linkage evidences of five chromosome regions [1q42.1(DIS251), 22q12(D22S278), 6p22(D6S296), 15q14(D15S976), 8p14(D8S1222)](work No.5).
Partly following the suggestion of the reviewers’ comment, we (investigators) intended to replicate our previous linkage results of these 5 candidate chromosome regions using STRP genotyping.
We designed 6 STRP markers with high polymorphism (50%-90% ) in each chromosome candidate region. A total of 30 STRP markers were chosen for study. The markers for 1q41-42 were DIS2847, DIS2833, DIS1656, DIS251, D1S2709, D1S459; for 6p24-22 were D6S1640, D6S277, D6S296, D6S940, D6S470, D6S1034; for 8p21 were D8S1223, D8S339, D8S1222, D8S1810, D8S1477, and D8S283; for 15q13-14 were D15S1019, D15S1048, D15S165, D15S976, D15S1031; and for 22q12-13 were D22S1162, D22S691, D22S424, D22S278, D22S683, and D22S1177. In average, the marker-marker distance of each region was about 1 cM. Of the 30 STRP selected, 7 markers failed to be genotyped using high throughput method. Therefore, 23 STRP markers were included into the linkage analysis. (Table 3).
After validation analysis and checking up for Mendelian compatibility, we have available STRP genotyping data on 480 families, including 92 families of MPSS sample and 388 families of TSLS sample.
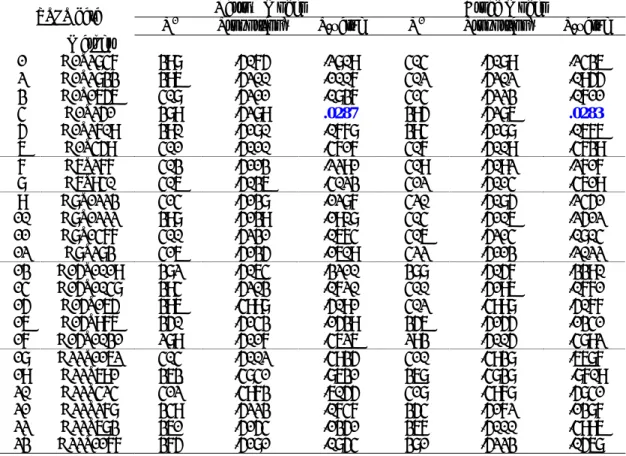
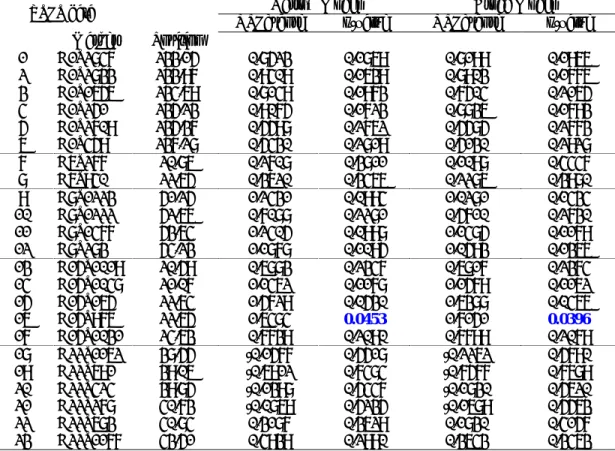
Single point analysis using SAGE 3.1 SIBPAL revealed significant linkage evidence with D8S283 (p=0.026) in narrow model, with D22S1162 (p=0.0378) in broad model, and with
10
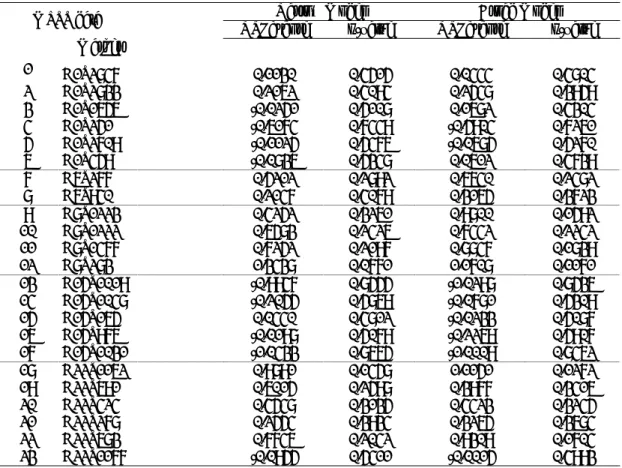
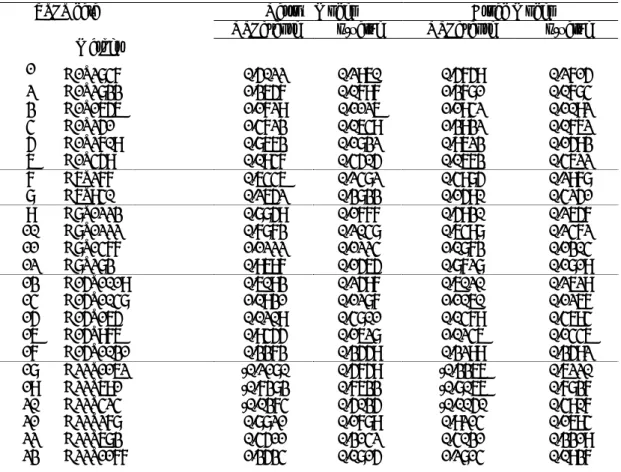
D22S1177 (p=0.0304 in narrow model; p=0.0122 in broad model) in our MPSS families. In TSLS families, significant linkage evidence with D1S251 (p=0.0287 in narrow model; p=0.0283 in broad model) were observed. Borderline significant linkage was observed in D8S1447 (p=0.06) and D22S1177 (p=0.056) in the TSLS sample. (Table 4). Single point analysis using GeneHunter 2.1 didn’t reveal any significant result with these markers either in MPSS or TSLS sample. (Table 5). Multipoint analysis didn’t reveal significant result in MPSS family, but reveal significant linkage with D15S976 (p=0.04 in narrow model, p=0.03 in broad model) in TSLS sample. (Table 6). The fine-mapping study revealed suggestive linkage evidence to marker D15S976 on
chromosome 15q14 from the multipoint analysis in our TSLS family sample. In current stage, we failed to show linkage evidence to other 4 linked regions (1q42, 6p24, 8p21, 22q12), previously reported in Taiwanese families, in the large family sample. However, the linkage evidence to chromosome 15q14 may guide further fine-mapping work.
Since the phenotype definition in the MPSS and TSLS sample is the same (DSM-IV
schizophrenia) despite different recruitment period and procedure, we will pool the two family set to perform further linkage analysis. Increase heterogeneity in the large sample may contribute the failure to replicate the previous linkage results. Therefore, we will try to use the CPT performance as an endophenotype to stratify the large sample to see if different type of sub sample linked to different chromosome regions.
Searching for polymorphism in the vulnerability candidate gene located in this fine mapping study
We have located 2 candidate vulnerability genes in 1q42.1 region: (1) GNPAT gene and (2) DISC1 gene. We have identified one C→T SNP polymorphism site in DISC1 near promoter region (TATA box).
We found that this C→T polymorphism site is binding to IL-6 transcription factor. We hypothesized that this C→T SNP polymorphism may play a role in the pathophysiological process of a proportion of schizophrenia, if not all of the schizophrenic population, We also found that the C/C genotype has worse impairment in CPT, which is found to be a genetic trait marker of
schizophrenia. We’ll continue to study the functional expression and the possible clinical significance of this SNP of the DISC1 gene.
Regarding the GNPAT gene having 16 exons, we have found 3 haplotype-specific risk SNPs in exon 1, exon7 and exon11. These polymorphism are T C, A G and A A, respectively. Functional and clinical pathological studies are going on now to explore the possible biological significance.
Phenotype refinement according to the clinical phenotype and neuropsychological endophenotype of CPT and WCST data
We have initially analyzed the potential variable of age of onset, negative symptom, positive symptoms, d’ and lß of CPT indicators, and 9 parameters of WCST, using the QTDT of pedigree tests of transmission disequilibrium.
In this analysis we used 7 risk SNP markers. These 7 markers were S482, S485, S475, S488, S 489, S517, and S518 with distance (bp) of 8989,13648,6701,3154,470229,14268 respectively. The family number of study was 102, and study individuals of 478 (204 founders, 274 non founders). The family size was 4-7, and generation was of 2. The estimated heritability (h2) of possibly significant variables of age of onset (P=0.1029), negative symptom (p=0.0198), adjusted d’ Z value (P=8e-07) of undegraded CPT, adjusted d’Z value (p= 2e-07) of degraded CPT and
11
adjusted lß Z value (p=0.0019)of degraded CPT were0.220, 0.357, 0.381, 0.751, and 0.474, respectively.
Across these 7 markers , the mean additive genetic factors (σa ) of these variables of age of onset, negative sympton , d’Z of undegraded CPT, d’Z of degraded and lβZ of degraded CPT were 0.219 (P=0.0941), 0.205(p=0.0891), 0.525(P=2e-05), 0.626(P=9e-07)and 0.305(p=0.0162), respectively. Apparently, these significant variables could be used as the indicators to sub-classify the study subjects or families for further association and/ or linkage analysis. We are now using these variables to refine our 301 families for further analyses on SNP genotyping data.
Ten candidate genes association study (Work No.8)
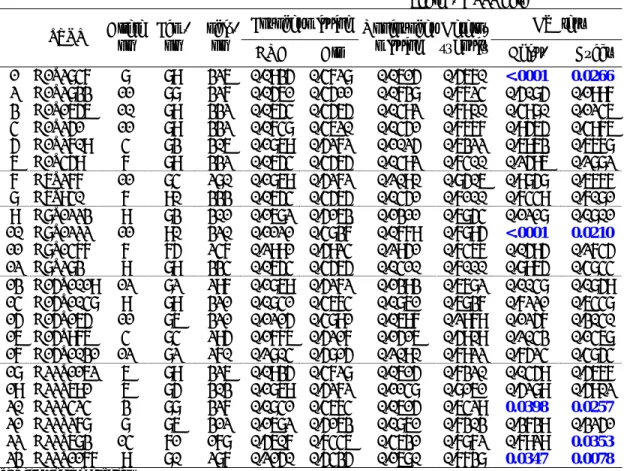
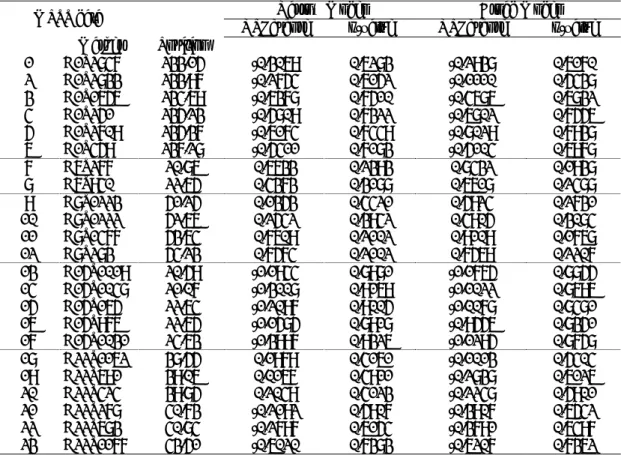
The 10 potential candidate genes illustrated in literature are DTNBP1(6p22.3), G72(13q33.2), DAAO (12q), NRG1(8P21), RGS4(1q23.3), PPP3CC(8P21.3), TNFA(6P21), NOTCH4(6p21), MRDS1(6P24.3), and CHRNA7(15q13.2). Those SNPs located in the exons, promotor region or exon-intron junction region were picked up for fine mapping study. A total of 141 SNPs were selected for fine mapping study. Through the first stage of SNP validation with the criteria of minor allele frequency above 0.1 in a sub sample, 82 SNPs were validated and listed in Table 7. Most of the SNPs were compatible with the Hardy Weinberg equilibrium. However, the 14 SNPs from CHRNA7 were all incompatible to Hardy-Weinberg equilibrium. We are working on this issue with National Genotyping Center. Therefore, the genotyping data of CHRNA7 will not be presented here. Considering the budget limitation, a total of 218 families, 86 from MPSS sample and 132 from TSLS sample, were included into the study.
The result were listed as following: 1. RGS4
Single point analysis revealed significant association with the SNP 6554 (p=0.004~0.008) and SNP 6557 (p=0.04) in both TSLS and MPSS families using Transmit v2.5.4. (Table 8). Haplotype association analysis revealed significant transmission distortion of haplotype 2.1.2.1 composed of SNP 6554, 6557, 6568, 6556 (p=0.048) in TSLS families (Table 9). 2. MRDS1
Single point analysis revealed significant association with the SNP 6623 (p=0.0365), SNP 6598 (p=0.008~0.0232) and SNP 6595 (p=0.02) in MPSS families and with SNP 6594 (p=0.02) in TSLS families using Transmit v2.5.4. (Table 8). Haplotype association analysis revealed significant transmission distortion of haplotype 2.2.2.2.2 composed of SNP 6624, 6596, 6597, 6598, 6595 (p=0.0264~0.0442) in MPSS sample (Table 10).
3. DTNBP1
Single point analysis revealed significant association with the SNP 6496
(p=0.0004~0.0008), SNP 6497 (p=0.0078~0.0197), SNP 6498 (p=0.0031~0.0066), and SNP 6495 (p=0.0046-0.0123) in MPSS families and with SNP 6498 (p=0.005) in TSLS families using Transmit v2.5.4. (Table 8). Haplotype association analysis revealed significant
transmission distortion of haplotype 1.1.1 (p=0.01) and of haplotype 1.1.2 (p=0.0002~0.0003) composed of SNP 6504, 6494, 6496 in MPSS sample and significant transmission distortion of haplotype 2.1.2.2 (p=0.0062) composed of SNP 6497, 6513, 6498, 6495 in TSLS sample (Table 11).
4. TNF-alpha
Single point analysis didn’t reveal significant association with the two SNPs selected from this gene in both MPSS families and TSLS families using Transmit v2.5.4. (Table 8). Haplotype association analysis revealed significant transmission distortion of haplotype 1.1
12
(p=0.04) composed of SNP 6563, 6584 in MPSS sample (Table 12). 5. NOTCH4
Single point analysis didn’t reveal significant association with the SNPs in MPSS families but revealed significant association with SNP 6581 (p=0.0064~0.0082) and SNP 6575 (P=0.0477) in TSLS families using Transmit v2.5.4. (Table 8). Haplotype association analysis revealed significant transmission distortion of haplotype 2.1.2 (p=0.0393) composed of SNP 6581, 6575, 6582, in TSLS sample (Table 13).
6. PPP3CC
Single point analysis didn’t reveal significant association with the SNPs in MPSS families but revealed significant association with SNP 6577 (p=0.003) in TSLS families using Transmit v2.5.4. (Table 8). Haplotype association analysis revealed significant transmission distortion of haplotype 2.1.1.2.1 (p<0.0001) composed of SNP 6555, 6560, 6569, 6561, 6562 in MPSS sample (Table 14). But the frequency of the haplotype 2.1.1.2.1 is very low (0.0016). 7. NRG1
Single point analysis didn’t reveal significant association with the SNPs in MPSS families but revealed significant association with with SNP 6539 (p=0.02) in TSLS families using Transmit v2.5.4. (Table 8). Haplotype association analysis revealed significant
transmission distortion of haplotype 2.2.1 (p=0.0337) composed of SNP 6524, 6529, 6530 in MPSS sample (Table 15).
8. DAAO
Single point analysis didn’t reveal significant association with the SNPs in both MPSS and TSLS families using Transmit v2.5.4. (Table 8). Haplotype association analysis revealed significant transmission distortion of haplotype 1.2.1 (p=0.02), of haplotype 2.1.2 (p=0.003) and of haplotype 2.2.2 (p=0.004) composed of SNP 6521, 6522, 6519 in TSLS sample (Table 16).
9. G72
Single point analysis revealed significant association with the SNP 6511 (p=0.0057~0.01), SNP 6517 (p=0.0112) in MPSS families but didn’t reveal significant association result in TSLS families using Transmit v2.5.4. (Table 8). Haplotype association analysis didn’t reveal significant association in both MPSS and TSLS sample (Table 17).
In conclusion, we found significant association between schizophrenia and the candidate genes of RGS4, MRDS1, DTNBP1, NOTCH4, NRG1 either through single point or haplotype association analysis. We will pool the MPSS and TSLS family sample for further analysis. In order to refine the phenotype, we will integrate the clinical and endophenotype data as CPT into further analysis. We will compare our results with the literature to see whether the associated region and the direction of association is consistent with the study of other ethnic sample.
22q12 Regions of SNP Selection Strategies and Validation (Work no. 9)
The D22S278 marker region of SNP selection was combining the consideration of candidate schizophrenia marker locus and the candidate genes in this area. A total of 2 Mb region covering
13
the upstream and downstream 1 Mb of marker D22S278 was searched according to the following strategies; first, the chromosomal location of the marker, second, the genes (in the order of exon, 5’-untranslated region, 3’-untranslated region, and intron) and the promoter region of each gene. The center locus of marker D22S278 is located in chromosome position of 34678466 bp of
chromosome 22q from NCBI UniSTS website (http://www.ncbi.nlm.nih.gov/genome/sts/sts.cgi?uid=37090). The upstream chromosome
position (33678466 bp) and the downstream chromosome position (35678466 bp) of marker D22S278 were filled into the position of UCSC Genome Browser (http://genome.ucsc.edu/cgi-bin/hgTracks) on Human (Fig.1). The 2 Mb region covers twenty-three genes, HMG2L1, TOM1, HMOX1, MCM5, RASD2, MB, APOL6, APOL5, RBM9, APOL3, APOL4, APOL2, APOL1, MYH9, TXN2, EIF3S7, CACNG2, RABL4, PVALB, NCF4, CSF2RB, TST, and MPST. The name of each gene or promoter region was linked to GeneCards website (http://bioinfo.weizmann.ac.il/cards/index.html), which leads to the recognition of whether a gene expressed in brain. The promoter and the exon SNPs of each gene were further selected from Biochip website (http://snpper.chip.org/bio/snpper-enter-gene).
There were 97 SNPs selected and validated from the D22S278 marker region on 94
independent individuals. The average distance between two SNPs is bps. There were 35 SNPs with allele frequencies less than 10%. Therefore, there should have only 62 SNPs qualified for further large samples (around 250 families) of genotyping.
Neuregulin 1 as a Candidate Gene Influencing Schizotypal Personality Features or Sustained Attention in Adolescents (Work No.10)
Please see attached draft, ‘Neuregulin 1 as a Candidate Gene Influencing Schizotypal Personality Features or Sustained Attention in Adolescents’
14
15
Table 1. Single point analysis of the 5 SNPs of GNPAT using Transmit v2.4.5 and FBAT v1.4.1
(a) Transmit version 2.5.4 ( 10000 bootstrap tests )
Narrow Model Broad Model
SNP N Chi-square P-value N Chi-square P-value 482 194 0.9397 0.9267 194 1.1555 0.2873 485 193 0.0030 0.9615 193 0.0034 0.9583 479 191 0.0005 0.9797 191 0.0187 0.8919 488 196 0.1451 0.7221 196 0.2452 0.6240 489 199 0.1550 0.7113 199 0.2223 0.6204
N: Number of families with transmissions to affected offspring
(b) FBAT version 1.4.1 (empirical variance)
Narrow Model Broad Model SNP Allele N Z P-value N Z P-value 482 1 71 -0.807 0.4194 70 -0.854 0.3928 485 1 74 0.070 0.9445 73 0.023 0.9815 479 1 72 0.048 0.9617 71 0.000 1.0000 488 1 73 -0.092 0.9270 72 -0.138 0.8905 489 1 70 0.250 0.8025 71 0.175 0.8614
16
Table 2. Haplotype association analysis of 5 SNPs of GNPAT gene using Transmit v2.5.4 and FBAT v1.4.1
(a ) Transmit version 2.5.4 ( 10000 bootstrap tests )
Narrow Model (N:195) Broad Model (N:195) Haploty
pe Frequency obs Exp. Chi-square P-value obs Exp. quareChi-s P-value 1.1.1.1. 1 0.5891 466.7 463.9 0 0.106 4 0.754 0 466.7 464.5 4 0.063 5 0.805 9 2.2.2.2. 2 0.3779 302.6 297.85 0.3041 0.5920 306.6 300.70 0.4667 0.4971 Global test 6.388 7 0.024 5 7.115 7 0.016 2
Degree of freedom Global test is 2
(b) Haplotype FBAT version 1.4.1 ( additive model; empirical variance )
Narrow Model Broad Model Haplotyp e Frequenc y N Z P-value N Z P-value 11111 0.584 52 1.067 0.2858 52 0.994 0.3202 22222 0.370 52 -0.319 0.7497 52 -0.216 0.8292 Global test 4.059 0.1314 4.164 0.1247
17
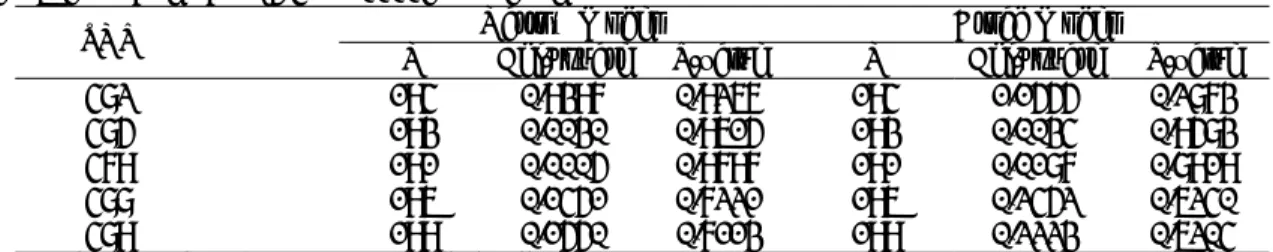
Table 3. Descriptive data of 23 STRP markers used in the linkage analysis
Table I. MPSS data
Founder missing HW test STRP Allele no Fam. no Indiv. no
DNA All
Nonfounder
missing zygosityHetero- Chi-s. Exact 1 D1S2847 8 89 326 0.0935 0.4728 0.0615 0.5670 <.0001 0.0266 2 D1S2833 11 88 327 0.0561 0.4511 0.0738 0.7624 0.5085 0.1997 3 D1S1656 10 89 332 0.0654 0.4565 0.0492 0.7900 0.4980 0.1246 4 D1S251 11 89 332 0.0748 0.4620 0.0451 0.7677 0.9565 0.4976 5 D1S2709 4 83 306 0.1869 0.5272 0.1025 0.6322 0.6963 0.6678 6 D1S459 7 89 332 0.0654 0.4565 0.0492 0.7400 0.2596 0.2882 7 D6S277 11 84 280 0.1869 0.5272 0.2090 0.8506 0.9858 0.6767 8 D6S940 7 90 333 0.0654 0.4565 0.0451 0.7100 0.7449 0.7081 9 D8S1223 9 83 301 0.1682 0.5163 0.1311 0.6854 0.1218 0.0801 10 D8S1222 11 90 320 0.1121 0.4837 0.0779 0.7895 <.0001 0.0210 11 D8S1477 7 75 247 0.2991 0.5924 0.2951 0.7467 0.0595 0.2745 12 D8S283 9 89 334 0.0654 0.4565 0.0410 0.7000 0.8965 0.4844 13 D15S1019 12 82 297 0.1869 0.5272 0.1393 0.6782 0.0048 0.0859 14 D15S1048 9 89 321 0.0841 0.4674 0.0861 0.6837 0.7221 0.6448 15 D15S165 11 86 321 0.1215 0.4891 0.0697 0.2979 0.1257 0.3040 16 D15S976 4 84 295 0.1776 0.5217 0.1516 0.5909 0.2043 0.1468 17 D15S1031 12 82 270 0.2804 0.5815 0.2090 0.7922 0.7524 0.4854 18 D22S1162 6 89 326 0.0935 0.4728 0.0615 0.7320 0.0459 0.5667 19 D22S691 6 85 303 0.1869 0.5272 0.1148 0.8161 0.5289 0.5902 20 D22S424 3 88 327 0.0841 0.4674 0.0615 0.6429 0.0398 0.0257 21 D22S278 8 86 312 0.1682 0.5163 0.0861 0.7303 0.3739 0.3251 22 D22S683 14 71 178 0.5607 0.7446 0.4631 0.7872 0.7929 0.0353 23 D22S1177 9 80 287 0.2150 0.5435 0.1680 0.7738 0.0347 0.0078
18
Table II. TSLS data
Founder missing HW test STRP Allele no Fam.no Indiv. no
DNA All
Nonfounder
missing zygosity Chi-sq.Hetero- Exact 1 D1S2847 7 378 1488 0.0499 0.3131 0.0507 0.5760 0.9596 0.7249 2 D1S2833 13 373 1477 0.0606 0.3209 0.0557 0.8083 0.2998 0.0205 3 D1S1656 11 381 1520 0.0267 0.2964 0.0318 0.8333 0.5770 0.4923 4 D1S251 12 373 1464 0.0588 0.3196 0.0696 0.7841 <.0001 0.8384 5 D1S2709 6 353 1417 0.1141 0.3595 0.0855 0.6901 0.0010 <.0001 6 D1S459 11 384 1515 0.0250 0.2951 0.0378 0.7331 0.9988 0.7354 7 D6S277 15 377 1506 0.0339 0.3015 0.0417 0.7952 0.9183 0.2162 8 D6S940 9 381 1519 0.0285 0.2977 0.0318 0.7505 0.4985 0.4315 9 D8S1223 11 386 1540 0.0143 0.2874 0.0189 0.5841 0.8352 0.2971 10 D8S1222 15 372 1486 0.0446 0.3093 0.0557 0.8153 0.1569 0.0742 11 D8S1477 12 371 1478 0.0642 0.3235 0.0527 0.7886 0.9800 0.2461 12 D8S283 11 385 1538 0.0214 0.2925 0.0169 0.6576 0.9996 0.9547 13 D15S1019 14 371 1440 0.0713 0.3286 0.0865 0.6948 <.0001 0.1832 14 D15S1048 12 373 1473 0.0535 0.3157 0.0636 0.6949 0.9382 0.7394 15 D15S165 11 376 1480 0.0553 0.3170 0.0557 0.3094 0.9116 0.4790 16 D15S976 8 338 1334 0.1586 0.3918 0.1431 0.5911 0.2667 0.0106 17 D15S1031 16 306 1116 0.2816 0.4807 0.2913 0.7891 0.6631 0.0481 18 D22S1162 8 383 1514 0.0339 0.3015 0.0338 0.7362 0.3215 0.2935 19 D22S691 10 354 1381 0.1087 0.3557 0.1243 0.7320 0.9974 0.9054 20 D22S424 4 386 1539 0.0160 0.2887 0.0189 0.5054 0.9645 0.8701 21 D22S278 11 344 1333 0.1426 0.3802 0.1531 0.7796 <.0001 0.0010 22 D22S683 26 354 1384 0.1052 0.3531 0.1233 0.8167 0.0861 0.2266 23 D22S1177 10 365 1433 0.0677 0.3260 0.0954 0.7094 0.5217 0.7060
19
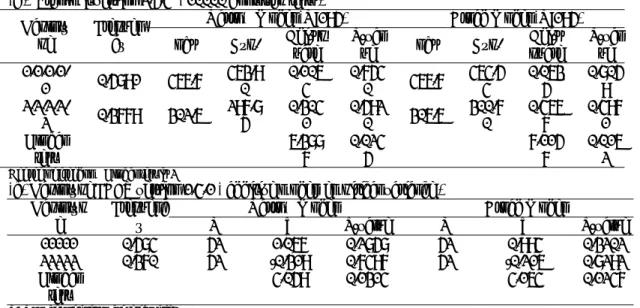
Table 4-1. Two-Point Nonparametric Linkage Analysis of 23 STRP markers in 5 chromosome regions
S.A.G.E. RELEASE 3.1 -- SIBPAL Narrow Model Broad Model MPSS data
N1 Proportion2 P-value N1 Proportion2 P-value
Marker 1 D1S2847 80 .5006 .4918 97 .4976 .5362 2 D1S2833 83 .5120 .3655 97 .5065 4218 3 D1S1656 84 .5018 .4780 101 .5009 .4883 4 D1S251 85 .4687 .8292 101 .4685 .8468 D1S2709 81 .4950 .5835 96 .5004 4921 6 D1S459 85 .4972 .5384 102 .4995 .5072 7 D6S277 62 .5255 .2463 76 .5302 .1749 8 D6S940 84 .5109 .3637 98 .5122 .3281 9 D8S1223 77 .5183 .2593 93 .5360 .0849 10 D8S1222 80 .5337 .1445 95 .5256 .1996 11 D8S1477 60 .5423 .1346 67 .5504 .0843 12 D8S283 87 .5538 .0260 103 .5380 .0633 13 D15S1019 74 .4567 .9093 89 .4668 .8720 14 D15S1048 79 .4920 .5967 95 .5049 4333 15 D15S165 81 .5087 .3522 98 .5084 3414 16 D15S976 69 .5027 .4635 83 .4984 .5239 17 D15S1031 68 .4452 .9445 77 .4618 .8853 18 D22S1162 82 .5429 .0629 97 .5457 .0378 19 D22S691 75 .5332 .1745 92 .5224 .2323 20 D22S424 83 .5158 .2262 99 .5111 .2889 21 D22S278 78 .5154 .3153 94 .5123 .3358 22 D22S683 37 .5835 .0304 43 .5890 .0122 23 D22S1177 75 .4984 .5200 84 .5045 .4410
20
Table 4-2. Two-Point Nonparametric Linkage Analysis of 23 STRP markers in 5 chromosome regions
Narrow Model Broad Model
TSLS data N1 Proportion2 P-value N1 Proportion2 P-value
Marker 1 D1S2847 398 .5075 .2809 404 .5089 .2436 2 D1S2833 396 .5200 .1007 402 .5202 .0955 3 D1S1656 408 .5211 .0837 414 .5223 .0711 4 D1S251 389 .5289 .0287 395 .5286 .0283 5 D1S2709 390 .5180 .0778 394 .5188 .0676 6 D1S459 401 .5010 .4717 407 .5009 .4739 7 D6S277 403 .5113 .2291 409 .5092 .2717 8 D6S940 406 .5036 .4023 412 .5014 .4619 9 D8S1223 414 .5138 .1287 420 .5085 .2451 10 D8S1222 398 .5139 .1908 404 .5106 .2512 11 D8S1477 400 .5231 .0674 406 .5214 .0804 12 D8S283 416 .5135 .1609 422 .5113 .2022 13 D15S1019 382 .5064 .3210 388 .5057 .3390 14 D15S1048 394 .5203 .0720 400 .5196 .0771 15 D15S165 396 .4998 .5091 402 .4998 .5077 16 D15S976 350 .5143 .1539 356 .5155 .1341 17 D15S1031 289 .5017 .4626 293 .5005 .4892 18 D22S1162 404 .5002 .4935 410 .4938 .6687 19 D22S691 363 .4841 .8631 368 .4838 .8709 20 D22S424 412 .4973 .6055 418 .4978 .5841 21 D22S278 349 .5223 .0747 354 .5172 .1387 22 D22S683 361 .5154 .1351 367 .5000 .4996 23 D22S1177 375 .5181 .0854 381 .5223 .0568
21
Table 5-1. Two-point nonparametric analysis of 23 STRP markers in 5 chromosome regions using GeneHunter 2.1
Narrow Model Broad Model MPSS data
NPL_score p-value NPL_score p-value Marker 1 D1S2847 0.1130 0.4515 0.0444 0.4804 2 D1S2833 0.2162 0.4094 0.2548 0.3959 3 D1S1656 -0.0251 0.5108 0.1682 0.4304 4 D1S251 -0.6174 0.7449 -0.5904 0.7261 5 D1S2709 -0.1125 0.5476 -0.0685 0.5270 6 D1S459 -0.0836 0.5348 0.0612 0.4739 7 D6S277 0.5212 0.2892 0.6640 0.2482 8 D6S940 0.2147 0.4079 0.3165 0.3723 9 D8S1223 0.4252 0.3261 0.9800 0.1592 10 D8S1222 0.6583 0.2426 0.7442 0.2242 11 D8S1477 0.7252 0.2197 0.8847 0.1839 12 D8S283 1.3438 0.0771 1.1708 0.1171 13 D15S1019 -0.9947 0.8555 -1.0298 0.8536 14 D15S1048 -0.2055 0.5869 -0.0781 0.5309 15 D15S165 0.0440 0.4812 -0.0233 0.5087 16 D15S976 -0.0198 0.5079 -0.2269 0.5907 17 D15S1031 -1.0433 0.8665 -1.0009 0.8462 18 D22S1162 0.9891 0.1458 1.1151 0.1272 19 D22S691 0.6015 0.2598 0.3977 0.3416 20 D22S424 0.4548 0.3135 0.4423 0.3245 21 D22S278 0.2554 0.3934 0.3265 0.3684 22 D22S683 0.7746 0.2042 0.9309 0.1704 23 D22S1177 -0.0955 0.5411 -0.0015 0.4993
22
Table 5-2. Two-point nonparametric analysis of 23 STRP markers in 5 chromosome regions using GeneHunter 2.1
TSLS data Narrow Model Broad Model
NPL_score p-value NPL_score p-value Marker 1 D1S2847 0.5022 0.2960 0.5759 0.2715 2 D1S2833 1.3657 0.0797 1.3781 0.0784 3 D1S1656 1.1729 0.1126 1.1942 0.1092 4 D1S251 1.4723 0.0649 1.3932 0.0762 5 D1S2709 0.8663 0.1832 0.9623 0.1593 6 D1S459 0.0947 0.4505 0.0663 0.4622 7 D6S277 0.6446 0.2482 0.4985 0.2978 8 D6S940 0.2652 0.3833 0.1590 0.4251 9 D8S1223 0.8859 0.1777 0.5930 0.2657 10 D8S1222 0.7873 0.2048 0.6498 0.2472 11 D8S1477 1.1222 0.1224 1.0873 0.1304 12 D8S283 0.9697 0.1565 0.8728 0.1819 13 D15S1019 0.6093 0.2597 0.6020 0.2629 14 D15S1048 1.0931 0.1287 1.1060 0.1267 15 D15S165 0.0209 0.4801 0.0479 0.4694 16 D15S976 0.9455 0.1628 1.0246 0.1446 17 D15S1031 0.3373 0.3559 0.3299 0.3592 18 D22S1162 -0.2180 0.5759 -0.3366 0.6220 19 D22S691 -0.7383 0.7633 -0.8066 0.7837 20 D22S424 -0.0374 0.5035 -0.0050 0.4907 21 D22S278 0.8821 0.1789 0.9214 0.1694 22 D22S683 0.4511 0.3142 0.4031 0.3319 23 D22S1177 1.3534 0.0815 1.2814 0.0937
23
Table 6-1. MultiPoint Nonparametric Linkage Analysis of 23 STRP markers in 5 chromosome regions using
GeneHunter 2.1
Narrow Model Broad Model
MPSS data NPL_score p-value NPL_score p-value Marker Position 1 D1S2847 233.15 -0.3069 0.6283 -0.2938 0.6170 2 D1S2833 233.97 -0.2754 0.6152 -0.1110 0.5438 3 D1S1656 234.69 -0.6378 0.7510 -0.4686 0.6832 4 D1S251 235.23 -0.5809 0.7322 -0.6802 0.7556 5 D1S2709 235.37 -0.6174 0.7449 -0.8029 0.7938 6 D1S459 237.28 -0.5411 0.7183 -0.5104 0.6978 7 D6S277 20.86 0.6633 0.2393 0.8432 0.1938 8 D6S940 22.65 0.4373 0.3188 0.6618 0.2488 9 D8S1223 51.25 0.1353 0.4421 0.5924 0.2731 10 D8S1222 52.66 0.2542 0.3942 0.4905 0.3084 11 D8S1477 53.64 0.7609 0.2102 0.9109 0.1768 12 D8S283 54.23 0.7574 0.2102 0.7569 0.2207 13 D15S1019 20.59 -1.1944 0.8981 -1.1765 0.8855 14 D15S1048 21.07 -1.3008 0.9169 -1.1022 0.8696 15 D15S165 22.64 -1.2097 0.9005 -1.0078 0.8481 16 D15S976 22.65 -1.1585 0.8918 -0.9556 0.8351 17 D15S1031 24.63 -1.3997 0.9326 -1.1295 0.8758 18 D22S1162 38.55 0.1979 0.4161 -0.1013 0.5404 19 D22S691 39.06 0.0167 0.4911 -0.2838 0.6126 20 D22S424 39.85 0.2049 0.4123 -0.2248 0.5901 21 D22S278 40.73 -0.2192 0.5907 -0.3907 0.6542 22 D22S683 40.84 -0.2797 0.6154 -0.3791 0.6497 23 D22S1177 43.51 -0.6020 0.7383 -0.6207 0.7362
24
Table 6-2. MultiPoint Nonparametric Linkage Analysis of 23 STRP markers in 5 chromosome regions using
GeneHunter 2.1
Narrow Model Broad Model TSLS data
NPL_score p-value NPL_score p-value Marker Position 1 D1S2847 233.15 0.8523 0.1869 0.8199 0.1966 2 D1S2833 233.97 0.9409 0.1639 0.8903 0.1776 3 D1S1656 234.69 0.8149 0.1973 0.7504 0.2165 4 D1S251 235.23 0.9075 0.1723 0.8836 0.1793 5 D1S2709 235.37 0.5598 0.2762 0.5585 0.2773 6 D1S459 237.28 0.5430 0.2819 0.5130 0.2928 7 D6S277 20.86 0.2708 0.3811 0.1098 0.4447 8 D6S940 22.65 0.3620 0.3466 0.2286 0.3980 9 D8S1223 51.25 1.2431 0.0994 1.0281 0.1434 10 D8S1222 52.66 0.7088 0.2281 0.5710 0.2730 11 D8S1477 53.64 1.2405 0.0998 1.1485 0.1179 12 D8S283 54.23 1.1878 0.1095 1.0593 0.1366 13 D15S1019 20.59 0.6883 0.2347 0.6817 0.2374 14 D15S1048 21.07 1.1462 0.1178 1.1579 0.1162 15 D15S165 22.64 1.5729 0.0530 1.6388 0.0466 16 D15S976 22.65 1.6484 0.0453 1.7151 0.0396 17 D15S1031 24.63 0.7739 0.2090 0.7799 0.2079 18 D22S1162 38.55 -0.1577 0.5518 -0.2262 0.5790 19 D22S691 39.06 -0.6912 0.7484 -0.7577 0.7689 20 D22S424 39.85 -0.1398 0.5447 -0.1830 0.5620 21 D22S278 40.73 -0.0869 0.5235 -0.1689 0.5563 22 D22S683 40.84 0.3187 0.3629 0.1830 0.4157 23 D22S1177 43.51 0.4939 0.2990 0.3643 0.3463
25
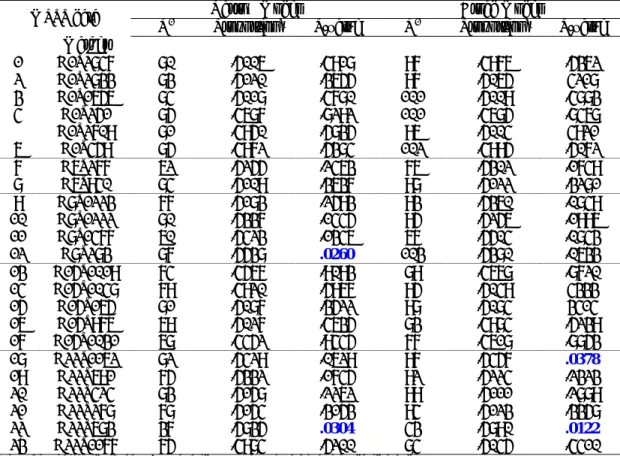
Table 7-1. The descriptive data of validated 82 SNPs from 10 candidate genes
MPSS data TSLS data HW Test HW Test Genes Chromosome Primer SNP ID Location Type Minor
Allele Freq P-value Exact Minor
Allele Freq P-value Exact 1 6554 SNP 1 159728876 G=1 A=2 0.1691 <.0001 <.0001 0.0459 <.0001 <.0001 2 6557 rs951436 159729374 A=1 C=2 0.5054 0.5831 0.6649 0.4727 0.8138 0.8753 3 6568 SNP7 159729725 G=1 A=2 0.4388 0.7250 0.8191 0.4453 0.5788 0.6486 4 RGS4 1 6556 SNP18 159735811 A=1 G=2 0.4674 0.4121 0.5105 0.4408 0.8934 1.0000 5 6594 rs1925767 9969042 T=1 C=2 0.1613 0.1996 0.2300 0.1953 0.1411 0.1423 6 6601 rs1925773 9984452 T=1 C=2 0.3454 0.0555 0.0905 0.2835 0.6277 0.7269 7 6623 rs2327219 10017872 C=1 A=2 0.4595 0.0002 0.0005 0.4217 <.0001 <.0001 8 6624 rs201264 10044086 T=1 A=2 0.4121 0.1112 0.1738 0.4461 0.7368 0.7425 9 6596 rs201260 10056935 A=1 C=2 0.3776 0.7762 0.8187 0.3549 0.7256 0.8722 10 6597 rs201252 10073630 C=1 T=2 0.2283 0.0993 0.1157 0.2432 0.8594 0.8423 11 6598 rs1206988 10087353 T=1 C=2 0.1789 0.1073 0.1354 0.2042 0.4491 0.4832 12 6595 rs855407 10102400 G=1 A=2 0.1868 0.0955 0.1286 0.1995 0.9554 1.0000 13 6608 rs1407621 10128531 T=1 C=2 0.1823 0.5436 0.4896 0.2173 0.8433 1.0000 14 MRDS1 6 6609 rs1407625 10131336 G=1 A=2 0.1768 0.4193 0.4656 0.2120 0.9921 1.0000 15 6492 rs742106 15587019 A=1 G=2 0.4570 0.5592 0.6667 0.4172 0.1350 0.1885 16 6504 rs3829893 15678176 G=1 A=2 0.2903 0.6468 0.7943 0.3185 0.4335 0.5736 17 6494 rs2619539 15683394 C=1 G=2 0.4066 0.3257 0.3550 0.3810 0.1229 0.1768 18 6496 rs1011313 15695971 C=1 T=2 0.2055 0.6568 0.6818 0.1845 0.7556 1.0000 19 6497 rs2619528 15712368 C=1 T=2 0.1099 0.2318 0.5945 0.0909 0.7878 1.0000 20 6513 rs2005976 15713341 C=1 T=2 0.1250 0.1870 0.3476 0.0625 0.4197 1.0000 21 6498 rs760761 15713671 G=1 A=2 0.1111 0.2281 0.5814 0.0559 0.1771 0.2447 22 6495 rs2619522 15716188 A=1 C=2 0.1087 0.2354 0.5891 0.0909 0.7878 1.0000 23 6500 rs1018381 15719609 G=1 A=2 0.1087 0.2354 0.5936 0.0592 0.4477 1.0000 24 6501 rs909706 15723410 T=1 C=2 0.4000 0.5762 0.6357 0.3876 0.0625 0.0921 25 DTNBP1 6 6499 rs441539 15827177 T=1 C=2 0.1739 0.2760 0.2536 0.2012 0.0481 0.0727 26 6563 rs2009658 31597109 C=1 G=2 0.1173 0.2852 0.5915 0.1528 0.1704 0.2603 27 TNFa 6 6584 rs2256974 31614256 C=1 A=2 0.3889 0.6334 0.8108 0.4785 0.0055 0.0062
26
Table 7-2. The descriptive data of validated 82 SNPs from 10 candidate genes
MPSS data TSLS data HW Test HW Test Genes Chromosome Primer SNP ID Location Type Minor
Allele Freq P-value Exact Minor
Allele Freq P-value Exact 28 6581 rs204993 32181580 A=1 G=2 0.4141 0.4337 0.5219 0.3750 0.3745 0.4248 29 6575 rs2071285 32206436 A=1 T=2 0.1868 0.5668 0.7254 0.1716 0.7303 1.0000 30 6582 rs3131290 32209207 G=1 A=2 0.1173 0.0158 0.0434 0.1425 0.8424 0.7648 31 6583 rs415929 32215059 T=1 C=2 0.1753 0.0520 0.0676 0.1632 0.5044 0.7721 32 6587 rs915895 32216244 C=1 T=2 0.5300 0.7140 0.8286 0.4923 0.0020 0.0015 33 6592 rs915894 32216417 T=1 G=2 0.4176 0.3647 0.3670 0.4673 0.0236 0.0272 34 NOTCH4 6 6593 rs397081 32218641 T=1 C=2 0.1739 0.2354 0.4431 0.1627 0.1873 0.2470 35 6577 rs2272080 22119295 T=1 G=2 0.1059 0.3765 1.0000 0.2018 0.5391 0.6039 36 6555 rs2461491 22181821 G=1 A=2 0.3778 0.8042 1.0000 0.4371 0.4631 0.5048 37 6560 rs2469758 22183601 T=1 C=2 0.3737 0.4883 0.6531 0.4308 0.5059 0.5484 38 6569 rs2461489 22190822 A=1 G=2 0.4286 0.4958 0.6643 0.4895 0.4582 0.4587 39 6561 rs2469770 22200425 A=1 G=2 0.3814 0.7225 0.8189 0.4356 0.7576 0.7616 40 6562 rs2449340 22210469 G=1 T=2 0.3150 0.1824 0.2277 0.3135 0.8689 1.0000 41 6559 rs1482337 22216078 A=1 G=2 0.4000 0.7108 0.8178 0.4921 0.8255 0.8861 42 PPP3CC 8 6566 rs2252471 22225797 C=1 G=2 0.3788 0.3930 0.4893 0.4450 0.9404 1.0000 43 6524 SNP8NRG221 31330342 C=1 T=2 0.4540 0.0951 0.1088 0.4042 0.7744 0.8654 44 6529 rs4452759 31343650 C=1 T=2 0.4271 0.2182 0.2615 0.3763 0.8810 0.8798 45 6530 rs4476964 31348868 C=1 T=2 0.3316 0.0867 0.0866 0.3177 0.3486 0.3966 46 6526 SNP8NRG243 31351791 T=1 C=2 0.4261 0.0130 0.0196 0.3935 0.8534 1.0000 47 6544 rs1481736 31836842 G=1 A=2 0.5114 0.6516 0.6499 0.4556 0.0471 0.0582 48 6539 rs4733331 32134140 T=1 A=2 0.1927 0.3235 0.3136 0.1718 0.4693 0.6085 49 6543 rs4489283 32255862 C=1 T=2 0.2363 0.5258 0.5490 0.2440 0.3903 0.5145 50 6523 rs3924999 32309558 A=1 G=2 0.2021 0.0641 0.1078 0.2367 0.8817 0.8227 51 6549 rs3924999 32309558 A=1 G=2 0.2050 0.0452 0.0594 0.2371 0.7125 0.6810 52 6550 rs2439325 32373968 A=1 G=2 0.2371 0.3958 0.3721 0.2333 0.2094 0.3088 53 6540 rs2954041 32378826 G=1 T=2 0.3696 0.2528 0.3604 0.3667 0.7576 0.7493 54 6547 rs3735775 32441623 G=1 A=2 0.3594 0.2419 0.3347 0.3910 0.8708 0.8814 55 NRG1 8 6552 rs3735776 32441634 C=1 A=2 0.3636 0.1444 0.1723 0.3846 0.8935 0.8778 56 6521 rs2111902 109211693 G=1 T=2 0.4550 0.7140 0.8335 0.4922 0.8769 1.0000 57 6522 rs3918346 109214830 A=1 G=2 0.3778 0.0109 0.0215 0.3883 <.0001 <.0001 58 DAAO 12 6519 rs3741775 109216549 A=1 C=2 0.3878 0.9436 1.0000 0.3995 0.9841 1.0000
27
Table 7-3. The descriptive data of validated 82 SNPs from 10 candidate genes
MPSS data TSLS data HW Test HW Test Genes Chromosome Primer SNP ID Location Type Minor
Allele Freq P-value Exact Minor
Allele Freq P-value Exact 59 6506 rs3916965 104939998 T=1 C=2 0.3596 0.3071 0.3535 0.3735 0.6243 0.7237 60 6503 rs3916966 104947533 C=1 A=2 0.3830 0.2462 0.3657 0.3817 0.6336 0.7345 61 6510 rs3916967 104953986 C=1 T=2 0.3626 0.2193 0.2522 0.3817 0.6336 0.7236 62 6507 rs2391191 104956084 A=1 G=2 0.3626 0.2193 0.2535 0.3817 0.6336 0.7377 63 6511 rs3916968 104957057 C=1 T=2 0.1966 0.7061 0.7298 0.1607 0.6146 0.5584 64 6516 rs3916970 104976300 T=1 C=2 0.3989 0.1077 0.1754 0.3680 0.0275 0.0387 65 6517 rs3916971 104978873 T=1 C=2 0.4286 0.4245 0.5220 0.4275 0.2062 0.2297 66 6518 rs947267 104998639 T=1 G=2 0.4316 0.7380 0.8270 0.4948 0.0527 0.0504 67 6515 rs778293 105005837 T=1 C=2 0.3454 0.9829 1.0000 0.3151 0.8023 0.8658 68 G72 13 6520 rs3918342 105022387 T=1 C=2 0.4898 0.0881 0.0894 0.4510 0.2032 0.2254 69 6610 rs2924987 28229586 G=1 A=2 0.3163 <.0001 <.0001 0.3212 <.0001 <.0001 70 6599 rs286103 28233774 G=1 A=2 0.5000 <.0001 <.0001 0.4949 <.0001 <.0001 71 6605 rs2253967 28234754 G=1 A=2 0.2500 0.0010 0.0006 0.2605 <.0001 <.0001 72 6606 rs1042724 28234820 G=1 A=2 0.3093 <.0001 <.0001 0.3316 <.0001 <.0001 73 6607 rs2564605 28239618 G=1 A=2 0.3053 <.0001 <.0001 0.3226 <.0001 <.0001 74 6612 rs2564606 28239668 C=1 G=2 0.3032 <.0001 <.0001 0.3221 <.0001 <.0001 75 6618 rs384470 28239762 C=1 T=2 0.3167 <.0001 <.0001 0.3244 <.0001 <.0001 76 6620 rs2651439 28243491 C=1 T=2 0.3407 <.0001 <.0001 0.3225 <.0001 <.0001 77 6621 rs2611608 28244413 G=1 A=2 0.3495 <.0001 <.0001 0.3225 <.0001 <.0001 78 6615 rs1042722 28244537 T=1 C=2 0.4889 <.0001 <.0001 0.5000 <.0001 <.0001 79 6626 rs386715 28244573 G=1 A=2 0.4731 <.0001 <.0001 0.5000 <.0001 <.0001 80 6627 rs408234 28245254 T=1 C=2 0.4457 <.0001 <.0001 0.4671 <.0001 <.0001 81 6628 rs2653242 28266172 C=1 G=2 0.4947 <.0001 <.0001 0.4948 <.0001 <.0001 82 CHRNA7 15 6629 rs3901746 28275516 A=1 G=2 0.5000 <.0001 <.0001 0.5000 <.0001 <.0001
28
Table 8-1. Single Point Association Analysis of 10 candidate genes using Transmit v2.5.4
MPSS data TSLS data
Narrow Model Broad Model Narrow Model Broad Model Candidate
genes Primer
N Chi P N Chi P N Chi P N Chi P 1 6554 64 7.31 0.0068 65 6.90 0.0086 84 8.31 0.0039 84 8.31 0.0039 2 6557 79 3.47 0.0627 81 4.13 0.0421 115 0.60 0.4403 115 0.50 0.4805 3 6568 84 1.48 0.2245 86 1.77 0.1828 132 0.09 0.7579 132 0.10 0.7498 4 RGS4 6556 79 1.00 0.3182 81 1.20 0.2732 115 1.01 0.3161 115 0.89 0.3463 5 6594 80 0.02 0.8803 82 0.15 0.7014 115 5.16 0.0231 115 4.84 0.0279 6 6601 84 3.17 0.0750 86 3.37 0.0663 132 0.08 0.7819 132 0.05 0.8216 7 6623 69 4.37 0.0365 71 1.97 0.1606 86 2.57 0.1088 86 2.57 0.1088 8 6624 80 0.07 0.7944 82 0.00 0.9583 115 0.02 0.8761 115 0.06 0.8040 9 6596 84 0.59 0.4410 86 0.82 0.3652 132 0.02 0.8896 132 0.05 0.8205 10 6597 83 0.91 0.3413 85 1.34 0.2477 132 0.32 0.5687 132 0.22 0.6417 11 6598 81 5.15 0.0232 83 7.02 0.0080 132 1.90 0.1686 132 1.60 0.2064 12 6595 81 5.27 0.0217 84 5.41 0.0200 132 1.12 0.2898 132 0.91 0.3395 13 6608 82 0.68 0.4095 85 0.53 0.4674 132 0.41 0.5210 132 0.42 0.5175 14 MRDS1 6609 83 0.46 0.4965 86 0.37 0.5429 132 0.39 0.5306 132 0.40 0.5272 15 6492 80 0.00 0.9886 82 0.03 0.8596 115 0.50 0.4815 115 0.56 0.4542 16 6504 80 1.53 0.2157 82 1.07 0.3019 115 0.00 0.9438 115 0.00 0.9516 17 6494 80 1.13 0.2878 82 0.73 0.3933 115 0.24 0.6209 115 0.23 0.6285 18 6496 70 11.27 0.0008 72 12.66 0.0004 129 1.55 0.2125 129 1.40 0.2370 19 6497 80 5.44 0.0197 82 7.08 0.0078 128 2.46 0.1169 128 2.13 0.1441 20 6513 80 0.03 0.8699 82 0.04 0.8349 115 0.26 0.6079 115 0.40 0.5260 21 6498 79 7.39 0.0066 82 8.78 0.0031 120 7.89 0.0050 120 7.89 0.0050 22 6495 81 6.27 0.0123 83 8.01 0.0046 128 2.46 0.1169 128 2.13 0.1441 23 6500 80 0.02 0.8912 82 0.01 0.9310 115 1.03 0.3099 115 1.03 0.3110 24 6501 80 0.83 0.3621 82 0.40 0.5265 115 0.08 0.7839 115 0.12 0.7284 25 DTNBP1 6499 80 0.27 0.6052 82 0.41 0.5231 115 0.52 0.4708 115 0.51 0.4743
29
Table 8-2. Single Point Association Analysis of 10 candidate genes using Transmit v2.5.4
MPSS data TSLS data
Narrow Model Broad Model Narrow Model Broad Model Candidate
genes Primer
N Chi P N Chi P N Chi P N Chi P 26 6563 84 1.64 0.2003 86 0.60 0.4395 132 0.01 0.9293 132 0.00 0.9984 27 TNF-alpha 6584 81 0.96 0.3276 83 1.84 0.1752 129 0.85 0.3573 129 1.10 0.2938 28 6581 84 0.52 0.4728 86 0.11 0.7369 132 6.99 0.0082 132 7.42 0.0064 29 6575 80 0.06 0.8129 82 0.01 0.9123 115 3.92 0.0477 115 3.47 0.0626 30 6582 84 3.12 0.0774 86 1.93 0.1653 132 0.00 0.9773 132 0.00 0.9842 31 6583 83 0.07 0.7973 85 0.04 0.8463 132 1.02 0.3115 132 0.87 0.3498 32 6587 84 0.11 0.7356 86 0.17 0.6764 132 0.26 0.6097 132 0.18 0.6672 33 6592 80 0.19 0.6605 82 0.10 0.7495 115 0.54 0.4643 115 0.38 0.5371 34 NOTCH4 6593 79 0.02 0.8820 82 0.05 0.8172 115 2.01 0.1560 115 2.00 0.1573 35 6577 78 0.02 0.9006 80 0.11 0.7390 115 8.58 0.0034 115 8.61 0.0033 36 6555 79 1.39 0.2387 81 1.12 0.2897 115 0.22 0.6425 115 0.20 0.6572 37 6560 84 0.71 0.4010 86 0.55 0.4580 132 0.06 0.8137 132 0.05 0.8286 38 6569 84 1.41 0.2355 86 1.02 0.3130 132 0.20 0.6524 132 0.22 0.6422 39 6561 84 1.02 0.3129 86 0.82 0.3647 132 0.00 0.9965 132 0.00 0.9818 40 6562 84 1.20 0.2732 86 1.19 0.2762 131 0.65 0.4208 131 0.69 0.4064 41 6559 82 0.98 0.3218 84 0.83 0.3615 128 0.08 0.7813 128 0.14 0.7034 42 PPP3CC 6566 84 0.83 0.3622 86 0.55 0.4575 132 0.00 0.9811 132 0.02 0.8937 43 6524 79 2.97 0.0846 81 1.62 0.2038 115 0.00 0.9948 115 0.00 0.9582 44 6529 83 0.72 0.3965 85 0.20 0.6512 132 0.01 0.9416 132 0.00 0.9986 45 6530 82 0.29 0.5886 84 1.10 0.2936 132 1.35 0.2451 132 1.16 0.2814 46 6526 78 0.09 0.7683 80 0.48 0.4889 115 0.18 0.6756 115 0.22 0.6408 47 6544 79 0.02 0.8748 81 0.31 0.5759 115 0.30 0.5865 115 0.37 0.5426 48 6539 84 0.67 0.4119 86 0.33 0.5663 132 5.08 0.0242 132 5.06 0.0245 49 6543 80 0.52 0.4714 82 1.27 0.2601 115 0.03 0.8665 115 0.03 0.8720 50 6523 80 0.04 0.8362 82 0.01 0.9218 115 1.64 0.2006 115 1.65 0.1985 51 6549 83 0.28 0.5977 85 0.18 0.6713 132 0.29 0.5891 132 0.30 0.5855 52 6550 84 1.70 0.1928 86 1.41 0.2355 132 0.13 0.7222 132 0.08 0.7720 53 6540 84 0.04 0.8426 86 0.15 0.7027 132 2.88 0.0897 132 2.79 0.0948 54 6547 83 2.44 0.1186 85 2.46 0.1167 128 1.09 0.2955 128 1.24 0.2654 55 NRG1 6552 84 2.49 0.1143 86 3.02 0.0823 132 1.91 0.1670 132 2.10 0.1475
30
Table 8-3. Single Point Association Analysis of 10 candidate genes using Transmit v2.5.4
MPSS data TSLS data
Narrow Model Broad Model Narrow Model Broad Model Candidate
genes Primer
N Chi P N Chi P N Chi P N Chi P 56 6521 84 0.34 0.5617 86 0.03 0.8701 132 0.20 0.6528 132 0.19 0.6617 57 6522 81 0.25 0.6158 83 0.88 0.3493 132 1.40 0.2369 132 1.43 0.2311 58 DAAO 6519 83 0.05 0.8300 85 0.00 0.9441 132 0.79 0.3754 132 0.77 0.3811 59 6506 80 1.53 0.2169 81 0.98 0.3231 115 0.20 0.6524 115 0.16 0.6918 60 6503 80 1.56 0.2110 82 1.12 0.2893 115 0.14 0.7124 115 0.10 0.7502 61 6510 78 1.80 0.1803 80 1.53 0.2167 115 0.10 0.7461 115 0.07 0.7843 62 6507 78 1.96 0.1616 80 1.49 0.2225 115 0.08 0.7751 115 0.06 0.8136 63 6511 79 6.63 0.0100 81 7.65 0.0057 115 0.93 0.3344 115 0.94 0.3319 64 6516 80 1.56 0.2117 82 1.36 0.2436 131 0.25 0.6190 131 0.20 0.6508 65 6517 84 6.43 0.0112 86 2.49 0.1146 132 0.48 0.4901 132 0.42 0.5160 66 6518 83 2.46 0.1167 85 1.99 0.1583 132 0.15 0.7026 132 0.17 0.6763 67 6515 84 2.82 0.0931 86 2.90 0.0888 132 0.86 0.3547 132 0.84 0.3591 68 G72 6520 84 2.12 0.1457 86 2.20 0.1381 132 0.63 0.4256 132 0.71 0.4007
31
Table 9. Haplotype Association Analysis of SNPs 6554,6557,6568,6556 in RGS4 gene using Transmit v2.5.4
MPSS data TSLS data
Narrow Model(N=78) Broad Model (N=80) Narrow Model(N=131) Broad Model(N=131) Haplotype HF Chi P Chi P Haplotype HF Chi P Chi P 1.1.1.1 0.0456 0.00 0.9962 0.00 0.9746 1.1.1.1 0.0623 0.07 0.7849 0.18 0.6693 1.2.1.1 0.0605 3.15 0.0762 1.75 0.1854 1.2.1.1 0.0575 1.84 0.1749 1.84 0.1749 1.1.2.1 0.2794 1.44 0.2298 1.42 0.2342 1.1.2.1 0.3091 1.14 0.2854 1.14 0.2854 2.1.2.1 0.1506 1.21 0.2710 0.95 0.3286 2.1.2.1 0.1178 3.90 0.0484+ 3.90 0.0484+ 1.2.1.2 0.4463 0.03 0.8552 0.12 0.7308 1.2.1.2 0.4378 1.01 0.3156 0.89 0.3447 2.1.2.2 0.0175 0.65 0.4203 0.32 0.5694 1.1.2.2 0.0156 0.30 0.5821 0.30 0.5821
32
Table 10. Haplotype Association Analysis of SNPs 6624,6596,6597,6598,6595 in MRDS1 gene using Transmit
v2.5.4
MPSS data TSLS data
Narrow Model(N=84) Broad Model (N=86) Narrow Model(N=132) Broad Model(N=132) Haplotype HF Chi P Chi P Haplotype HF Chi P Chi P 1.1.1.1.1 0.5423 0.13 0.7222 0.25 0.6143 1.1.1.1.1 0.5111 0.15 0.7019 0.22 0.6396 2.1.1.1.1 0.0993 0.38 0.5402 0.20 0.6576 2.1.1.1.1 0.1126 0.52 0.4728 0.52 0.4701 1.2.1.1.1 0.0033 1.00 0.3180 1.00 0.3179 1.2.1.1.1 0.0068 3.08 0.0792 3.08 0.0792 2.2.1.1.1 0.1256 0.10 0.7565 0.13 0.7170 2.2.1.1.1 0.1157 0.10 0.7482 0.11 0.7448 1.1.2.1.1 0.0052 0.58 0.4446 0.58 0.4461 1.1.2.1.1 0.0040 0.94 0.3325 0.94 0.3327 2.1.2.1.1 0.0032 1.00 0.3165 1.00 0.3165 2.2.2.1.1 0.0401 1.24 0.2656 1.24 0.2647 2.2.2.1.1 0.0493 2.55 0.1105 1.56 0.2122 2.2.2.2.1 0.0059 0.26 0.6086 0.26 0.6091 2.2.2.2.1 0.0034 1.00 0.3166 1.00 0.3166 1.1.1.2.2 0.0020 1.00 0.3176 1.00 0.3176 1.1.1.1.2 0.0032 1.01 0.3159 0.99 0.3196 2.1.1.2.2 0.0020 0.99 0.3195 0.99 0.3195 1.2.1.1.2 0.0094 1.47 0.2252 1.49 0.2223 1.1.2.2.2 0.0080 0.22 0.6403 0.22 0.6409 2.1.1.2.2 0.0031 1.01 0.3160 1.01 0.3157 1.2.2.2.2 0.0025 0.14 0.7085 0.15 0.7029 1.1.2.2.2 0.0047 0.86 0.3543 0.86 0.3527 2.2.2.2.2 0.1893 0.85 0.3555 0.68 0.4098 2.2.2.2.2 0.1480 4.05 0.0442- 4.93 0.0264-
33
Table 11. Haplotype Association Analysis of SNPs in DTNBP1 gene using Transmit v2.5.4
MPSS data TSLS data
Narrow Model(N=78) Broad Model (N=79) Narrow Model(N=126) Broad Model(N=126) Haplotype HF Chi P Chi P Haplotype HF Chi P Chi P ( 6504, 6494, 6496 ) 1.1.1 0.4617 6.52 0.0106+ 5.45 0.0196+ 1.1.1 0.4410 0.20 0.6581 0.24 0.6263 1.2.1 0.0844 0.13 0.7223 0.07 0.7876 1.2.1 0.0721 1.52 0.2176 1.51 0.2188 2.2.1 0.2381 0.03 0.8641 0.16 0.6861 2.2.1 0.3063 0.10 0.7514 0.09 0.7591 1.1.2 0.1710 13.38 0.0003- 13.55 0.0002- 1.1.2 0.1755 0.12 0.7263 0.08 0.7745 1.2.2 0.0059 0.08 0.7772 0.01 0.9052 2.2.2 0.0051 1.13 0.2872 1.13 0.2871 2.2.2 0.0390 2.49 0.1146 2.47 0.1164 ( 6497, 6513, 6498, 6495 ) 1.1.1.1 0.8088 1.72 0.1895 2.29 0.1302 1.1.1.1 0.8975 1.30 0.2541 1.08 0.2988 1.2.1.1 0.0698 0.70 0.4013 0.42 0.5152 1.2.1.1 0.0094 0.00 0.9693 0.00 0.9693 1.1.2.1 0.0036 1.01 0.3159 1.01 0.3158 2.1.2.2 0.0232 7.48 0.0062- 7.48 0.0062- 2.1.2.2 0.1008 1.47 0.2250 2.01 0.1563 2.2.2.2 0.0698 0.15 0.6972 0.26 0.6114 2.2.2.2 0.0170 0.09 0.7596 0.08 0.7712
34
Table 12. Haplotype Association Analysis of SNPs 6563, 6584 in TNF-alpha gene using Transmit v2.5.4
Haplotype MPSS data TSLS data
Narrow
Model(N=163) Broad Model (N=177) Narrow Model(N=131) Broad Model(N=131) HF Chi P Chi P Haplotype HF Chi P Chi P 1.1 0.4718 3.97 0.0463- 4.18 0.0410- 1.1 0.3841 0.64 0.4247 0.64 0.4247 2.1 0.1200 3.03 0.0816 1.72 0.1901 2.1 0.1590 0.01 0.9146 0.01 0.9146 1.2 0.4006 0.56 0.4539 1.26 0.2613 1.2 0.4570 0.46 0.4970 0.46 0.4970 2.2 0.0076 0.98 0.3232 1.76 0.1842
35
Table 13. Haplotype Association Analysis of SNPs 6581,6575,6582 in NOTCH4 gene using Transmit v2.5.4
Haplotype MPSS data Haplotype TSLS data
Narrow Model(N=84) Broad Model (N=86) Model(N=132) Narrow Model(N=132) Broad HF Chi P Chi P HF Chi P Chi P 1.1.1 0.4720 0.34 0.5610 0.71 0.4001 1.1.1 0.4827 3.03 0.0817 3.27 0.0707 2.1.1 0.2201 0.85 0.3552 0.11 0.7409 2.1.1 0.2034 0.11 0.7380 0.25 0.6181 1.2.1 0.0036 0.88 0.3482 0.89 0.3455 2.2.1 0.1721 3.68 0.0550 3.31 0.0687 2.2.1 0.1706 0.00 0.9825 0.02 0.8969 1.1.2 0.1176 0.47 0.4921 0.47 0.4921 1.1.2 0.1131 3.35 0.0673 2.44 0.1182 2.1.2 0.0243 4.25 0.0393+ 4.25 0.0393+ 2.1.2 0.0205 0.08 0.7818 0.14 0.7041
36
Table 14. Haplotype Association Analysis of SNPs 6555,6560,6569,6561,6562 in PPP3CC gene using Transmit
v2.5.4
MPSS data TSLS data
Narrow
Model(N=80) Broad Model (N=82) Narrow Model(N=132) Broad Model(N=132) Haplotype HF Chi P Chi P Haplotype HF Chi P Chi P 1.1.1.1.1 0.5521 1.00 0.3179 0.83 0.3637 1.1.1.1.1 0.5283 0.45 0.5021 0.47 0.4910 1.1.2.1.1 0.0293 0.00 0.9543 0.01 0.9368 2.1.1.1.1 0.0023 0.95 0.3287 0.96 0.3284 1.1.1.2.1 0.0017 0.26 0.6068 0.26 0.6068 1.2.1.1.1 0.0011 0.02 0.8966 0.02 0.8966 2.1.1.2.1 0.0016 42.96 0.0000+ 42.60 0.0000+ 2.2.1.1.1 0.0009 0.02 0.8855 0.02 0.8855 1.1.2.2.1 0.0029 0.74 0.3882 0.75 0.3872 1.1.2.1.1 0.0518 1.03 0.3094 1.03 0.3111 2.1.2.2.1 0.0033 1.00 0.3167 1.00 0.3166 2.2.2.1.1 0.0020 0.95 0.3300 0.95 0.3299 2.2.2.2.1 0.0804 0.17 0.6765 0.26 0.6117 2.1.2.2.1 0.0039 0.15 0.7025 0.15 0.7031 1.1.2.2.2 0.0036 1.02 0.3129 1.02 0.3125 2.2.2.2.1 0.1079 0.75 0.3868 0.76 0.3836 2.2.2.2.2 0.3251 1.39 0.2378 1.37 0.2414 1.1.2.2.2 0.0020 1.00 0.3176 1.00 0.3176 2.2.2.2.2 0.2999 0.55 0.4589 0.59 0.4438
37
Table 15. Haplotype Association Analysis of SNPs 6524,6529,6530 in NRG1 gene using Transmit v2.5.4
MPSS data TSLS data
Narrow Model(N=83) Broad Model (N=85) Narrow Model(N=132) Model(N=132) Broad Haplotype HF Chi P Chi P Haplotype HF Chi P Chi P 1.1.1 0.5455 1.96 0.1613 0.84 0.3591 1.1.1 0.5744 0.00 0.9906 0.00 0.9906 2.1.1 0.0207 0.53 0.4683 0.55 0.4597 2.1.1 0.0253 0.00 0.9724 0.06 0.8118 2.2.1 0.0926 4.51 0.0337- 3.44 0.0638 2.2.1 0.0721 2.22 0.1367 2.22 0.1367 1.1.2 0.0034 1.01 0.3156 1.01 0.3152 1.1.2 0.0080 0.46 0.4993 0.46 0.4993 2.2.2 0.3378 0.47 0.4908 1.28 0.2574 2.2.2 0.3202 0.81 0.3674 0.67 0.4131
38
Table 16. Haplotype Association Analysis of SNPs 6521,6522,6519 in DAAO gene using Transmit v2.5.4
MPSS data TSLS data
Narrow Model(N=78) Broad Model (N=79) Narrow Model(N=120) Broad Model(N=120) Haplotype HF Chi P Chi P Haplotype HF Chi P Chi P 1.1.1 0.5831 0.07 0.7856 0.20 0.6571 1.1.1 0.4982 0.53 0.4650 0.55 0.4575 2.1.1 0.0042 1.01 0.3158 1.02 0.3120 2.1.1 0.0326 3.53 0.0603 3.54 0.0600 1.2.1 0.0025 0.49 0.4856 0.49 0.4856 1.2.1 0.0141 5.05 0.0246- 5.05 0.0247- 2.2.1 0.0391 0.26 0.6073 0.22 0.6393 2.2.1 0.0692 0.00 0.9741 0.00 0.9766 2.1.2 0.0567 0.93 0.3344 0.78 0.3761 1.1.2 0.0044 0.90 0.3426 0.90 0.3431 1.2.2 0.0078 1.78 0.1817 1.79 0.1814 2.1.2 0.0989 8.34 0.0039- 8.52 0.0035- 2.2.2 0.3067 0.00 0.9762 0.01 0.9026 1.2.2 0.0065 0.04 0.8364 0.04 0.8370 2.2.2 0.2761 8.06 0.0045+ 8.29 0.0040+
39
Table 17. Haplotype Association Analysis of SNPs 6506,6503,6510,6507 in G72 gene using Transmit v2.5.4
MPSS data TSLS data
Narrow Model(N=80) Broad Model (N=82) Narrow Model(N=115) Broad Model(N=115) Haplotype HF Chi P Chi P Haplotype HF Chi P Chi P 1.1.1.1 0.6269 1.81 0.1782 1.20 0.2725 1.1.1.1 0.6247 0.15 0.6976 0.11 0.7349 1.2.1.1 0.0033 1.00 0.3165 1.00 0.3165 2.1.1.1 0.0023 0.88 0.3490 0.88 0.3488 2.2.1.1 0.0033 1.00 0.3184 1.00 0.3185 1.1.1.2 0.0023 1.01 0.3160 1.01 0.3160 2.1.1.2 0.0033 1.00 0.3184 0.99 0.3198 2.2.2.2 0.3708 0.14 0.7075 0.11 0.7450 1.2.2.2 0.0068 1.99 0.1584 1.99 0.1579 2.2.2.2 0.3564 1.79 0.1810 1.32 0.2514
40 Projected Timeline & Brief Summary of Plans for Next Year
Next year is the third year of this POCOS, we’ll continue to work on the 7working domains as that of the second year in general. We’ll continue to do the fine mapping study using SNP genotyping on 3 other candidate chromosome regions of
8p21(D8S1222), 6P24-22(D6S 296)and 15q13-14(D15S976), using 3-step genotyping method developed by this POCOS project. We’ll do replication study of the initially located vulnerability genes by using big TSLS sample of 600 families. We’ll also search for polymorphism of identify candidate vulnerability genes for neurobiological and clinical study. Sub-classification of schizophrenia using clinical as well as
endophenotype variables will be done to help genetic analyses. Finally, we’ll write manuscripts for submission to the appropriate journal. In summary, we plan to
complete the fine SNP mapping on all 5 candidate chromosome regions proposed in the POCOS study. We may be able to reach the following conclusions: (1) We may be able to identify about 5 vulnerability candidate genes. (2) Multiple vulnerability genes are responsible for schizophrenic; (3) There are interactions among these vulnerability genes; (4) Schizophrenia is heterogeneous in clinical phenotype and it can be
sub-classified using meaningful clinical variables of age of onset, negative symptom, and indicators of CPT. (5) There may have specific vulnerability genes for each subtype of schizophrenia. Those results will be of value for further molecular genetic,
neurobiological and clinical studies on schizophrenia.
The propose Time line of the next year work will be as the following:
(1) May 1,2004~ April 30, 2005. Continuing data analysis on genotyping data, and continue paper writing for publication.
(2) May1,2004-Oct31, 2005; SNP genotyping work on 3 other candidate chromosome regions of 8P21(D8S1222), 6P24-22(D6S296), and 15q13-14(D15S976).
Management of DNA bank for DNA sample retrieval for laboratory work. (3) May 1, 2004-April 30, 2005: Polymorphism detection study on all positive
candidate vulnerability genes obtained in this POCOS.
(4) Oct.1, 2004-April 30, 2005: Analysis on gene-gene interaction in association study. We’ll proceed to study, the multiple gene-gene interaltion after identifying multiple vulnerability genes from POCOS. The interaction effect will be examined at the level of significance level of association , transmission effect, and at the level of clinical and endophenotype variables, especially at the level of sub-classification of sample
individual, and families , as well as the subtypes of schizophrenia .
(5) May1,2004-April,2005: Planning for further genetic studies on schizophrenia in the era of post-POCOS stage
(6) May 1, 2004-April, 2005: Continuing sample collection of serum, plasma, DNA, CPT, WCST if needed for laboratory work, especially for functional and/or clinical studies.
41
4. Personnel
Name In Chinese In English Position Title Education Degree % of personal effort on this project Job Description or Responsibilities胡海國 Hai-Gwo Hwu 主持人(PI) M.D. 30% Design and management of the whole project; supplementary data collection; data management
and paper writing; business management
劉智民 Chih-Min Liu 共同主持人
(Co-PI)
M.D. 30% Supplementary data collection; management of DNA, cell-line and family
42
5. Publications and/or Patents
6a. Publications
Appendix
1. Manuscripts submitted /prepared
(1) Liu YL , Liu CM, Fann CS-J , Wu J-Y, Hung SY, Chen WJ, Chen JH, Jon YS, Hwu HG ;Linkage of chromosome 1q42.1 with schizophrenia containing vulnerability genes of GNPAT and DISC1using SNP fine mapping.
(2) Liu YL, CM Liu, Hwu HG: An IL-6 Transcription factor recognition single nucleotide polymorphism located around the TATA box region of disrupted-in schizophrenia gene.
(3) Liu YL, CM Liu, Hwu HG: Construction of a positive probe for screening balanced translocation t(1;11)(q42.1;q14.3)causing disruption in a candidate gene for schizophrenia
(4) Hwu HG, Tsuang MT, Liu CM, Faraone S, Tsuang MM, Chen WJ, Liu SK, Shieh MH, Huang TC, and TSLS study group: Taiwan schizophrenia linkage study: Field Study.
2. Conference proceeding paper
(1) Hwu HG, Liu CM , Liu YL, Fann CSJ, Wu JY, Lin CY, Ou-Yang WC, Jann HY, and Chen JJ; Genetic variation in the 1q42.1 locus and susceptibility to
schizophrenia (Presented in XI ICOPS, Quebec, Canada, Oct, 2003; Neuropsychiatric Genetics, 122B;131-132,2003)
(2)Liu YL, Liu Cm, and Hwu HG; dhplc Analysis of the TATA BOX region of Disc1 Gene (Presented in XI ICOPS, Quebec, Canada, Oct, 2003; Neuropsychiatric Genetics, 122B;86-87,2003)
(3)Liu CM, Liu YL, Hwu HG, Fann CSJ, and Lin CY; Significant Association Evidences Between Polymorphisms of Prodh and Schizophrenia (Presented in XI ICOPS, Quebec, Canada, Oct, 2003; Neuropsychiatric Genetics,
122B;116-117,2003)
(4)Huang LC, Liu CM, and Hwu HG; Polymorphism of G308a Tumor Necrosis Factor Alpha Gene in Schizophrenia. ( Presented in XI ICOPS, Quebec, Canada, Oct, 2003; Neuropsychiatric Genetics, 122B;116-117,2003)
(5)Liu YL, Liu CM, and Hwu HG; Construction of A Positive Probe For Screening Balanced Translocation Candidate Gene for Schizophrenia.( Presented in XI ICOPS, Quebec, Canada, Oct, 2003; Neuropsychiatric Genetics, 122B; 81,2003)
(6)Hwu HG, Tsuang MT, Liu CM, Faraone S, Tsuang MM, Chen WJ, Liu SK, Shieh MH, Huang TC, and TSLS study group ; Taiwan schizophrenia Linkage Study; Field Study.( Presented in XI ICOPS, Quebec, Canada, Oct, 2003; Neuropsychiatric Genetics, 122B;84,2003)
43