台灣國家消費類電子品牌之價值 - 政大學術集成
43
0
0
全文
(2) 台灣國家消費類電子品牌之價值 VALUE OF THE “TAIWAN BRAND” IN CONSUMER ELECTRONICS. 研究生: 安彥伯. Student: Jan Jaap Braam. 指導教授:白德傑. Advisor: Glen Brodowsky. 國立政治大學 商學院國際經營管理英語碩士學位學程. 學. ‧ 國. 立. 治 政 碩士論文 大 A Thesis. ‧. Submitted to International MBA Program. io. n. al. for the degree of. sit. in fulfillment of the Requirements. er. Nat. y. National Chengchi University. Ch. i Un. Master. e n g c hini. v. Business Administration. 中華民國一〇一年十二月 December 2012.
(3) ACKNOWLEDGEMENT This dissertation would not have been possible without the guidance and help of my advisor Professor Glen Brodowsky, who even though living in a time zone 9 hours away has always been available for me with guidance and input. I would also like to extend my gratitude to Li-chi Ho, who as this Executive secretary of the IMBA program has been extremely helpful to me before and during my thesis. Lastly I would like to thank all my classmates and other people who shared their ideas and opinions on the thesis topic with me.. 立. 政 治 大. ‧. ‧ 國. 學. n. er. io. sit. y. Nat. al. Ch. engchi. i Un. v. i.
(4) Abstract. VALUE OF THE “TAIWAN BRAND” IN CONSUMER ELECTRONICS By Jan Jaap Braam Taiwan has had a strong OEM electronics industry for over 20 years now, but in a time of narrowing profit margins Taiwan has been trying to move to a more OBM oriented strategy. In this study I have shown that even though Taiwan has been able to create several globally. 政 治 大. recognizable and –in the eyes of consumers- high quality consumer electronics brands its. 立. worldwide image as a country has not improved among consumers. Taiwanese products are. ‧ 國. 學. viewed as being only slightly superior to Chinese brands. This means that new and established Taiwanese brands don’t have the advantage that Japanese brands have just by coming from a. ‧. country with a good reputation. Consumers in Europe and North America have less. sit. y. Nat. knowledge of the country of origin when it comes to Taiwanese brands compared to Japanese. io. er. and Korean brands. Because of the bad reputation of Taiwanese products brands are hesitant to associate themselves with Taiwan creation a vicious circle. Taiwan’s rival Korea however. n. al. Ch. i Un. v. has been making progress, it’s brands are more recognizable as Korean and the image of. engchi. Korean products is also better even though the individual brands are not necessarily rated more favourably by consumers. It’s not recommended for individual Taiwanese brand owners to associate itself with the country as this would in most cases negatively affect its brand value. It’s also found that Chinese, Korean and Taiwanese brands with a high perceived quality are often mistaken as Japanese. It may therefore be helpful to for Asian brands to try to associate themselves more with Japan or East-Asia in general. As for improving the country image of Taiwan, the Taiwanese government should redouble its efforts to improve the country’s image to a level it deserves according to the technological advances made in Taiwan in the past decades. ii.
(5) TABLE OF CONTENTS. 1. Introduction ............................................................................................................................ 1 1.1 Japan’s and others country image transformation ........................................................ 1 1.2 Purpose and importance of study ................................................................................. 1 1.3 Literature review........................................................................................................... 2 2 Methodology............................................................................................................................ 6 2.1 Research design ............................................................................................................ 6 2.2 Data collection .............................................................................................................. 6. 政 治 大. 2.3 Measurement scales ...................................................................................................... 7. 立. 3. Results .................................................................................................................................... 9. ‧ 國. 學. 3.1 Overall results quality perception ................................................................................. 9. ‧. 3.1.1 Japan ................................................................................................................ 11. sit. y. Nat. 3.1.2 Korea ............................................................................................................... 11. n. al. er. io. 3.1.3 Taiwan ............................................................................................................. 12. i Un. v. 3.1.4 China................................................................................................................ 12. Ch. engchi. 3.2 Country of Origin Recognition ................................................................................... 13 3.3 Country of Origin Recognition & Perceived quality .................................................. 14 3.4 European vs. American views .................................................................................... 16 3.5 Differences across age groups. ................................................................................... 18 4. Discussion and conclusions .................................................................................................. 19 5. Bibliography ......................................................................................................................... 22 6. Appendices: .......................................................................................................................... 28 iii.
(6) LIST OF FIGURES AND TABLES. Table 1: 13 item semantic-differential scale Used for questionnaire ....................................... 7 Table 2: The 11 brands used in survey..................................................................................... 8 Table 3: overview of the 12 significant variables .................................................................. 10 Table 4: perceived total quality ratings per brand .................................................................. 15 Table 5: European vs north american views - significant diferences in bold ........................ 17. 政 治 大. Table 6: European vs north american views - detailed results ............................................... 31. 立. ‧. ‧ 國. 學. Table 7: Brand ratings vs coo knowledge - detailed results................................................... 32. sit. y. Nat. Figure 1: Average COO recognition rate per coutry .............................................................. 13. n. al. er. io. Figure 2: Total quality - European vs north american view................................................... 16. Ch. i Un. v. Figure 3: Differences across age groups ................................................................................ 18. engchi. Figure 4: Results 13 items by country.................................................................................... 29 Figure 5: Country recognition rate vs perceived to be japanese ............................................ 30. iv.
(7) 1. INTRODUCTION Taiwan is competing in changing world where margins for OEM (Original Equipment Manufacturer) companies are ever thinning and successful OBM (Original Brand Manufacturers) see profits reach heights never seen before. Many larger Taiwanese companies are making the move from OEM to OBM and have started building brands. However, it seems that many consumers still associate Taiwan with the low-cost labour country it was 20 years. 政 治 大 origin is an important information cue for consumers when making purchase decisions. 立. ago. This causes a problem for Taiwanese based OBM companies since a brand’s country of. ‧ 國. 學. 1.1 JAPAN’S AND OTHERS COUNTRY IMAGE TRANSFORMATION. ‧. Historically Japan has made a successful change from a country with a cheap and low quality image to an image of high quality and technological excellence. Recently Samsung and LG. y. Nat. er. io. sit. have made big strides and have in the process improved the image of the country as a whole. Taiwan however, seems so remain stuck in the same low-cost category as China, even though. n. al. Ch. i Un. v. brand like Asus, Acer and HTC are an international success.. engchi. 1.2 PURPOSE AND IMPORTANCE OF STUDY The purpose of this study is to evaluate the current status and position of the Taiwan brand and help Taiwanese brand managers decide how to best use their country of origin. As China grows, Taiwan runs the risk of being overshadowed if it doesn’t differentiate itself from its large neighbour. Since consumer electronics is Taiwan’s main consumer product export category the main focus will be on this industry. This is also especially important because Taiwan now has major brand share in laptop and netbook computers (ASUS and ACER) as well as Smartphones 1.
(8) (HTC). Nonetheless, it is not clear whether any of these brands are clearly associated with Taiwan and whether such an association would enhance or diminish their position in the marketplace. Furthermore, it is not clear if the success of said brands increase the brand image of Taiwanese electronic brands in general which would give them an advantage entering the international market. As mentioned earlier, the importance of the brand image is becoming more important as Taiwan is moving towards a more OBM oriented economy. Since the country of origin is an. 政 治 大. important part of the brand image brand managers need to know the status of the. 立. made-in-Taiwan brand. Should they try to hide the brands Country of Origin because it will. ‧ 國. 學. have a negative effect on their brand equity or will emphasising the Country of Origin have a. ‧. positive effect on the brand image?. sit. y. Nat. 1.3 LITERATURE REVIEW. n. al. er. io. Decision making is painful (Pfister, 2003). To research all available information to come to a. i Un. v. purchasing decision would usually be too much work. Therefore, an individual will usually rely. Ch. engchi. on inferences to evaluate a product. Huber and McCann (1982) have shown how inferences such as previous experiences, brand and COO (country of origin) affect the consumer. COO has been a favourite and controversial research field in consumer behaviour, and many studies have reached opposite conclusions. Some (e.g., Agrawal & Kamakura, 1999; Ahmed & d'Astous, 2008; d'Astous & Ahmed, 1999; Laroche et al., 2002) conclude that COO has a significant influence on the choice of a product or service, while others (e.g., Ettenson et al., 1988; Liefeld, 1993, 2004; Lim and Darley, 1997; Lim et al., 1994) conclude that the influence 2.
(9) of COO is very weak. COO effect will vary in importance between product categories. For instance, some authors have shown the effect to be lower for low-involvement products than for high-involvement products (Ahmed et al., 2004). Many studies like the one by Bhaskaran & Sukumaran in 2007 have criticised current COO research for often using methodology that is not in tune with real life situations and lack managerial relevance. In such studies, subjects are often explicitly asked about the importance or given the COO cue when in reality they may not even paid attention to it.. 政 治 大 Several researchers have addressed how multinational production has made the issue of COO 立. ‧ 國. 學. more complex now that the country of production and design are often different (Brodowsky, 1998, 2004; Chao, 1992; Ettenson, 1993; Han & Terpstra, 1988; Johansson & Nebenzahl, 1986;. ‧. Maronick, 1995; Samiee, 1994; Tse & Gorn, 1993). Such studies become increasingly. sit. y. Nat. important since country of origin is no longer something a company is limited to as in a global. al. er. io. economy, they may choose to perform many activities along the value chain – from research. v. n. and development through branding – in any number of countries.. Ch. engchi. i Un. According to Pecotich and Ward (2007), brand becomes more important once consumers grow familiar with a product category and the brand becomes more salient than the country of manufacturing in consumers’ minds. A familiar brand is actually able to increase the perception of the COO with which consumers associate the brand, and even to neutralize the negative effect often linked to developing countries. For example, a Japanese branded product may benefit from a positive stereotype based upon Japan’s positive quality reputation even if the product is manufactured offshore in a low-labor cost developing country. So COO might be particularly important when the consumer knows particularly little about the product category 3.
(10) (Laroche et al., 2005; Josiassen et al., 2008). In absence product and brand knowledge COO suddenly becomes a much more important information queue. For electronic products the actual country of manufacturing is probably not important (d'Astous and Ahmed 1999). In research done by Liefeld (2004) 88.8% of consumer who just bought a product at an electronic store did not know the country of production and was also not interested in knowing it. For electronics it is therefore likely that consumers nowadays will infer most of the country of origin effects through the brand since this is where the design takes. 政 治 大. place. Consumers will usually talk about their Sony products being “Japanese” without a. 立. second thought about where the product is actually made. This is especially true as most. ‧ 國. 學. consumers know that the majority of branded electronic goods – regardless of the brand country. ‧. – are made in Chinese factories. sit. y. Nat. Pappu et al. (2005, 2007) , noted that country of COO brand (COB) is an important variable that. n. al. er. io. can affect the equity of a brand, assert that marketing managers operating in an international. i Un. v. context identify the country image and understand the importance of incorporating COO into their brand-equity measurement.. Ch. engchi. Brands from the same country share images and associations, country equity (Shimo, at al., 1993). Sony, Canon and Toshiba all benefit from the association that Japanese technology is innovative and high quality (Thakor and Kansanis, 1997). Even though country equity is often linked to a product category, Agarwal and Sikri (1996) found that it is transferable to other product categories.. 4.
(11) However, typically consumers don’t know the COO/COB (Samiee, 1994). When Samiee, Shimp and Sharma did a follow up study in 2005 he found brand recognition to be 35%. When comparing micro-wave brands Balabanis (2008) found an even lower brand recognition rate of just 22%. This means that brand managers, to a large extend, have the opportunity to link their brands to a country of their choosing. Many brand owners indeed deliberately try -- through foreign branding -- to associate their brand with a country with a strong image (Leclercet al., 1994) or disguise the brand origin when the country image is weak (Okechuku and Onyemah. 政 治 大. 1999). Zhuang, et al., (2008) showed that Chinese consumers had a more favourable opinion of. 立. brands when they erroneously thought they were foreign.. ‧. ‧ 國. 學. n. er. io. sit. y. Nat. al. Ch. engchi. i Un. v. 5.
(12) 2 METHODOLOGY 2.1 RESEARCH DESIGN In order to research the image of Taiwan and surrounding countries a cross sectional survey design was chosen. We did this so we could get a large representative sample of people describing how they perceive the image of different countries and brands. Since the North-America and Europe account for more than 50% of world consumption these areas were chosen to take our sample from.. 立. 政 治 大. Consumer electronics was chosen as product category because it is a major industry and source. ‧ 國. 學. of competition with large recognisable brands between the East-Asian countries. For decades. ‧. Japan seems to have a good image in this industry and now Taiwan, Korean and China are playing catch-up, especially Korea seems to have been making inroads with its two major. y. Nat. n. al. er. io. sit. brands Samsung and LG.. i Un. v. The brands used were selected by taking the three most common consumer electronic brands on. Ch. engchi. online shipping websites such as amazon.com, amazon.co.uk, bestbuy.com etc. for each country. For Korea only two brands were selected since no other representative brand could be found.. 2.2 DATA COLLECTION For data collection the online survey website Survey Monkey (www.surveymonkey.com) was used since this allowed to do research across countries efficiently. University students in the United States and The Netherlands were asked to fill out the survey and some also asked family 6.
(13) members and friends to do the same. While many marketing studies have been criticized for the use of student convenience samples, university students are an appropriate sample frame for studies of consumer electronics. University students are more likely than their parents to own and use the latest electronic technology – especially laptop computers and smartphones. 178 surveys (see Appendix 5 for a sample survey) were returned of which 168 were usable (some were also deemed to be doubles from the same person). Because the survey was handed to students primarily the sample is fairly young, mean age 28 years and median age 23 years.. 政 治 大. 13% did not report their age. Gender distribution was fairly even with 48% male, 44% female. 立. and 8% no response.. ‧ 國. 學. Respondents were equally divided between citizens from North America and Europe (45%,. ‧. 48%), 5% were Asian citizens and the remaining 2% did not answer this question. The. sit. y. Nat. European age group was slightly older with a median age of 25 vs. 22. The Male/Female ratio. er. io. was fairly consistent across the European and American groups.. n. a. l C 2.3 MEASUREMENT SCALES. hengchi. i Un. v. Respondents were asked to evaluate the quality of electronic products from each of the four countries (Taiwan, Korea, China, and Japan) using a 13 item semantic-differential scale. TABLE 1: 13 ITEM SEMANTIC-DIFFERENTIAL SCALE USED FOR QUESTIONNAIRE. - Unreliable/Reliable. - Pride of /No Pride of Ownership. - Low Service Cost/High Service Cost. - Unreasonably/Reasonably Priced. - Imitative/Innovative. - High Performance/Low Performance. - Common/Exclusive. - Conventional/Stylish. - Not Durable/Durable. - Careless/Careful Workmanship. - Costly to Run/Economical to Run. - For older/ younger people. - Low Quality /High Quality. 7.
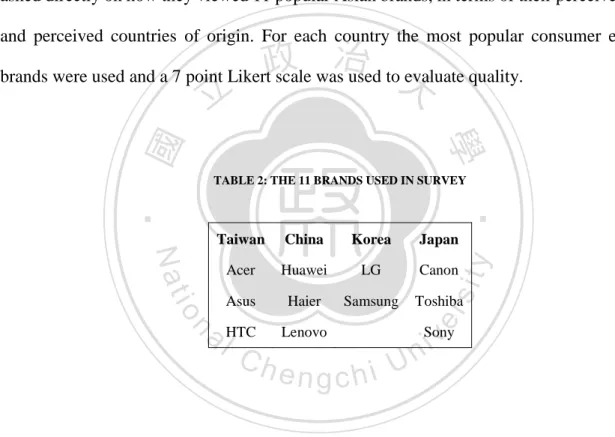
(14) These items were used in Johansson and Nebenzahl’s (1986) study and are a subset of a larger set of twenty items that Nagashima (1970, 1977) suggested might be affected by country-of-origin cues. This scale has been used because it has been tried and tested in many similar studies relating to country-of-origin based perceptions of quality. To get a more knowledge on views on brands coming from the area respondents were also asked directly on how they viewed 11 popular Asian brands, in terms of their perceived quality and perceived countries of origin. For each country the most popular consumer electronic. 政 治 大. brands were used and a 7 point Likert scale was used to evaluate quality.. 立. ‧ 國. 學 TABLE 2: THE 11 BRANDS USED IN SURVEY. ‧. Japan. Acer. Huawei. LG. Canon. Asus. Haier. Samsung. Toshiba. y. Korea. sit. io. China. er. Nat. Taiwan. n. Sony a lHTC Lenovo iv n Ch engchi U. 8.
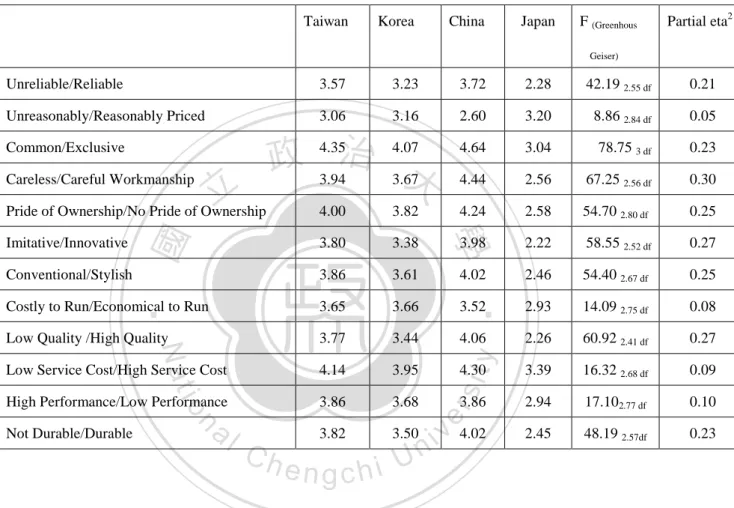
(15) 3. RESULTS 3.1 OVERALL RESULTS QUALITY PERCEPTION Respondents were asked to evaluate the quality of electronic products from each of the four countries (Taiwan, Korea, China, and Japan) using a 13 item semantic-differential scale. These items were used in Johansson and Nebenzahl’s (1986) study and are a subset of a larger set of twenty items that Nagashima (1971, 1977) suggested might be affected by country-of-origin. 政 治 大. cues. Mean values for twelve of the thirteen items for which significant differences were found,. 立. as evidenced by F statistics with p<.05) are listed in Table 3. No significant differences were. ‧ 國. 學. found for the thirteenth item, “For older people/For Younger People). It should be noted that each item was measured on a seven point differential scale. Lower values indicate stronger. ‧. agreement with the positive end of each scale. n. er. io. sit. y. Nat. al. Ch. engchi. i Un. v. 9.
(16) The results showed that there were some significant differences between the ratings of the four countries on the remaining twelve seven-point-semantic differential items. TABLE 3: OVERVIEW OF THE 12 SIGNIFICANT VARIABLES. Taiwan. Korea. China. Japan. F (Greenhous. Partial eta2. Geiser). Unreliable/Reliable. 3.57. 3.23. 3.72. 2.28. 42.19 2.55 df. 0.21. Unreasonably/Reasonably Priced. 3.06. 3.16. 2.60. 3.20. 8.86 2.84 df. 0.05. 4.64. 3.04. 78.75 3 df. 0.23. 4.44. 2.56. 67.25 2.56 df. 0.30. 治 4.07 政 4.35 大 3.94 3.67. Common/Exclusive Careless/Careful Workmanship. 4.24. 2.58. 54.70 2.80 df. 0.25. 3.80. 3.38. 3.98. 2.22. 58.55 2.52 df. 0.27. 3.86. 3.61. 4.02. 2.46. 54.40 2.67 df. 0.25. Costly to Run/Economical to Run. 3.65. 3.66. 3.52. 2.93. 14.09 2.75 df. 0.08. Low Quality /High Quality. 3.77. 3.44. 4.06. 2.26. 60.92 2.41 df. 0.27. Low Service Cost/High Service Cost. 4.14. 3.95. 4.30. 3.39. 16.32 2.68 df. 0.09. High Performance/Low Performance. 3.86. 3.68. 3.86. 2.94. 17.102.77 df. 0.10. al. 3.82. 3.50. v 4.02 i n. 2.45. 48.19 2.57df. 0.23. io. n. Ch. engchi U. y. Nat. Not Durable/Durable. sit. Conventional/Stylish. er. Imitative/Innovative. ‧ 國. 3.82. ‧. 4.00. 學. 立. Pride of Ownership/No Pride of Ownership. PASW 18 was used to compare respondents’ ratings each of 12 items across the four countries. The repeated measures model within the general linear model was used. Mauchly’s test of sphericity values were significant for 11 of the 12 items (excluding the item unreasonably/reasonably priced). Significance indicates a violation of the sphericity assumption of repeated-values ANOVA. The Greenhouse-Geiser F test was used to offset this violation, resulting in the fractional degrees of freedom for eleven of the items listed in the table. 10.
(17) The next step in the process was to identify which countries differed on the twelve items examined. This was accomplished using post-hoc bonferoni contrasts. These results are discussed on a country-by country basis. 3.1.1 J APAN The most immediate and striking finding from these contrast involve Japan. For eleven of the twelve items the ratings of Japan’s electronic products were significantly different – and superior to – the ratings of all three remaining countries. These items included; reliability,. 政 治 大. stylishness, cost of running, cost of service, performance, durability, exclusivity, pride of. 立. ownership, workmanship, and innovation. The remaining item – on which Japan was deemed. ‧ 國. 學. less desirable, was on price. China was rated as having the most reasonable prices. China’s. ‧. rating was significantly different from the ratings of Taiwan, Korea, and Japan on reasonable prices. However, there were no significant differences among the ratings of reasonable prices of. y. Nat. n. al. er. io. 3.1.2 KOREA. sit. Taiwan, Korea, and Japan.. Ch. engchi. i Un. v. While the Korean products were rated significantly lower than the Japanese products on all areas except price, the results show some strength for Korean products relative to their Chinese and Taiwanese competitors. Korean electronics were rated significantly higher than both Chinese and Taiwanese electronics on quality, durability, and innovation (p<.05). In terms of exclusivity, Korean electronics products were rated significantly more exclusive, reliable, and having better workmanship than Chinese electronics products (P<.05). The ratings of the reliability, pride of ownership, and workmanship of the Korean products were marginally significantly higher than those from Taiwan (p<.10). 11.
(18) The Korean products got significantly better ratings on service costs and stylishness than the Chinese (p<.05). However, there was no significant difference in the ratings of Korean and Taiwanese electronics on these dimensions. Finally, there were no significant differences among Korea, China, and Taiwan on ratings of performance, or the cost of running electronic products. 3.1.3 TAIWAN While ratings for Taiwan’s electronics were lower than the Japanese on all eleven dimensions. 政 治 大. besides price, Taiwanese electronics measured up favourably with the Korean products on. 立. stylishness and service costs. Further, the significance of the higher ratings of Korean products. ‧ 國. 學. only marginal in terms of stylishness and service costs.. ‧. While the Chinese products seem to have a significant price advantage over the Taiwanese (as. sit. y. Nat. well as Korea and Japan), the ratings of Taiwanese workmanship were significantly higher. n. al. er. io. (p<.05) than the Chinese. However, the ratings of Taiwanese electronics did not differ. i Un. v. significantly from the Chinese on the remaining ten dimensions including: reliability,. Ch. engchi. exclusivity, pride of ownership, innovation, style, costs to service or run, performance, durability, or quality. 3.1.4 CHINA While China enjoys a reputation for reasonable prices compared to the other three countries, it does not exceed the ratings of any of the others on any other dimensions. However, it is closely positioned to Taiwan on all other dimensions except for workmanship, and ratings equal the Koreans in terms of performance and cost to run. 12.
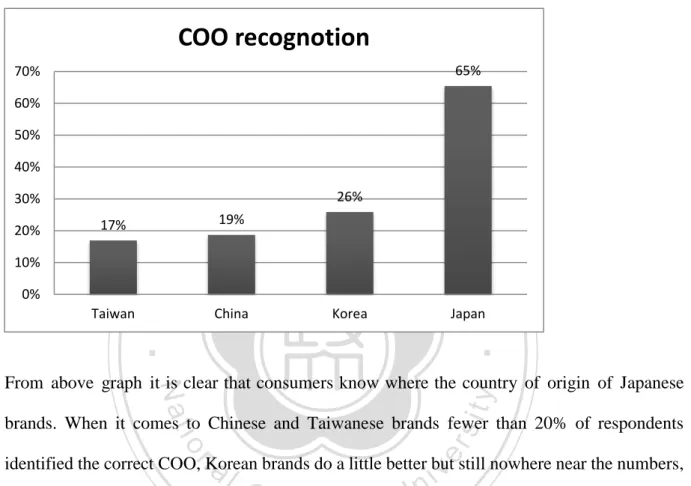
(19) 3.2 COUNTRY OF ORIGIN RECOGNITION FIGURE 1: AVERAGE COO RECOGNITION PER COUNTRY. COO recognotion 65%. 70% 60% 50% 40%. 19%. 26% 政 治 大. China. Korea. 30%. 0%. 學. 10%. 立. 17%. ‧ 國. 20%. Taiwan. Japan. ‧ sit. y. Nat. From above graph it is clear that consumers know where the country of origin of Japanese. io. al. er. brands. When it comes to Chinese and Taiwanese brands fewer than 20% of respondents. iv n C h e n gbrands but were less than half as likely as Japanese c h toi beUcorrectly identified with their country n. identified the correct COO, Korean brands do a little better but still nowhere near the numbers,. of origin. These results are consistent with an earlier study done by Balabanis (2008). In the graph in Appendix 2 you can see the Country recognition percentage per brand plus the proportion of participants who mistook the brand to be Japanese. When you look at this graph it is interesting to see that the Korean brands are often misclassified as being Japanese. This will influence the consumers’ quality perception of said brands positively. That is, being mistaken as Japanese indicates a positive, halo effect. For Taiwanese brands a similar thing can be said. 13.
(20) but it is not as pronounced compared to the Korean Brands. Chinese brands are rarely thought to be Japanese. The brand recognition statistics can also be said that it may be relatively easy for brands to “play” with their COO. Very few consumers know the actual COO, so the consumer perception can be easily manipulated to make them associate the brand with a different country and thus improving brand image.. 政 治 大. 3.3 COUNTRY OF ORIGIN RECOGNITION & PERCEIVED QUALITY. 立. In order to evaluate the effect of COO on the perceived quality of the different brands the means. ‧ 國. 學. were compared among three groups. Group one, the participant recognised the correct COO and was thus influenced by this factor when evaluating the quality. Group two, participant did. ‧. not correctly recognise the COO but was still influenced by the participants perception of given. y. Nat. al. er. io. country perception.. sit. country. Group three, participant had no idea of COO and was thus not influenced by any. n. iv n C The difference between group onehand two reflectsUthe difference in perception between engchi associating the brand with correct COO and associating it with an incorrect COO. The difference between the first two groups and group three can be seen as the impact of COO perception on perceived brand quality.. 14.
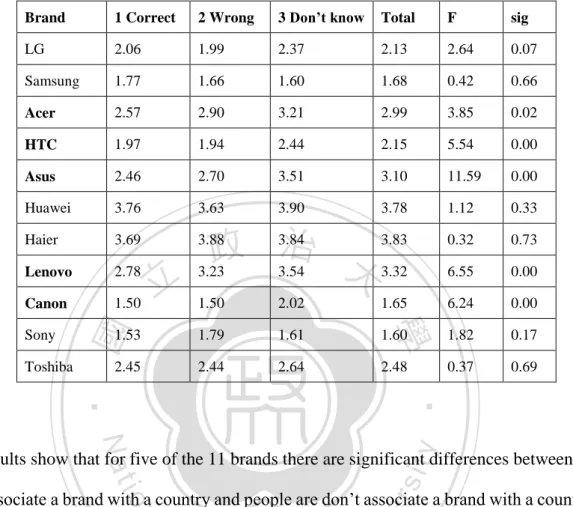
(21) TABLE 4: PERCEIVED TOTAL QUALITY RATINGS PER BRAND. Brand. 1 Correct. 2 Wrong. 3 Don’t know. Total. F. sig. LG. 2.06. 1.99. 2.37. 2.13. 2.64. 0.07. Samsung. 1.77. 1.66. 1.60. 1.68. 0.42. 0.66. Acer. 2.57. 2.90. 3.21. 2.99. 3.85. 0.02. HTC. 1.97. 1.94. 2.44. 2.15. 5.54. 0.00. Asus. 2.46. 2.70. 3.51. 3.10. 11.59. 0.00. Huawei. 3.76. 3.63. 3.90. 3.78. 1.12. 0.33. Haier. 3.69. 3.88. 0.32. 0.73. Lenovo. 2.78. 6.55. 0.00. Canon. 1.50. 1.50. 2.02. 1.65. 6.24. 0.00. 1.53. 1.79. 1.61. 1.60. 1.82. 0.17. 2.45. 2.44. 2.64. 2.48. 0.37. 0.69. ‧. ‧ 國. Toshiba. 立. 學. Sony. 3.84 3.83 治 政 大 3.32 3.23 3.54. y. Nat. io. sit. The results show that for five of the 11 brands there are significant differences between people. n. al. er. who associate a brand with a country and people are don’t associate a brand with a country. For. Ch. i Un. v. these five brands associating a brand with a country had a positive effect, no matter if the. engchi. perceived country was the correct country of origin or not. For the other six brands no significant differences could be found. This indicates that when consumers able to associate a brand with a country (correctly or incorrectly) they tend to have a more positive view of said brand, this result is similar to what Balabanis found in his study in 2008. No significant differences could be found for any of the brands when comparing group one and two. Because of a small N nothing can be said about any possible differences between North-Americans and Europeans. 15.
(22) 3.4 EUROPEAN VS. AMERICAN VIEWS FIGURE 2: TOTAL QUALITY - EUROPEAN VS NORTH-AMERICAN VIEWS. 2.0000 2.5000 3.0000 3.5000 4.0000. Taiwan. 3.7110. 3.7904. Korea. 3.6795. 3.4923. 4.1014. 3.6827. 3.0478. 2.7288. 5.0000. Japan. ‧. ‧ 國. China. 立. 學. Europe. 政 治 大 America. 4.5000. sit. y. Nat. On both the overall indicator “total quality” and “high quality” China scores significantly lower. io. al. er. with Europeans and among them is a clear number four. Americans on the other hand seem to. v. n. more clearly favour Japanese products which scores significantly higher without a clear number two.. Ch. engchi. i Un. 16.
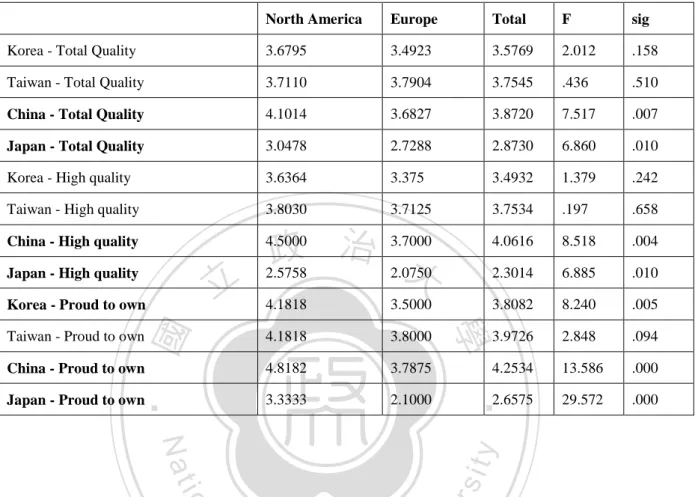
(23) TABLE 5: EUROPEAN VS NORTH AMERICAN VIEWS - SIGNIFICANT DIFERENCES IN BOLD. North America. Europe. Total. F. sig. Korea - Total Quality. 3.6795. 3.4923. 3.5769. 2.012. .158. Taiwan - Total Quality. 3.7110. 3.7904. 3.7545. .436. .510. China - Total Quality. 4.1014. 3.6827. 3.8720. 7.517. .007. Japan - Total Quality. 3.0478. 2.7288. 2.8730. 6.860. .010. Korea - High quality. 3.6364. 3.375. 3.4932. 1.379. .242. Taiwan - High quality. 3.8030. 3.7125. 3.7534. .197. .658. China - High quality. 4.5000. 4.0616. 8.518. .004. 2.3014. 6.885. .010. 3.8082. 8.240. .005. 3.9726. 2.848. .094. 4.2534. 13.586. .000. 29.572. .000. Japan - High quality. 立. 治 3.7000 政 大 2.5758 2.0750. Taiwan - Proud to own. 4.1818. 3.8000. China - Proud to own. 4.8182. 3.7875. Japan - Proud to own. 3.3333. 2.1000. ‧ 國. ‧. 3.5000. 學. 4.1818. Korea - Proud to own. 2.6575. er. io. sit. y. Nat. Looking further into the 13 individual measurements (see table above) the most striking. n. al. Ch. i Un. v. difference between Europeans and Americas shows up in the “proud to own” variable.. engchi. Americans feel significantly stronger about this than the Europeans with Japan a clear number one and the other countries trailing 1.5 points among Americans.. 17.
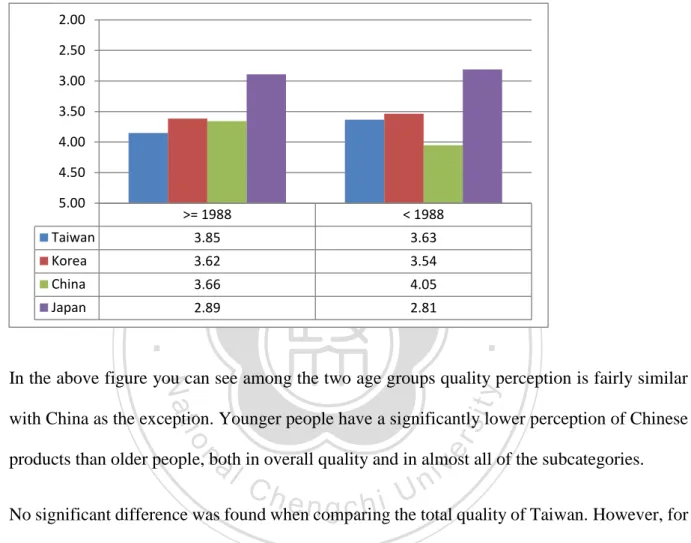
(24) 3.5 DIFFERENCES ACROSS AGE GROUPS. FIGURE 3: DIFFERENCES ACROSS AGE GROUPS. 2.00 2.50 3.00 3.50 4.00 4.50 5.00. >= 1988. 立. 政 治 大 < 1988 3.63. Korea. 3.62. 3.54. 3.66. 4.05. 2.89. 2.81. China Japan. ‧. ‧ 國. 3.85. 學. Taiwan. sit. y. Nat. In the above figure you can see among the two age groups quality perception is fairly similar. io. al. er. with China as the exception. Younger people have a significantly lower perception of Chinese. v. n. products than older people, both in overall quality and in almost all of the subcategories.. Ch. engchi. i Un. No significant difference was found when comparing the total quality of Taiwan. However, for the subcategories “reasonably priced” and “innovative” young people have a significantly better perception of Taiwanese products.. 18.
(25) 4. DISCUSSION AND CONCLUSIONS Japan has long been the king of electronics and this is once again confirmed in this study, Japan is a favourite among consumers by a large margin. The Japanese electronics giants Sony and Canon have brought the Japanese brand image to great heights. For the generations under 30 it seems like it has always been like this, but of course this is not the case. Before the 1970’s Japanese electronics still had an image comparable with that of Chinese products today.. 政 治 大 gains but the Korea country brand is still lagging behind. Korean products are often mislabelled 立 We now see that Korea is trying to follow Japans example. LG and Samsung are making great. ‧ 國. 學. as Japanese, which shows how much Japanese actually sounds like quality to consumers. We do see however see clear signs that Korea is making progress. Korean brands are seen. ‧. favourably by consumers and even though country recognition rate is only 26% which nowhere. y. sit. n. al. er. io. (19%).. Nat. near the 65% of Japanese brands. It is still doing much better than Taiwan (17%) and China. Ch. i Un. v. In Taiwan Korea is often seen as its big rival, when comparing the two countries it really. engchi. doesn’t look too good for Taiwan. Taiwan’s image is worse than Korea’s and only slightly better than China’s which means that all the innovation coming from Taiwan and its many brands has done little to improve its overall image. One of the reasons for this probably is the low recognition rate of Taiwanese brands, only 17% and the lowest out of the four countries. As one would expect China is viewed least favourable among consumers. However, the difference with Taiwan and Korea is only small when comparing it to the perceived quality difference with Japan. The three Chinese brands used in the survey do occupy the three bottom 19.
(26) spots when comparing total perceived quality which indicates that China’s biggest problem is it lack of respectable brands. But China is relatively new to the game and with a strong central government with cash to spare China is likely to improve rapidly over the next decade But does it all matter? Country recognition rates are very low for Korea, Taiwan and China. So even if the country image is low it would have little effect on its brands. Currently this is probably largely true. However, the Country of Origin can have a significant positive impact on brand value when used properly by marketing managers. We don’t have to look far to see. 政 治 大. Japanese brands using their positive brand image in their branding by showing of Japanese. 立. characters. German car companies have recently also been emphasising their German origin by. ‧ 國. 學. using the German language in their advertising.. ‧. As mentioned earlier Korea currently has an edge over Taiwan. However, it’s not too late for. sit. y. Nat. Taiwan to turn improve and follow Korea’s lead. Taiwan has got some good brands, especially. n. al. er. io. in consumer electronics, hardware and software and constantly creating new ones with a very. i Un. v. entrepreneurial population. This unlike Korea, which is leaning on fewer (but big) brands. But. Ch. engchi. the Korean government gives much stronger support to the big firms. The Taiwanese government has been trying to improve the country’s image for a long time. In 2002 it launched a program to help build brands and to concentrate on cutting-edge technologies through Challenge 2008. The programme called for an increase in total R&D spending from just over 2% of GDP to 3% within six years. It has also launched several campaigns to improve Taiwan’s overall image. But although many brands have enjoyed an increased worldwide popularity, the country image still hasn’t improved much. 20.
(27) According to the results of this study the current strategy of most Taiwanese consumer electronics companies to not associate itself with Taiwan is a good one. As European and American consumers don’t see Taiwanese products as being of high quality it would in general not be a good strategy to associate oneself with Taiwan. This is why Taiwanese brands often try to associate themselves with Android, Google, Microsoft and other internationally renowned brands. There are however some subgroups of consumers who do see Taiwanese electronics as high quality. This might for instance be true for early adaptors since they are more in tune with. 政 治 大. tech news and see Taiwan as an innovative nation.. 立. Brands which are often mistaken as being Japanese are being perceived to be better quality.. ‧ 國. 學. Taiwanese brands could therefor try to associate themselves with Japan. They could do this by. ‧. acquiring or going into joint-ventures with Japanese brands. But Taiwanese brands could also try to associate themselves with the image Japan has around the world, Asian design and highly. y. Nat. n. al. er. io. sit. technologically advanced.. Ch. engchi. i Un. v. 21.
(28) 5. BIBLIOGRAPHY Agrawal, J., and W.A. Kamakura. "Country of origin: A competitive advantage." International Journal of Research in Marketing Vol 16, no. 4 (1999): pp. 255-267. Agarwal, S., and S. Sikri. "Country image: consumer evaluation of product category extensions." International Marketing Review Vol. 13, no. 4 (1996): pp. 23-39. Ahmed, S., and A. d'Astous. "Antecedents, Moderators and Dimensions of Country-of-Origin. 政 治 大. Evaluation." International Marketing Review Vol 25, no. 1 (2008): pp. 75-106.. 立. Ahmed, S.A., and A. d'Astous. "Country of origin and brand effects: a multi-dimensional and. ‧ 國. 學. multi-attribute study." Journal of International Consumer Marketing Vol 19, no. 2. ‧. (1996): p. 93.. Nat. sit. y. Ahmed, Z.U., J.P. Johnson, Y. Xia, and K.H. Chen. "Does country of origin matter for. al. n. pp.102 - 120.. er. io. low-involvement products?." International Marketing Review Vol. 21, no. 1 (2004):. Ch. engchi. i Un. v. D’Astous, A., and S.A. Ahmed. "The Importance of Country Images in the Formation of Consumer Product Perceptions." International Marketing Review Vol 16, no. 2 (1999): pp. 108-125. Balabanis, G., and A. Diamantopoulos. "Brand Origin Identiﬕ cation by Consumers: A Classiﬕ cation Perspective." Journal of International Marketing Vol. 16, no. 1 (2008): pp. 39-71.. 22.
(29) Bhaskaran , S, and N Sukumaran. "National culture, business culture and management practices:. consequential. relationships?.". Cross. Cultural. Management:. An. International Journal Vol. 14, no. 1 (2007): pp. 54-67. Brodowsky, G.H.. "he effects of country of design and country of assembly on evaluative beliefs and attitudes toward buying them: A comparison between low and high ethnocentric consumers." Journal of International consumer Marketing Vol. 10, no. 3 (1998): pp. 85-113.. 政 治 大 Brodowsky, G.H., J. Tan, and O. Meilich. "Managing Country of Origin Choices: Competitive 立. ‧ 國. 學. Advantages and Opportunities." International Business Review Vol. 13, no. 6 (2004): pp. 729-748.. ‧. Chao, P.. "Partitioning country-of-origin effects: Consumer evaluations of a bi-national. y. Nat. al. er. io. sit. product." Journal of International Business Studies Vol. 24, no. 2 (1992): pp. 291-306. Ettenson, R., J. Wagner, and G. Gaeth. Evaluating the effect of country of origin and the. n. iv n C “made in the USA” campaign: approach." Journal of Retailing Vol 64 h e na conjoint gchi U (Spring) (1988): pp. 85-99.. Ettenson, R.. "Brand name and country of origin effects in the emerging market economies of Russia, Poland, and Hungary." International Marketing Review Vol 10, no. 5 (1993): pp. 14-36.. 23.
(30) Han, M.C., and V. Terpstra. "Country-of-origin effects for uni-national and bi-national products." Journal of International Business Studies Vol. 19, no. 2 (1988): pp. 235-254. Huber, J, and J McCann. "The impact of inferential beliefs on product evaluations." Journal of Marketing Research Vol 19 (1982): pp. 324-33. Johansson, J.K., and I.D. Nebenzahl. "Multinational Expansion: Effect on Brand Evaluations.". 政 治 大. Journal of International Business Studies Vol. 17 (Fall) (1986): pp. 101-26.. 立. Johansson, J.K., and I.D. Nebenzahl. "Multinational production effects on brand value.". ‧ 國. 學. International Business Studies Vol. 17, no. 3 (1986): pp. 101-126.. ‧. Josiassen, A., and A. Harzing. "Descending from the ivory tower: Reflections on the relevance. sit. y. Nat. and future of Country-of-Origin Research." European Management Review Vol. 5. io. n. al. er. (2008): pp. 264-270.. i Un. v. Laroche, M., J. Bergeron, M. Tomiul, and G. Barbaro-Forleo. "Cultural differences in environmental. Ch. engchi. knowledge, attitudes and behaviours of Canadian consumers.". Canadian Journal of Administrative Sciences Vol 19, no. 3 (2002): pp. 268-283. Laroche, M., Z. Yang, and G.H.G. McDougall. "Jasmin Bergeron Internet Versus Bricks-and-Mortar. Retailers:. An. Investigation. into. Intangibility. and. Its. Consequences." Journal of Retailing Vol. 81, no. 4 (2005): pp. 251-267.. 24.
(31) Leclerc, F., B.H. Schmitt, and L. Dube. "Foreign Branding and Its Effects on Product Perceptions and Attitudes." Journal of Marketing Research Vol. 31 (May) (1994): pp. 263-70. Liefeld, J.P.. "Consumer knowledge and use of country-of-origin information at the point of purchase." Journal of Consumer Behaviour Vol 4, no. 2 (2004): pp. 85-96. Lim, J.S., W.K. Darley, and J.O. Summers. "An assessment of country of origin effects under. 政 治 大. alternative presentation formats." Journal of the Academy of Marketing Science Vol.. 立. 22 (1994): pp. 274-82.. ‧ 國. 學. Lim, J.S., and W.K. Darley. "An assessment of demand artefacts in country-of-origin studies using three alternatives." International Marketing Review Vol. 14, no. 4 (1997): pp.. ‧. 201-17.. sit. y. Nat. io. al. er. Maronick, T.J.. "An empirical investigation of consumer perceptions of “made-in USA”. n. claims." International Marketing Review Vol. 12, no. 3 (1995): pp. 38-52.. Ch. engchi. i Un. v. Nagashima, A.. "A Comparison of U.S. and Japanese Attitudes Toward Foreign Products." Journal of Marketing Vol. 24 (January) (1970): pp. 68-74. Nagashima, A.. "A Comparative 'Made In' Product Image Survey Among Japanese Businessmen." Journal of Marketing Vol. 41 (July) (1977): pp. 95-100. Okechuku, C., and V. Onyemah. "Nigerian Consumer Attitudes Toward Foreign and Domestic Products." Journal of International Business Studies Vol. 30 (1999): pp. 611-622.. 25.
(32) Pappu, R., P.G. Quester, and R.W. Cooksey. "Consumer based brand equity: improving the measurement - empirical evidence." Journal of Product and Brand Management Vol. 14, no. 3 (2005): pp. 143-154. Pappu, R., P.G. Quester, and R.W. Cooksey. "Country image and consumer-based brand equity: relationships and implications for international marketing." Journal of International Business Studies Vol. 38 (2007): pp. 726-45.. 政 治 大 evaluation." International Marketing Review Vol. 24, no. 3 (2007): pp.271-296. 立. Pecotich, A., and S. Ward. "Global branding, country of origin and expertise: An experimental. ‧ 國. 學. Pfister, R.H.. "Decision making is painful- we knew it all along." Journal of Behavioral Decision Making Vol 16, no. 1 (2003): p. 73.. ‧. io. n. al. er. Business Studies Vol. 25, no. 3 (1994): pp. 579-604.. sit. y. Nat. Samiee, S.. "Customer evaluations of products in a global market." Journal of International. i Un. v. Samiee, S., T.A. Shimp, and S. Sharma. “Brand Origin Recognition Accuracy: Its Antecedents. Ch. engchi. and Consumers’ Cognitive Limitations." Journal of International Business Studies Vol. 36, no. 4 (2005): pp. 379-97. Shimp, T.A., S. Samiee, and T.J. Madden. "Countries and Their Products: A Cognitive Structure Perspective." Journal of the Academy of Marketing Science Vol. 21, no. 4 (1993): pp. 323-330.. 26.
(33) Thakor, M.V., and L.P. Katsanis. "A Model of Brand and Country Effects on Quality Dimensions: Issues and Implications." Journal of International consumer Marketing Vol. 9, no. 3 (1997): pp. 79-100. Tse, D.K., and G. Gorn. "An experiment on the salience of country of origin in an era of global brands." Journal of International Marketing Vol. 1, no. 1 (1993): pp. 57-76. Zhuang, G., X. Wang, L. Zhou, and N. Zhou. "'Asymmetric effects of brand origin confusion. 政 治 大 25, no. 4 (2008): pp. 441-457. 立. Evidence from the emerging market of China." International Marketing Review Vol.. ‧. ‧ 國. 學. n. er. io. sit. y. Nat. al. Ch. engchi. i Un. v. 27.
(34) 6. APPENDICES :. 立. 政 治 大. ‧. ‧ 國. 學. n. er. io. sit. y. Nat. al. Ch. engchi. i Un. v. 28.
(35) FIGURE 4: RESULTS 13 ITEMS BY COUNTRY. Appendix 1: 2. 政 治 大. 2.5. 立 3.5. sit. n. al. er. io. 4.5. y. Nat. 4. ‧. ‧ 國. 學. 3. 5. Ch. engchi. Careful Pride of Exclusive Workmansh Innovative Ownership ip. i n U. v. High Economical Low Service High Quality Performanc to Run Cost e. Reliable. Reasonably Priced. Taiwan. 3.57. 3.06. 4.35. 3.94. 4. 3.8. 3.86. 3.65. 3.77. 4.14. 3.86. 3.82. Korea. 3.23. 3.16. 4.07. 3.67. 3.82. 3.38. 3.61. 3.66. 3.44. 3.95. 3.68. 3.5. China. 3.72. 2.6. 4.64. 4.44. 4.24. 3.98. 4.02. 3.52. 4.06. 4.3. 3.86. 4.02. Japan. 2.28. 3.2. 3.04. 2.56. 2.58. 2.22. 2.46. 2.93. 2.26. 3.39. 2.94. 2.45. Stylish. Durable. 29.
(36) FIGURE 5: COUNTRY RECOGNITION RATE VS PERCEIVED TO BE JAPANESE. Appendix 2: 80%. 政 治 大. 70%. 立. 60%. 40%. ‧. ‧ 國. 學. 50%. n. al. er. io. sit. y. Nat. 30%. 20%. Ch. 10%. engchi. i n U. v. 17%15%. 14%14%. 17%13%. 15% 6%. 15%10%. 22% 5%. 21%21%. 31%32%. 44%. 62%. 69%. Taiwan. Taiwan. Taiwan. China. China. China. Korea. Korea. Japan. Japan. Japan. HTC. Asus. Acer. Huawei. Haier. Lenovo. LG. Samsung. Canon. Toshiba. Sony. 0%. Correct CoO. Japan. 30.
(37) Appendix 3: TABLE 6: EUROPEAN VS NORTH AMERICAN VIEWS - DETAILED RESULTS. Korea - Total Quality. Taiwan - Total Quality. China - Total Quality. Japan - Total Quality. Korea High quality. North America. Europe. Total. F. sig. M. 3.6795. 3.4923. 3.5769. 2.012. .158. SD. .80129. .78729. .79640. M. 3.7110. 3.7904. 3.7545. .436. .510. SD. .80565. .64822. .72213. M. 4.1014. 3.6827. 3.8720. 7.517. .007. SD. .88369. .94603. .93883. M. 3.0478. 2.7288. 2.8730. 6.860. .010. SD. .75245. 1.379. .242. .197. .658. 8.518. .004. 6.885. .010. 8.240. .005. M. 1.35362. 1.34034. M. 3.8030. 3.7125. 3.7534. SD. 1.29163. 1.17132. 1.22368. M. 4.5000. 3.7000. 4.0616. SD. 1.70294. 1.60221. 1.69063. Japan High quality. M. 2.5758. 2.0750. 2.3014. SD. 1.38187. .91090. 1.17073. M. 4.1818. 3.5000. 3.8082. aSDl. 1.45612. iv n C M 4.1818 h e n g c h3.8000 i U 3.9726 SD 1.47710 1.25688 1.36935. 2.848. .094. M. 4.8182. 3.7875. 4.2534. 13.586. .000. SD. 1.72679. 1.64350. 1.75307. M. 3.3333. 2.1000. 2.6575. 29.572. .000. SD. 1.71270. .98854. 1.49223. io. n Taiwan - Proud to own. China - Proud to own. Japan - Proud to own. 1.40523. y. sit. Nat. Korea - Proud to own. ‧. China High quality. er. Taiwan High quality. 學. 1.3201. ‧ 國. 立SD. 政 治.71524大 .74692 3.6364 3.375 3.4932. 1.46365. 31.
(38) Appendix 4: TABLE 7: BRAND RATINGS VS COO KNOWLEDGE - DETAILED RESULTS. 3 Don’t know. Total. F. sig. M. 2.06. 1.99. 2.37. 2.13. 2.64. 0.07. SD. 1.06. 0.91. 0.98. 0.97. M. 1.77. 1.66. 1.60. 1.68. 0.42. 0.66. SD. 0.90. 0.83. 0.82. 0.85. M. 2.57. 2.90. 3.21. 2.99. 3.85. 0.02. SD. 1.07. 1.30. HTC. M. 1.97. 5.54. 0.00. SD. 0.91. Asus. M. 2.46. Huawei. M. Haier. M SD. Lenovo. Toshiba. 3.10. 1.47. 1.37. 1.00. 3.76. 3.63. 3.90. 3.78. 1.09. 1.13. 1.03. 1.08. 3.69. 3.88. 3.84. 3.83. 1.19. 1.00. 0.89. 0.97. 2.78. 3.23. 3.54. 1.31. 0.99. SD. 1.18. M. 1.50. SD. 0.71. M. 1.53. SD. al. n. Sony. 3.51. io. Canon. M. 2.70. 立. 2.15 0.96. 11.59 0.00. 1.27. ‧. SD. 1.12. 學. SD. 0.94 治 政 2.44 大 1.94 0.91 0.98. 1.12. 0.33. 0.32. 0.73. 6.55. 0.00. 6.24. 0.00. 1.82. 0.17. 0.37. 0.69. y. Acer. 3.32. er. Samsung. ‧ 國. LG. sit. 2 Wrong. Nat. 1 Correct. Brand. i 2.02 n C1.50 U h e n g c1.16 0.72 hi. v. 1.13 1.65 0.89. 1.79. 1.61. 1.60. 0.70. 0.73. 0.61. 0.70. M. 2.45. 2.44. 2.64. 2.48. SD. 1.07. 0.97. 1.04. 1.04. 32.
(39) Appendix 5: Questionnaire. 立. 政 治 大. ‧. ‧ 國. 學. n. er. io. sit. y. Nat. al. Ch. engchi. i Un. v. 33.
(40) 立. 政 治 大. ‧. ‧ 國. 學. n. er. io. sit. y. Nat. al. Ch. engchi. i Un. v. 34.
(41) 立. 政 治 大. ‧. ‧ 國. 學. n. er. io. sit. y. Nat. al. Ch. engchi. i Un. v. 35.
(42) 立. 政 治 大. ‧. ‧ 國. 學. n. er. io. sit. y. Nat. al. Ch. engchi. i Un. v. 36.
(43) 立. 政 治 大. ‧. ‧ 國. 學. n. er. io. sit. y. Nat. al. Ch. engchi. i Un. v. 37.
(44)
數據
+7


相關文件
Now, nearly all of the current flows through wire S since it has a much lower resistance than the light bulb. The light bulb does not glow because the current flowing through it
To explore different e-learning resources and strategies that can be used to successfully develop the language skills of students with special educational needs in the
• A simple look at a website can reveal many potential web accessibility issues for persons with disabilities. Can the content be
contributions to the nearby pixels and writes the final floating point image to a file on disk the final floating-point image to a file on disk. • Tone mapping operations can be
Biases in Pricing Continuously Monitored Options with Monte Carlo (continued).. • If all of the sampled prices are below the barrier, this sample path pays max(S(t n ) −
“ Consumer choice behavior in online and traditional supermarkets: the effects of brand name, price, and other search attributes”, International Journal of Research in Marketing,
As a result banks should be so proactive as if they are doing the marketing job to make their employees feel the importance of internal marketing, who can only in
and Kasper, H.D.P., “The impact of Satisfaction on Brand Loyalty: Urging on Classifying Satisfaction and Brand Loyalty,” Journal of Consumer Satisfaction, Dissatisfaction
