Contents lists available atScienceDirect
Engineering Structures
journal homepage:www.elsevier.com/locate/engstructSubassemblage tests and finite element analyses of sandwiched
buckling-restrained braces
Chung-Che Chou
a,b,∗, Sheng-Yang Chen
c aDepartment of Civil Engineering, National Taiwan University, Taipei, Taiwan bNational Center for Research on Earthquake Engineering, TaiwancDepartment of Civil Engineering, National Chiao Tung University, Hsinchu, Taiwan
a r t i c l e i n f o Article history:
Received 29 December 2008 Received in revised form 6 March 2010 Accepted 9 March 2010 Available online 13 April 2010 Keywords:
Buckling-restrained brace Chanel
Bolt Cyclic test
Finite element analysis
a b s t r a c t
This study presents the experimental and finite element analysis results of a proposed steel buckling-restrained brace (BRB). The proposed BRB has two components: (1) a steel core plate that carries all axial forces during tension and compression, and (2) two identical restraining members that sandwich the core plate with fully tensioned high-strength A490 bolts to prevent core buckling. Instead of using unbonded material, a small air gap is provided between the core plate and the restraining members to allow for lateral expansion of the core plate under compression. Since two restraining members can be disassembled easily by removing the bolts, a damaged steel core can be replaced after a large earthquake. Thus, manufacturing new restraining members is not required. Four BRB subassemblages were tested to investigate the inelastic deformation capabilities and verify the stability predictions for the braces. Test results indicate that three BRBs with sufficient flexural rigidity of the restraining member develop (1) stable hysteretic responses up to core axial strains of 2.1%–2.6%, (2) maximum compressive loads of 1724–1951 kN (1.4–1.6 times the actual yield load), and (3) a cumulative plastic ductility that is much higher than that specified in AISC seismic provisions (2005). One BRB, intentionally designed with inadequate flexural rigidity of the restraining member, experienced global buckling as predicted. Nonlinear finite element analysis was conducted for each BRB for a correlation study. The objective of the analysis was to conduct a parametric study for different BRBs to further verify the effects of restraining member size, number of bolts, core plate length and cross-sectional area on buckling load evaluation. The design procedure for the sandwiched BRB was provided based on test and finite element analysis results.
© 2010 Elsevier Ltd. All rights reserved.
1. Introduction
Buckling-restrained braced frames (BRBFs) for seismic load re-sistance have been increasingly used in recent years [1–3]. A BRBF differs from a conventionally braced frame because a buckling-restrained brace (BRB) yields under both tension and compression without significant buckling. Numerous tests have been applied to different BRBs [4–12]. A typical BRB has a steel core encased in a re-straining member consisting of a steel tube filled with concrete or mortar. A thin layer of an unbonded material is provided between the steel core and the surrounding concrete interface to eliminate force transfer and allow for lateral expansion of the steel core un-der compression [4–8,10–14]. Thus, the surrounding restraining member behaves as a continuous lateral bracing for the steel core. Such a BRB with an unbonded material as an interface to prevent
∗Corresponding author at: Department of Civil Engineering, National Taiwan
University, Taipei, Taiwan. Tel.: +886 2 3366 4349; fax: +886 2 2739 6752. E-mail address:[email protected](C.-C. Chou).
adherence between the steel core and concrete has problems asso-ciated with quality control during manufacturing and flexibility at both ends of the BRB [10].
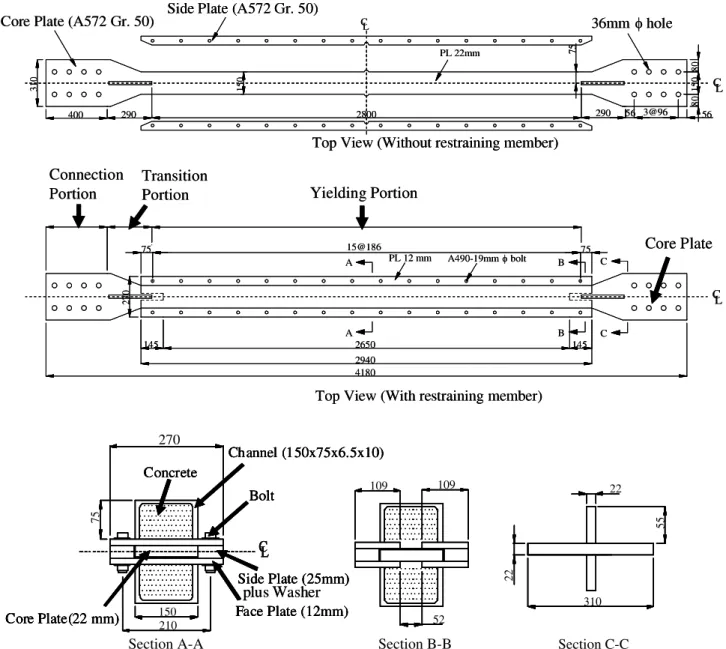
This study proposes a sandwiched BRB (Fig. 1) that eliminates the use of unbonded material in the manufacturing process and increases the number of design alternatives at both ends of the core plate for gusset connections. Two identical restraining members are formed by welding a steel channel to a flat plate (face plate) and then filled with concrete or mortar. Unlike conventional BRBs [4–10,12–14] that have a steel core inserted into a restraining member, sandwiching a core plate between a pair of restraining members using fully tensioned high-strength A490 bolts expedites the assembly process. Adding additional washers or a thin plate between the side plate and the face plate provides a small air gap between the core plate and face plate, allowing for expansion of the core plate under compression. There are two advantages to the proposed BRB over other conventional braces [4–10,12–14]. The first is the ability to disassemble the brace, which not only means that the core plate can be replaced independently of the restraining members, but also provides an opportunity for inspection of the
0141-0296/$ – see front matter©2010 Elsevier Ltd. All rights reserved. doi:10.1016/j.engstruct.2010.03.014
Section B-B
Section A-A
Fig. 1. Proposed buckling-restrained brace.
core. This is beneficial after a large earthquake or if used in an application such as a bridge superstructure [15] where high cycle fatigue is a concern. In case the core plate is damaged, replacing the core plate with recycle of restraining members of the proposed BRB is much cheaper than other conventional BRBs. The second is that in using conventional materials and providing a rational design basis, it opens up the opportunity for more widespread usage of BRBs, reducing the need for specialized design or fabrication. This, in the past, has limited the use of BRBFs unfairly over other poorer performing systems that require less performance verification. Furthermore, the core plate and restraining members can be delivered separately for on-site erection. A semi-circular tube may substitute for a rectangular channel to enhance architecturally appealing of the restraining member. A potential disadvantage of the proposed BRB is that it is slightly expensive with more parts (i.e. bolts) to assemble than some others in the first application.
Tests were conducted on four proposed BRBs designed with three performance parameters—moment of inertia of the restrain-ing member and number and spacrestrain-ing of bolts. The test program investigated (1) the deformation capability of the proposed BRBs based on AISC loading protocol [16], (2) whether buckling load of the BRB could be estimated based on the proposed methodology,
and (3) the effects of restraining member size and number of bolts on BRB cyclic behavior. Nonlinear finite element analysis was con-ducted for each BRB for correlation analysis. The objective of the analysis was (1) to conduct a parametric study of different BRBs to verify the effectiveness of the restraining member and num-ber of bolts in preventing steel core buckling, and (2) to study the effects of BRB length and cross-sectional area on buckling load variation. This work presents the behavior of the sandwiched BRB experimentally and analytically, and provides a design procedure for this BRB [17,18].
2. Buckling-restrained brace design
Global stability of the BRB is estimated using the Euler theory of buckling.Fig. 2(a) shows the schematic of the proposed BRB in compression; the bending moment at the center of the restraining member is Mcent
=
i+
g+
e 1−
PmaxP,g e Pmax,g (1)where i
(=
L/
1000)
is the initial imperfection at the center of the BRB, g is the gap between the core plate and restrainingmember, e is the eccentricity at the BRB end [9,11], Pe is the
Euler buckling load of the restraining member, and Pmax,g is
the maximum compressive force in the BRB. By considering two deformed restraining members as a unit element under bending, the plastic moment capacity of this unit element, Mpg, is
Mpg
=
ZgfFnyf+
ZgcFnyc (2)where Zgf and Zgc are the plastic section modulus of the face
plates and channels about the BRB centerline axis, respectively; and Fnyf and Fnycare the nominal yield strength of the face plate
and channel, respectively. According to Chapter I of the 2005 AISC Specification for Structural Steel Buildings (AISC-LRFD) [19], concrete flexural strength inside the restraining member is not considered. Assuming that the limit state of the restraining member is reached when Mcent
=
Mpg, the maximum compressiveload is obtained by re-arranging Eq.(1)as follows:
Pmax,g
=
Mpg i+
g+
e+
M g p Pe.
(3)When the restraining member has sufficient bending rigidity, the steel core buckles into a high mode (Fig. 2(b)). The buckling wavelength, Lw, is approximated by applying the Euler formula for a core segment Lwwith a buckling coefficient of 0.5 [9]:
Lw
=
s
4π
2E tIc Py (4)where Icis the moment of inertia about the weak-axis of the core
plate, Etis the tangent modulus of the core plate, assumed as 0.05
times the elastic modulus, and Pyis the core plate yield force. The
contact force, f , which acts on the restraining member, is estimated based on the gap between the core plate and restraining member and a quarter of a wavelength:
f
=
Pmax,lg
Lw
/
4.
(5)As the wavelength, Lw, is close to or larger than a bolt spacing
Lb, the maximum bending moment in a restraining member is
approximated by positioning a contact force f at the center of the bolt spacing, Lb; a pin-supported boundary condition is assumed
at bolt locations. The maximum compressive load of the BRB is reached when the maximum bending moment in a restraining member (
=
Lbf/
4) equals the plastic moment capacity, Mpl, whichis provided by a face plate and a channel. Therefore, the maximum compressive load based on this limit state of high-mode buckling is
Pmax,l
=
MplLw gLb
.
(6)If the wavelength, Lw, is smaller than the bolt spacing, the maximum bending moment in a restraining member is computed based on the number and magnitude of contact force within the bolt spacing.
Fully tensioned high-strength bolts provide the clamping force to eliminate separation between restraining members and a core plate. As global buckling of the BRB is prevented, high-mode buckling of the steel core (Fig. 2(b)) produces contact forces along the core plate length. The number of bolts, Nb, is determined based
on bolt tensile capacity and total contact force in the BRB. Each contact force, adjusted based on the ratio of Lb
/
Lw, is assumeduniformly distributed across the face plate width (Fig. 2(c)):
fa
=
fLb
Lw
.
(7)Assuming a hinge-supported boundary condition at a bolt location, face plate thickness is determined based on adjusted contact force
faand the von Mises yield criterion at the end of the fillet weld
(point A inFig. 2(c)).
3. Test program
3.1. Specimen
The test program consisted of cyclic tests of four BRB specimens.
Fig. 1shows the dimensions of Specimen 1. Specimens 2–4 were
identical to Specimen 1, except for the size of restraining members and number of bolts. Table 1 summarizes member sizes and weights of each specimen. Core plate width, bc, and thickness, tc,
were 150 mm and 22 mm, respectively, for all specimens. The moment of inertia of the restraining members, Ir,g, was calculated
by considering the contribution of the face plate If, channel Icand
concrete Icon. Precisely, the channel contributed over 50% of the
overall moment of inertia of restraining members. The moment of inertia of restraining members decreased for Specimens 1–4 to investigate its effects on BRB cyclic behavior. All bolts in the restraining member were A490 high-strength structural bolts 19 mm (3
/
4 in.) in diameter.ASTM A36 steel with a nominal yield strength of 250 MPa was specified for the channel, and ASTM Gr. 50 steel was specified for the core, side, and face plates. The specified 28-day concrete strength was 35 MPa. Table 2 lists data obtained from tensile coupon tests of steel plates and compressive strength of concrete cylinders at day of test.Table 3lists the core plate yield load, Py,
calculated by multiplying the cross-sectional area, Ac
(=
bc×
tc)
,and yield stress, Fy, obtained from the material tensile coupon test
(Table 2). One parameter investigated in this test program was the
ratio of Pe
/
Py, which was obtained by dividing the buckling loadof restraining members Peby core plate yield load Py. The ratio of
Pe
/
Pywas 6.4–1.4 for Specimens 1–4. For Specimen 4, which hada ratio of Pe
/
Pyless than 1.5, global buckling was expected beforethe core plate reached ultimate compressive capacity, Pu[3,4]:
Pu
=
β
FuAc (8)where
β
is the compression strength adjustment factor, and a value of 1.3 [16] is used to estimate maximum compressive force. Tensile strength Fu is obtained from the material tensile coupontest (Table 2). The buckling load of Specimen 4 obtained from the test can be used to verify the accuracy of the global buckling load prediction based on Eq.(3). The value in parentheses under ultimate load Pu(Table 3) is the ratio of Pu
/
Py, which is greater than the ratios of Pmax,g/
Pyand Pmax,l/
Pyfor Specimen 4. The smallestvalue of Pmax,g
/
Pyand Pmax,l/
Pyis the predicted buckling load(=
1
.
2Py)
for Specimen 4. Specimen 3 was designed with a differentnumber of bolts to investigate the effects of number of bolts (or spacing) on the cyclic performance of the BRB. The tensile capacity-to-demand (CD) ratio of the bolt caused by contact force in the BRB was 1.5–7.4 in each test (Table 3). The ratio of Pmax,l
/
Pybased on thelimit state of high-mode buckling decreased as the ratio of Lb
/
Lwincreased; the values of Lb
/
Lwwere 0.3–2.1.3.2. Test setup
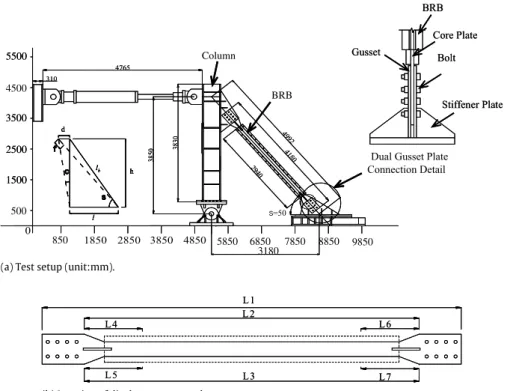
Fig. 3(a) shows the test setup including one column
pin-supported to the laboratory strong floor and attached to a 2000 kN hydraulic actuator. The BRB specimen was positioned at an inclination of
θ =
50° with both ends sandwiched by dual gusset plates. The weak axis of the steel core plate was within the loading plane such that out-of-plane buckling could be observed easily during tests. The relationship between core plate strainε
cand column drift angleα
was determined based on axialdeformation
δ
in the specimen [10]:ε
c=
Lb
α
2Ly
sin 2
θ
(9)where Lb
(=
4992 mm)
is the length between working pointschosen at the intersection of the centerlines of the column, BRB and base, and Ly(
=
2800 mm (Fig. 1)) is the yield length of the(a) Global buckling. (b) High-mode buckling.
(c) Force across the face plate.
Fig. 2. BRB Behavior.
Table 1
Specimen dimension and weight. (a) Dimension
Specimen no. Core Plate Channel and face plate (mm) Restraining member Ir,g(mm4) Bolt (A490 3/4in)
bc(mm) tc(mm) Ly(mm) If Ir,g(%) Ic Ir,g (%) Icon Ir,g (%) No. Spacing (mm) Lb 1 150 22 2800 150×75×6.5×10 3 68 29 44 432 996 32 186 270×12 2 150 22 2800 150×60×4.5×4.5 5 54 41 22 582 066 32 186 270×12 80 72 3 150 22 2800 150×50×4.5×4.5 7 54 39 16 738 929 28 216 270×12 16 432 4 150 22 2800 150×35×4.5×4.5 11 53 36 10 078 747 16 465 270×12 (b) Weight
Specimen no. Steel core (kg) Side plate (kg) Face plate (kg) Channel (kg) Concrete (kg) Total (kg)
1 140 95 150 109 144 638 2 140 95 150 54 120 559 3 140 95 150 50 96 529 4 140 95 150 44 72 501 Table 2 Material properties.
Specimen no. Core plate Channel Face plate Concrete strength (MPa)
Fya(MPa) Fub(MPa) Fy(MPa) Fu(MPa) Fy(MPa) Fu(MPa)
1 367 525 274 425 441 565 57 2 372 528 285 434 411 558 57 3 364 530 285 434 411 558 58 4 375 506 279 438 389 515 48 aYield strength. b Ultimate strength.
core plate. The test specimen was subjected to prescribed loading in Section T6 of the AISC seismic provisions [16]. The loading protocol had two phases. First, each specimen was subjected to an increasing axial strain history (called standard loading), defined at levels corresponding to column drift angles of 0.38, 0.6, 1.2, 1.8 and 2.4%, where core plate maximum strain was 2.1%. Specimens 1–3 were subjected to additional tests, including large-deformation, low-cycle fatigue tests at a core plate strain of 1.6%. Specimen 3 was then tested twice with standard loading after removing some bolts from the BRB.Fig. 3(b) shows the locations of displacement transducers used to measure the displacement
quantities of interest. The out-of-plane deformation along the BRB length was also recorded.
3.3. Test result
Fig. 4shows the measured force in Specimens 1 and 2 versus
total displacement measured across the yielding portion of the BRB (the displacements measured by displacement transducers L2 and L3 inFig. 3(b) were added and divided by 2). A displacement calculated based on displacement transducers L4, L5, L6 and L7 was close to that computed based on transducers L2 and L3. Specimens
Table 3
Specimen strength.
Spe. no. Core plate Restraining member Bolt number
Py(kN) Pu(kN) Lw(mm) Pe(kN) PPe y M g p(kN m) PmaxP,g y M l p(kN m) Pmax,l Py Nb CD a Lb Lw 1 1211 2252 210 7792 6.4 152.6 4.7 41.0 12.7 32 3.0 0.9 (1.9) 2 1228 2265 208 3949 3.2 95.6 2.5 20.8 6.3 32 3.0 0.9 (1.8) 14 80 7.4 0.3 3 1201 2274 211 2943 2.5 84.6 2.0 17.6 4.8 28 2.6 1.0 (1.9) 2.3 16 1.5 2.1 4 1238 2171 208 1758 1.4 74.3 1.2 13.5 1.3 16 1.5 2.2 (1.8)
aBolt tensile capacity-demand ratio.
(a) Test setup (unit:mm).
(b) Location of displacement transducer.
Fig. 3. Test setup and location of displacement transducer.
1 and 2 exhibited stable hysteretic responses up to a core strain of 2.1% during the standard loading test (Fig. 4(a) and (b)). No yielding or buckling of the restraining member was observed after the test (Fig. 5(a)); however, residual displacement was evident at both ends of the BRB (Fig. 5(b)).Fig. 4(c) and (d) show the force and displacement loops up to failure resulting from the low-cycle fatigue test. Specimens 1 and 2 exhibited stable hysteretic responses for the entire fatigue test consisting of 21 and 8 cycles, respectively. Specimen 2 had a few cycles because two additional standard loading histories were conducted up to a core strain of 1.3% in tension and 2.1% in compression. A measure to describe the plastic demand on a BRB is the cumulative plastic ductility,
uc, which is a normalized expression of the cumulative plastic
deformation and is defined by
µ
c=
X
i∆+p i
−
∆ − pi∆y (10) where ∆+ pi and ∆ −
pi are the maximum and minimum plastic
displacements, respectively, during each cycle i into the inelastic range, and∆yis the axial displacement at first significant yield of
the specimen [7,8].Table 4lists the cumulative plastic ductility for each test. Summation of the cumulative plastic ductility for all tests, Σ
µ
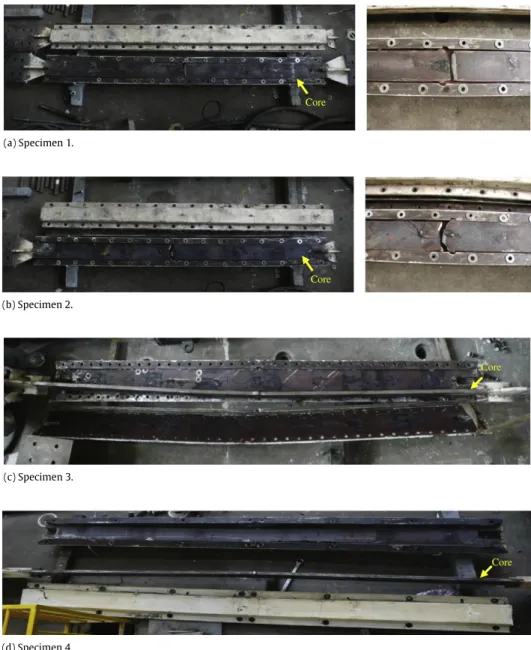
c, was 804 and 650 for Specimens 1 and 2,respectively, larger than the minimum required value of 200 by AISC seismic provisions [16]. These two specimens after all tests were disassembled by removing all bolts. A fracture was identified near the core plate center (Fig. 6(a) and (b)); the restraining members were undamaged.
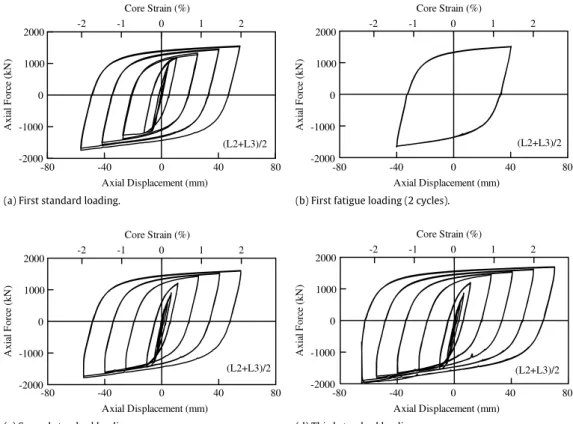
Specimen 3 was first tested with 80 bolts connecting the core plate and restraining members. The specimen exhibited stable hysteretic behavior during the first standard and low-cycle fatigue tests (Fig. 7(a) and (b)). The cumulative plastic ductility after two complete cycles of the fatigue test was 256 (Table 4), already exceeding the AISC value. After removing 52 bolts, Specimen 3 was retested with a standard loading to a core axial strain of 2.1%
(Fig. 7(c)); the restraining member was still undamaged. Twelve
additional bolts were then removed such that the bolt spacing was 432 mm (Table 1). This specimen was again subjected to standard loading and exhibited stable hysteretic response up to a core strain of 2.6%. Weak-axis global buckling was observed during the third loading cycle at a core strain of 2.6% (Figs. 7(d) and8(a)). The
(a) Specimen 1 (standard loading). (b) Specimen 2 (standard loading, 3rd test).
(c) Specimen 1 (fatigue loading, 21 cycles). (d) Specimen 2 (fatigue loading, 8 cycles).
Fig. 4. Specimens 1 and 2 hysteretic responses.
(a) Overall view. (b) Residual deformation.
Fig. 5. Specimen 1 observed performance (after standard loading test).
steel channel bulged on the compression side of the restraining member (Fig. 8(b)). No slippage occurred between the core plate and restraining members. Additionally, no buckling of the dual gusset plate connections was noted; thus, the unbraced buckling length of the BRB was measured between the end of the top and bottom dual gusset plate connections. The cumulative plastic ductility after all tests was 767, close to that of Specimen 1.
Specimen 4 had Pmax,g
/
Pyand Pmax,l/
Pyratios that were lessthan Pu
/
Py(Table 3), indicating that this specimen did not developthe ultimate load, as observed in Specimens 1–3. Instead, weak-axis global buckling was expected during the standard loading test to verify the prediction based on Eq.(3). This specimen showed stable hysteretic responses prior to global buckling at a core strain
of 1.6% (Fig. 9(a)); maximum force in the BRB was 1494 kN in tension and 1660 kN in compression. The maximum compressive load divided by yield load Py was 1.3, slightly larger than the
predicted value of Pmax,g
/
Py=
1.
2 (Table 3).Fig. 9(b) and (c) showthe measured out-of-plane deformation for Specimens 3 and 4 under compression. The out-of-plane deformation was small prior to global buckling and increased suddenly when global buckling occurred. Note that Specimens 3 and 4 buckled in opposite directions.Fig. 6(c) and (d) show global buckling of core plates after disassembling Specimens 3 and 4; core plates had no cracks. The ratio of maximum compressive force to maximum tensile force was 1.1–1.15 for all specimens, less than 1.3 specified in AISC seismic provisions [16].
Core (a) Specimen 1. Core (b) Specimen 2. Core (c) Specimen 3. Core (d) Specimen 4.
Fig. 6. Failure modes of all specimens after tests.
Table 4
Specimen test results.
Specimen no. Test no. Test phase αmaxa(%) εmaxb(%) µmaxc µc Σµc Final failure mode
Core Restraining member
1 First Standard 2.4 2.1 11.4 196 804 Tensile fracture No
Fatigue 1.8 8.5 608 2 First Standard 2.4 2.1 11.4 106 650 Tensile fracture No Second Standard 2.4 11.4 106 Third Standard 2.4 11.4 196 Fatigue 1.8 8.5 242 3 First Standard 2.4 2.6 11.4 196
767 Global buckling Global buckling
Fatigue 1.8 8.5 60
Second Standard 2.4 11.4 196
Third Standard 3.0 14.2 315
4 First Standard 1.8 1.6 8.5 120 120 Global buckling Global Buckling
aMaximum column drift angle. bMaximum core axial strain. c Maximum ductility.
(a) First standard loading. (b) First fatigue loading (2 cycles).
(c) Second standard loading. (d) Third standard loading.
Fig. 7. Specimen 3 hysteretic responses.
(a) Global buckling of BRB. (b) Bulging of steel channel.
Fig. 8. Specimen 3 observed performance (axial strain of 2.6% during third standard loading test). 4. Finite element analysis
4.1. Finite element models for test specimens
To provide a better understanding of the compressive behavior and buckling load of BRBs, an analytical study using the finite element computer program ABAQUS [20] was conducted for 22 BRB models. Specimens 1–4, called Models 1–4, respectively, were first analyzed for a correlation study. Material nonlinearity with the von Mises yielding criterion was considered in the steel core and restraining members. Yield stress obtained from the coupon test (Table 2) was adopted independently for each specimen. The elastic modulus of steel was 203 GPa. To consider the cyclic
effects of BRBs in the tests, the combined isotropic and kinematic hardening model in the computer program ABAQUS was used. The corresponding parameters, which were determined from the cyclic responses of steel coupons, can be found from the prior work [21,22]. Concrete infill was modeled with an elastic property. The steel core, restraining member, concrete infill, and bolts were modeled using eight-node solid elements, C3D8R. Since no slippage existed between the core plate and restraining members in all specimens, rigid beams were used to simulate all bolted connections. The side plates had holes at bolted locations for passing through these rigid beams. An interaction between the steel core and a restraining member was modeled with a hard contact behavior, allowing separation of the interface in tension
(a) Specimen 4 global buckling (axial strain of 1.6%, 1st standard loading test).
(b) Out-of-plane deformation (specimen 3).
(c) Out-of-plane deformation (specimen 4).
Fig. 9. Out-of-plane deformation of the BRB.
and no penetration of that in compression [23]. A frictional coefficient of 0.1 was adopted to simulate greasy steel interfaces.
Fig. 10(a) shows the different parts of Model 1 prior to
assem-bly and a cross-sectional view of Model 1 after assemassem-bly.Fig. 10(b) shows the first buckling mode of the core plate. An initial imper-fection shape of the core plate (1
/
3000 of the core length) was adopted by scaling the first buckling mode. An axial displacement was then applied to the end of the core plate to obtain monotonic behavior.Fig. 11shows core plate deformation in Models 1 and 4 under increasing axial displacement. The number of waves, n, in-creases as axial displacement,δ
, increases; a total of 12 waves are observed when models reach yield(δ =
5.
2 mm)
. Model 1 had no global buckling at an axial displacement ofδ =
59.
1 mm (equal to 2.2% of core axial strain) and no strength degradation in the re-lationship between axial force and axial deformation (Fig. 12(a)). Model 4 buckled globally with 12 waves atδ =
39.
3 mm. The maximum compressive load of Model 4 was 1697 kN, close to 1660 kN obtained during the cyclic test (Fig. 12(b)). Generally, the finite element models reasonably predicted initial elastic stiffness and post-yield strength of BRBs tested.4.2. Parametric study
The objective of the parametric study was to investigate the effects of core plate size, restraining member size, and number of bolts on BRB buckling load. The parameters were length and cross-sectional area of the core plate, bolt spacing, and moment of inertia of the restraining member. In total, 18 BRBs were modeled. Model details are listed in Table 5. Models 5–13 represented BRBs with three yield lengths
(
Ly)
and three cross-sectional areas(Ac
=
bc×
tc); restraining members were designed with a boltCD ratio of 1.5, Lb
/
Lwratios of 1.3–2.1 (Table 6), and Pe/
Pyratiosof 2.0–2.5 (Table 6). Models 14–22 had either ratios of Pmax,g
/
Pyor Pmax,l
/
Py close to 1.0 (Table 6) to obtain buckling load forverification.
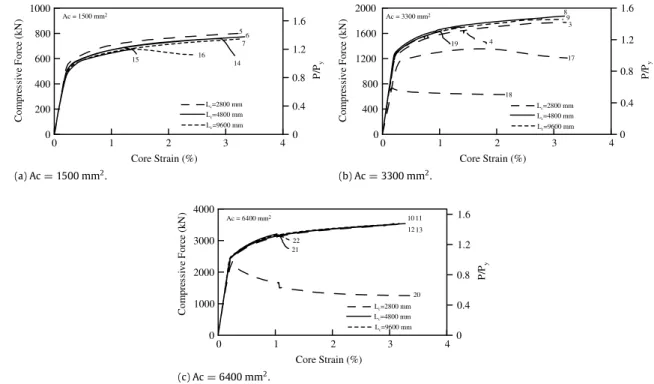
Fig. 13(a) shows the relationship between axial compressive
force and axial compressive strain for Models 5–7 and 14–16, which had an Ac
=
1500 mm2. No strength degradation was notedat a core compressive strain of 3.2% for Models 5–7, which had ratios of Pe
/
Pyof about 2.5, Lb/
Lwof about 2, and a CD ratio of 1.5.However, Models 14 and 15, even with ratios of Pe
/
Pyof about 2.5,experienced local buckling and strength degradation due to low CD values (Table 5) and large ratios of Lb
/
Lw (Table 6).Fig. 14(a)and (b) show high-mode buckling of the core plate at peak loading, resulting in local buckling of restraining members between two bolts. Model 16 experienced global buckling due to a low Pe
/
Pyratio of 1.25.
Fig. 13(b) shows the relationship between axial compressive
force and axial compressive strain for Models 3, 4, 8, 9, and 17–19, which had an Ac
=
3300 mm2. No strength degradation was notedat a core compressive strain of 3.2% for Models 3, 8, and 9, which had ratios of Pe
/
Pyof about 2.5, Lb/
Lw of 1.3–2.1, and a CD ratioof 1.5. Model 17 was identical to Model 3, except that the bolt spacing for Model 17 was larger than that for Model 3; the ratio of Lb
/
Lwfor Model 17 was 2.65. Model 17 showed local buckling of the restraining member at a low core compressive strain but the strength did not decrease until at a core compressive strain of 1.8%. Model 4, which simulated Specimen 4, experienced global buckling as seen inFig. 14(c). Model 18 was identical to Model 4, except that bolt spacing for Model 18 was 1.5 times that for Model 4 and the(a) Model.
(b) First buckling mode of steel core plate.
Fig. 10. Specimen 1 finite element model.
(a) Model 1 (specimen 1).
(b) Model 4 (specimen 4).
Fig. 11. Core plate buckling in increasing axial displacement.
bolt CD ratios were 1 and 1.5 for Models 18 and 4, respectively. Local buckling of the restraining member occurred in Model 18 at a core compressive strain of 0.18%, much lower than that when
Model 4 buckled. Model 19 was identical to Model 8, except that the ratio of Pe
/
Pyfor Model 19 was half that for Model 8. Global(a) Mode1 (specimen 1). (b) Model 4 (specimen 4).
Fig. 12. Comparison between test and finite element analysis results.
Table 5
Model details.
Model Core Plate Restraining member Bolt
No. Name bc (mm) tc (mm) Yield stress (MPa) Ly (mm) Channel (mm) Face plate (mm) Length (mm) Ir,g (mm4) Bolt size (mm) Nb Lb (mm) CD 5 A15L28P24S 100 15 375 2800 100×46×4.5×4.5 200×10 2940 7767168 16 22 280 1.5 6 A15L48P25S 100 15 375 4800 100×76×4.5×4.5 200×10 4940 20138857 16 36 282 1.5 7 A15L96P25S 100 15 375 9600 100×134×4.5×4.5 200×10 9740 72688354 16 74 267 1.5 3 A33L28P24S 150 22 364 2800 150×50×4.5×4.5 270×12 2940 16738929 19 16 432 1.5 8 A33L48P24S 150 22 375 4800 C 150×75×6.5×10 270×12 4940 43695988 16 36 284 1.5 9 A33L96P25S 150 22 375 9600 150×156×4.5×4.5 270×12 9740 159846725 16 72 274 1.5 10 A64L28P24S 200 32 375 2800 200×56×4.5×4.5 320×14 2940 33266295 19 14 455 1.5 11 A64L48P23S 200 32 375 4800 C 200×80×7.5×11 320×14 4940 80615534 19 24 438 1.5 12 A64L96P25S 200 32 375 9600 200×178×4.5×4.5 320×14 9740 309930822 19 48 418 1.5 13 A64L48P20S 200 32 375 4800 200×88×4.5×4.5 320×14 4940 69940478 19 24 438 1.5 14 A15L28P24LB 100 15 375 2800 100×46×4.5×4.5 200×10 2940 7767168 16 14 467 1.0 15 A15L48P25GB 100 15 375 4800 100×76×4.5×4.5 200×10 4940 20138857 16 16 686 0.7 16 A15L96P13GB 100 15 375 9600 100×100×4.5×4.5 200×10 9740 36613236 16 74 267 1.5 17 A33L28P24LB 150 22 364 2800 150×50×4.5×4.5 270×12 2940 16738929 19 12 560 1.2 4 A33L28P14GB 150 22 375 2800 150×35×4.5×4.5 270×12 2940 10078747 19 16 465 1.5 18 A33L28P14LB 150 22 375 2800 150×35×4.5×4.5 270×12 2940 10078747 19 10 700 1.0 19 A33L48P12GB 150 22 375 4800 150×60×4.5×4.5 270×12 4940 22016167 16 36 284 1.5 20 A64L28P24LB 200 32 375 2800 200×56×4.5×4.5 320×14 2940 33266295 19 10 700 1.1 21 A64L48P13GB 200 32 375 4800 200×68×4.5×4.5 320×14 4940 44694868 19 24 438 1.5 22 A64L96P14GB 200 32 375 9600 200×140×4.5×4.5 320×14 9740 179652939 19 48 418 1.5 Table 6 Design parameters.
Model Design parameters ABAQUS
No. Name Py(kN) Pu(kN) Lw(mm) Lb Lw Pe(kN) Pe Py Pmax×,g Py Pmax×,l Py Result Pmax× Py 5 A15L28P24S 563 987 142 1.97 1362 2.42 2.0 3.2 Sa 1.42 6 A15L48P25S 563 987 142 1.99 1394 2.48 2.1 5.7 S 1.39 7 A15L96P25S 563 987 142 1.85 1405 2.50 2.1 13.8 S 1.38 3 A33L28P24S 1201 2274 211 2.05 2943 2.45 2.0 2.3 S 1.48 8 A33L48P24S 1238 2171 208 1.37 3025 2.44 2.1 8.1 S 1.47 9 A33L96P25S 1238 2171 208 1.32 3090 2.50 2.0 11.5 S 1.45 10 A64L28P24S 2400 4210 302 1.51 5834 2.43 1.9 2.3 S 1.50 11 A64L48P23S 2400 4210 302 1.45 5580 2.33 1.9 5.9 S 1.48 12 A64L96P25S 2400 4210 302 1.38 5999 2.50 1.9 9.2 S 1.47 13 A64L48P20S 2400 4210 302 1.45 4841 2.01 1.6 3.8 S 1.47 14 A15L28P24LB 563 987 142 3.3 1362 2.42 2.0 1.2 LBc 1.32 15 A15L48P25LB 563 987 142 4.83 1394 2.48 2.1 1.0 LB 1.19 16 A15L96P13GB 563 987 142 1.85 708 1.25 1.1 7.55 GBb 1.20 17 A33L28P24LB 1201 2274 211 2.65 2943 2.45 2.0 1.2 LB 1.13 4 A33L28P14GB 1238 2171 208 2.24 1758 1.42 1.2 1.3 GB 1.36 18 A33L28P14LB 1238 2171 208 3.37 1758 1.42 1.2 0.6 LB 0.58 19 A33L48P12GB 1238 2171 208 1.37 1357 1.23 1.1 3.7 GB 1.32 20 A64L28P24LB 2400 4210 302 2.3 5834 2.43 1.9 1.2 LB 0.97 21 A64L48P13GB 2400 4210 302 1.45 3244 1.29 1.1 3.0 GB 1.31 22 A64L96P14GB 2400 4210 302 1.38 3473 1.44 1.2 6.7 GB 1.31
aSuccessful (no buckling). bGlobal buckling. c Local buckling.
(a) Ac=1500 mm2. (b) Ac=3300 mm2.
(c) Ac=6400 mm2.
Fig. 13. Axial force versus strain relationships.
Fig. 13(c) shows the relationship between axial compressive
force and axial compressive strain for Models 10–13 and 20–22, which had an Ac
=
6400 mm2. Models 10–13, which had ratiosof Pe
/
Pyof 2.0–2.5, Lb/
Lwand bolt CD ratios of about 1.5, showedno buckling at a core compressive strain of 3.2%. Model 20 was identical to Model 10, except that the Lb
/
Lw and bolt CD ratiosfor Model 20 were 2.3 and 1.1, respectively. Local buckling was observed in Model 20 at a core compressive strain of 0.26%. Models 21 and 22 were identical to Models 11 and 12, respectively, except that Models 21 and 22 had low Pe
/
Pyratios (Table 6). As expected,Models 21 and 22 experienced global buckling (Fig. 14(d)) at a low core compressive strain.
Fig. 15(a) shows the relationship between a ratio of maximum
compressive load to yield load (Pmax
/
Py) and a ratio of Lb/
Lw. Formodels with Pe
/
Pyratios larger than 2 and Lb/
Lwratios less than2, the Pmax
/
Py ratios are close to 1.4–1.5 at a core compressivestrain of 3.2% without buckling. The Pmax
/
Pyratios are 1.0–1.4 dueto local buckling of the restraining member in models with Pe
/
Pyand Lb
/
Lwratios larger than 2. The Pmax/
Pyratio in Model 18 isextremely low with Pe
/
Py=
1.
4 and Lb/
Lw=
3.
4. Fig. 15(b)shows the relationship between Pmax
/
Pyand Pe/
Py ratios for allmodels with an Lb
/
Lw ratio less than 2, such that local bucklingof the restraining member is excluded. Note that the ratio of
Pmax
/
Py increases as Pe/
Py increases and reaches about 1.4–1.5when the Pe
/
Pyratio exceeds 2.Fig. 15(c) shows the relationshipbetween Pmax
/
Pyand Ir,g/(
Ir,g)
minfor models with similar Pe/
Pyratios
(>
2)
and different core plate yield lengths and thicknesses. For a specified core plate yield length, the ratio of Ir,g/(
Ir,g)
miniscomputed by dividing the moment of inertia of the restraining member Ir,g by that (
(
Ir,g)
min) of a model with the thinnest coreplate. The Pmax
/
Pyratio increases as core plate thickness increases.For core plates with the same thickness, the Pmax
/
Pyratio increasesas core plate length decreases. Fig. 15(d) shows a comparison between maximum compressive load obtained by finite element analysis (Pmax
/
Py) and buckling load prediction((
Pmax/
Py)
p)
, whichis the minimum value of Pmax,g
/
Pyand Pmax,l/
Pyin models (Table 6).The prediction based on Eq. (3) or (6) is reasonably accurate, conservatively estimating maximum compressive load for most models.
5. Recommended design procedure
A parametric study shows the effects of restraining member size, number of bolts, core plate length and cross-sectional area on buckling load variation, indicating that for models with a Pe
/
Pyratio larger than 2, Lb
/
Lwratio less than 2 and bolt CD ratio of 1.5,maximum compressive load of the BRB reaches about 1.4–1.5Py
without buckling. The restraining member and number of bolts should be designed based on ratios of Pe
/
Py≥
2.
5,
Lb/
Lw≤
2.
0,and bolt CD ratio
≥
1.
5, such that the compressive load Pmax,g orPmax,lexceeds Puto exclude buckling. A stringent requirement for
a Pe
/
Pyratio is recommended due to the smallest value of Pe/
Pyamong Specimens 1–3 (Table 3). The following steps for designing the proposed BRB are recommended:
1. Determine the cross-sectional area of the core plate using Eq. (8). Note that the ratio of maximum compressive force to maximum tensile force
β
can, based on test results, be 1.15 instead of 1.3 as recommended in AISC seismic provisions [16].2. Compute the moment of inertia of the restraining member based on yield load of core plate Pyand Pe
/
Py≥
2.
5 to determinethe preliminary size of the restraining member. It is recommended that the channel and core plate widths be similar and the channel provide more than half the total moment of inertia of the restraining member based on design characteristics of test specimens (Table 1(a)).
3. Compute plastic moment capacity of the restraining member
Mpg (Eq.(2)) and maximum compressive load based on the limit
state of global buckling Pmax,g (Eq.(3)). If Pmax,g is less than Pu,
determine the other restraining member dimensions by returning to Step 2.
4. Calculate buckling wavelength Lw (Eq.(4)) and maximum compressive load based on the limit state of high-mode buckling
Pmax,l (Eq. (6)). If Pmax,l is less than Pu, determine the other
restraining member dimensions by returning to Step 2.
5. Estimate contact force f (Eq.(5)). The number of bolts, Nb, is
determined by bolt tensile capacity and total contact force in the BRB with a bolt CD ratio of 1.5. If bolt spacing Lbdoes not satisfy
(a) Model 14.
(b) Model 15.
(c) Model 4.
(d) Model 21.
Fig. 14. Global and local buckling of finite element models. 6. Conclusions
A BRB was developed by sandwiching a core plate between two restraining members, which were made of a flat plate, channel and in-filled concrete, with fully tensioned high-strength A490 bolts. Specimens 1–3, designed with ratios of Pe
/
Py≥
2.
5 and Lb/
Lw≤
2
.
1 and a bolt CD ratio≥
1.5, had stable hysteretic responses and developed maximum compressive loads of 1724–1951 kN (1.4–1.6 times actual yield load Py) at compressive strains of 2.1%–2.6%.The cumulative plastic ductility was 650–804, significantly larger than the minimum required cumulative plastic ductility of 200 specified in AISC seismic provisions [16]. Specimen 4 was designed with a Pe
/
Pyratio of 1.4 to verify the accuracy of buckling loadprediction (Eq.(3)). Specimen 4 also exhibited stable hysteretic responses prior to global buckling at a core compressive strain of 1.6%. Finite element analysis was conducted for correlation
and parametric studies to examine the effects of flexural rigidity of the restraining member, bolt spacing, core plate length and cross-sectional area on BRB buckling load. This study supports recommended design criteria for the proposed BRB and obtains the following conclusions.
1. A small gap substituting unbonded material between the core plate and restraining members does not affect the cyclic behavior of the proposed BRB. The ratio of maximum compressive force to maximum tensile force is 1.1–1.15, less than the ratio of 1.3 in AISC seismic provisions [16].
2. Specimens 1 and 2 exhibited core plate fractures during low-cycle fatigue tests. The BRB was disassembled by removing all bolts. One crack propagated through the core width near the center of the BRB. The restraining members in Specimens 1 and 2 did not yield or buckle after all tests. Specimen 3 tested three times with different number of bolts showed similar hysteretic responses up
(a) Pmax/Pyversus Lb/Lw. (b) Pmax/Pyversus Pe/Py.
(c) pmax/Pyversus Ir,g/(Ir,g)min. (d) Finite element analysis versus prediction. Fig. 15. Comparison between different parameters.
to a core compressive strain of 2.6%. The global buckling load of Specimen 4 was 1
.
3 Py, slightly larger than the predicted value ofPmax,g
=
1.
2Pyusing Eq.(3)and close to the buckling load basedon finite element analysis.
3. A parametric study, conducted on 18 BRBs, demonstrated that the predicted maximum load based on the limit state of either global or local buckling (Eq.(3)or(6)) was reasonably accurate, conservatively estimating maximum compressive loads for most models. For core plates with the same thickness, thePmax
/
Pyratioincreases as core plate length decreases. For core plates with the same length, the Pmax
/
Pyratio increases as core plate thicknessincreases.
4. A parametric study showed that if the restraining member of the BRB was designed with Pe
/
Py≥
2.
0, Lb/
Lw≤
2.
0, anda CD ratio
≥
1.
5 (Models 5–13), the BRB reached a maximum compressive load of about 1.
4–1.
5Py(Table 6) without buckling.A stringent requirement for a ratio of Pe
/
Py≥
2.
5 was proposeddue to the smallest value of Pe
/
Pyamong Specimens 1–3 (Table 3).Acknowledgements
The financial support provided by the National Center for Re-search on Earthquake Engineering (NCREE), Taiwan is appreciated. The authors would like to thank Prof. K. C. Tsai for providing advice in this research program.
References
[1] Sabelli R, Mahin SA, Chang C. Seismic demands on steel braced-frame buildings with buckling-restrained braces. Eng Struct 2003;25:655–66.
[2] Kiggins S, Uang CM. Reducing residual drift of buckling-restrained braced frames as a dual system. Eng Struct 2006;28:1525–32.
[3] Uang CM, Nakashima M. Steel buckling-restrained braced frames. In: Bozorg-nia Y, Bertero VV, editors. Earthquake engineering from engineering seismol-ogy to performance-based engineering. Boca Raton, FL: CRC Press LLC; 2003. p. 16-1–16-37. [Chapter 16].
[4] Watanabe A, Hitomi Y, Yaeki E, Wada A, Fujimoto M. Properties of braces encased in buckling-restraining concrete and steel tube. In: Proceedings of 9th world conference on earthquake engineering. 1988. p. 719–24.
[5] Wada A, Saeki E, Takeuchi T, Watanabe A. Development of unbonded brace. Nippon Steel Corporation Building Construction and Urban Development Division, Tokyo, Japan, 1998. p. 1–16.
[6] Clark P, Aiken I, Kasai K, Ko E, Kimura I. Design procedures for buildings incorporating hysteretic damping devices. In: Proceedings of 69th annual convention. SEAOC. 1999.
[7] Merritt S, Uang CM, Benzoni G. Subassemblage testing of CoreBrace buckling-restrained braces. Report No. TR-2003/01. University of California, San Diego; 2003.
[8] Merritt S, Uang CM, Benzoni G. Subassemblage testing of Star Seismic buckling-restrained braces. Report No. TR-2003/04. University of California, San Diego; 2003.
[9] Koetaka Y, Byakuno Y, Inoue K. Experimental verification of design criteria of knee brace damper. in: 8th Taiwan–Korea–Japan Joint seminar on earthquake engineering for building structures. 2006. p. 69–79.
[10] Iwata M, Murai M. Buckling-restrained brace using steel mortar planks: performance evaluation as a hysteretic damper. Earthq Eng Struct Dyn 2006; 35:1807–26.
[11] Usami T, Ge HB, Kasai A. Overall buckling prevention condition of buckling-restrained braces as a structural control damper. In: 14th world conference on earthquake engineering. 2008.
[12] Tsai KC, Hsiao BC, Wang KJ, Weng YT, Lin ML, Lin KC, Chen CH, Lai JW, Lin SL. Pseudo-dynamic tests of a full scale CFT/BRB frame—Part I: Specimen design, experiment and analysis. Earthq Eng Struct Dyn 2008;37:1081–98. [13] Palazzo G, López-Almansa F, Cahís X, Crisafulli F. A low-tech dissipative
buckling restrained brace. Design, analysis, production and testing. Eng Struct 2009;31:2152–61.
[14] Ju YK, Kim MH, Kim J, Kim SD. Component tests of buckling-restrained braces with unconstrained length. Eng Struct 2009;31:507–16.
[15] Celik OC, Bruneau M. Seismic behavior of bidirectional-resistant ductile end diaphragms with buckling restrained braces in straight steel bridges. Eng Struct 2009;31:380–93.
[16] AISC (American Institute of Steel Construction), Seismic provisions for structural steel buildings, Chicago, IL, 2005.
[17] Chen SY. Seismic tests and finite element analyses of buckling-restrained braces with a replaceable core plate. Thesis advisor: Chou CC. National Chiao Tung University, Hsinchu, Taiwan; 2008 [in Chinese].
[18] Chou CC, Chen SY. Subassemblage tests and finite element analyses of sandwiched buckling-restrained braces with a replaceable core. In: 6th international conference for behavior of steel structures in seismic area (STESSA). 2009.
[19] AISC (American Institute of Steel Construction). Manual of steel construction load and resistance factor design. Chicago, IL; 2005.
[20] ABAQUS. Standard user’s manual version 6.3. Pawtucket, RI: Hibbitt, Karlsson & Sorensen, Inc.; 2003.
[21] Chou CC, Wu CC. Performance evaluation of steel reduced flange plate moment connections. Earthq Eng Struct Dyn 2007;36(14):2083–97.
[22] Wu CC. Seismic behavior of steel reduced flange moment connections. Thesis advisor: Chou CC. National Chiao Tung University, Hsinchu, Taiwan; 2005 [in Chinese].
[23] Chou CC, Chen JH, Chen YC, Tsai KC. Evaluating performance of post-tensioned steel connections with strands and reduced flange plates. Earthq Eng Struct Dyn 2006;35(9):1167–85.