行政院國家科學委員會專題研究計畫 成果報告
建構 IT 投資組合評量之方法論
研究成果報告(精簡版)
計 畫 類 別 : 個別型
計 畫 編 號 : NSC 99-2410-H-004-103-
執 行 期 間 : 99 年 08 月 01 日至 100 年 07 月 31 日
執 行 單 位 : 國立政治大學資訊管理學系
計 畫 主 持 人 : 張欣綠
計畫參與人員: 碩士班研究生-兼任助理人員:林如謙
碩士班研究生-兼任助理人員:蔡亞霖
碩士班研究生-兼任助理人員:王育聖
博士班研究生-兼任助理人員:蕭祥恩
報 告 附 件 : 出席國際會議研究心得報告及發表論文
處 理 方 式 : 本計畫涉及專利或其他智慧財產權,2 年後可公開查詢
中 華 民 國 100 年 09 月 04 日
(一) 研究內容
Developing an IT Portfolio Approach to Justify IT Investments
1. Introduction
Today, investments in IT have constituted up to 50% of the annual capital
expenditures of large organizations (Willcocks and Lester, 1997; Premkumar and
Ramamurthy, 1995). A survey of 400 top IT executives has shown that 60% of them
reported an increase in the level of pressure to prove return on IT investment (ROI),
70% believe that their metrics do not fully capture the value of IT, and nearly half lack
confidence in their ability to accurately calculate ROI on IT investments (Kirkpatrick,
2002). The results highlight the importance of IT investment decision process. The
main question that should be asked is how IT decision to be made. To answer the
question, the focus is on the design of the methodologies that can be used for IT
investment decision.
Numerous researchers have done great contributions in this area. Among them, IT
portfolio approach has gained great awareness. Similar to the portfolio management
framework utilized in the financial services sector, IT portfolio approach is a
combination of people, processes, and corresponding information and technology that
senses and responds to change. The goal is to deliver measurable business value,
tangible and intangible, while aligning and improving the business and strategy
(Maizlish and Handler, 2005). The uniqueness and advantage of IT portfolio is that it
considers various business needs and different IT investment evaluation
methodologies to form an ideal investment decision process. But controversially, that
is also where its disadvantages reveal.
Traditional IT portfolio approach takes each business concern as single criteria,
which in some way we can take it as an extension of the multi-criteria approach.
However, are all the criteria, such as IT alignment, risk, value, IT maturity, IT
readiness, financial constraints, etc. with the same importance? Is there any criteria
that should be paid more attention to than the others? Is there any sequence among all
decision criteria? One that should be evaluated first, then comes the rest?
This research aims at proposing a revised IT portfolio approach to solve these issues.
We will start from defining important concepts in the IT investment domain, then
forming and explaining our methodologies. Afterwards, a case study will be proposed
to demonstrate the efficacy of our proposed methodology.
2. Literature review
Since this research aims to apply IT portfolio approach to justify IS investment, it
is important for us to know why this approach is useful and how we are going to use it.
The literature review will focus on two aspects:
2. The weighting and scoring methods that have been applied to prioritize and rank
investments in the portfolio.
2.1 The IT investment evaluation method
To determine what IT investment should be made, two questions are important: (1)
“How is the investment decision made?” and (2) “why is the investment decision
made?” The first question links to the decision-making methodology and the second
addresses the criteria followed in the process (Escobar 1998).
With regard to decision-making process, Renkema and Berghoutb (1997) have
distinguished four basic approaches that can be recognized in many methods
proposed:
1. The financial approach– focuses on the incoming and outgoing cash flows as a
result of the investment made. Examples include ROI, the payback period, the
internal rate of return, the net present value, and so on.
2. The multi-criteria approach– begins with a number of goals or decision criteria,
and then assigns each with proper scores and weighting to create one single
measure for each investment for justifying the priority of IT investments. One
famous method in this category is the “information economics method” proposed
by Parker et al (1989), which evaluates an IT investment with criteria from three
domains: (1) enhanced ROI, (2) business domain, and (3) technology domain.
3. The ratio approach – pays attention to the possibilities to compare organizational
effectiveness by means of ratios. Several ratios have been proposed to assist in IS
investment evaluation. Examples of meaningful ratios include IS expenditures
against total turnover and all yielding that can be attributed to IS investments
against total profits. Ratios do not necessarily take only financial figures into
account. IS expenditures can, for instance, be related to the total number of
employees or to some output measure (e.g. products or services) (Strassmann 1990
and NieveIt 1992).
4. The portfolio approach– evaluates IS investment proposals on three criteria
simultaneously: (1) the contribution to the business domain, (2) the contribution to
the technology domain, and (3) the financial consequences, by means of net
present values (NPV) calculation. This approach is very similar to the multi-criteria
approach; however it differs in the way that this approach tries to adopt a more
balanced perspective to consider the criteria “simultaneously,” (i.e. displaying the
trade-off between variables) not “separately”, giving each criteria a weighting (see
Bedell, 1985).
The four approaches that Renkemaa and Berghoutb (1997) have categorized are
not exclusive. Multi-criteria method is widely used in the portfolio approach, and the
ratio approach can be viewed as an extension of financial approach with
non-quantitative parameters adding to it. In this research, we choose IT portfolio
method to develop our methodology for the following reasons. First, it is a
methodology that combines different aspects of business considerations, gives
attention to all business needs “simultaneously”, and more importantly, incorporates
different features of IT investment evaluation method, including financial approach
and multi-criteria approach. By doing so, the differences, advantages, and
disadvantages between each IT investment approach can partly be overcome
(Renkemaa and Berghoutb, 1997). Second, IT portfolio method has been paid
attention by corporations (Jeffery and Leliveld 2004). One recent industry survey has
shown that 89% of the CIOs polled are very aware of IT portfolio method (ITPM) and
65% believe that the approach yields significant business value (Jeffery and Leliveld
2004).
Past literature has proposed different IT portfolio approaches; however, each with its
limitations and focuses only on certain aspects of the portfolio method. For instance,
Verhoef (2002) has presented a quantitative approach for IT portfolio management,
which focuses mainly on IT project risks, costs, and duration, lacking considerations
among intangible values that IT can offer, such as IT supporting the business strategy.
Jeffery and Leliveld (2004) review some best practices in IT portfolio management
and specify different maturity levels of IT portfolio management, but their work does
not provide necessary criteria for justification. Cao et al (2006) have proposed a
solution to align IT investment with business, but their method is mostly based on
multi-criteria weighting. Dickinson et al. (2004) present a model to optimize a
portfolio of technology improvement projects. Although the model attempts to
balances risk, overall objectives, and the cost and benefit of the entire portfolio, their
proposed measures mainly concern technical improvement projects, which in some
aspects are different from the IT projects.
2.2 The evaluation criteria and prioritization of IT investments
One important aspect of IT portfolio approach is to ensure that an IT investment in
the portfolio should be in pursuit of both: (a) quantifiable net benefits and (b)
explicitly planned business objectives (Bacon 1992). In a research done by Escobar
(1998), 86.8% of the firms adopted at least one kind of financial criteria, 100% of the
firms adopted at least one kind of management criteria, and 92.1% of the firms
adopted at least one kind of development criteria. Drake and Byrd’s research (2006)
have provided means to assess the health and completeness of an IT portfolio by
proposing five project portfolio risks– strategic alignment risks, organization and
management risks, cultural and climate risks, project relationship risks, and financial
risks.
We conclude three domains of criteria that are needed to be considered when
justifying the priorities of IT investments: (1) IT alignment, assessing the accordance
between IT goals/strategies and business goals/strategies (supporting literatures are
like Irani 2002, Wen and Shih 2006), (2) Business value, including both financial and
non-financial criteria, as firms need to know and see the value, the benefit, and the
cost of an investment (supporting literature includes Kearns 2004, Reyck et al. 2005),
and (3) E-readiness, which concerns risk issues related to new IT investments and
indicates whether a business is ready for new IT/IS investments.(supporting literatures
can been found in Lin et al. 2007, Reyck et al. 2005). The three domains of criteria
used in the decision of IT investment prioritization are explained and described in
detail below.
2.2.1. IT Alignment. IT alignment is generally defined as the alignment of an
organization's IT resources with the objectives of its business unit. Weiss et al (2006)
have identified three different IT alignment levels, from bottom-line technical
resource alignment, to business enabler, and to strategic weapon. The desired state of
IT portfolio is to achieve the stage of “strategic weapon,” or namely “strategic
alignment” mentioned in other IS literature, focusing on the linkage of the IT
investment strategy with the firm’s business strategy. To achieve this goal, companies
should first clearly recognize and indentify their core “business competitive strategy”.
Identifying a company’s business competitive strategy is not an easy task however,
because it denotes a large and sophisticated domain of knowledge. Miles and Snow
(1978) have proposed a classification of business competitive strategy, which are
widely embraced and paid considerable research attention in both the management
and marketing strategy literature (Desarbo et al. 2005). Their typology concludes four
basic types of competitive strategies on the basis of different business patterns: (1)
Prospector, (2) Analyzer, (3) Defender, and (4) Reactors. Prospectors are
technological innovator, interested in seeking out new markets; analyzers tend to
prefer a ‘second-but-better’ strategy; defenders are engineering-oriented and focus on
maintaining a secure niche in relatively stable market segments; reactors lack a stable
strategy and are highly responsive to short-term environmental exigencies (Desarbo et
al. 2005). Various past researchers have applied Miles and Snow’s typology to justify
the corresponding IT investment strategy. For instance, Tavakolian (1989) has studied
the relationship between the firm’s IT structure and its competitive strategy, with
respect to Miles and Snow’s classification. Karami et al. (1996) point out each
competitive strategy’s corresponding technological concerns. In Sabherwal and
Chan’s research (2001), they have justified the suitable IS strategy for each business
competitive strategy, concerning the types of IS systems that should be invested.
Although using the Miles and Snow’s classification can help firms develop a clear
strategic goal of IT portfolio, it is still not clear about the process through which the
IT portfolio can achieve the goal, or in other words, strategically aligned. As
mentioned in Luffman’s research (2003), to achieve IT alignment, there’s a need for
effective exchange of ideas and a clear understanding of the whole picture of what it
takes to ensure successful strategies. IT organizations should demonstrate their value
to the business in terms that the business understands that business and IT metrics of
value should be the same. Kaplan and Norton (2003) have provided a process for
firms to achieve strategic alignment: strategy maps.
Strategy maps is defined as a diagram that describes how an organization creates
value by connecting strategic objectives in explicit cost-and-effect relationship with
each other in the four Balanced Scorecard objectives: financial perspective, customer
perspective, internal perspective, and learning and growth perspective. Kaplan and
Norton (2006) suggest that strategy maps can be used as a tool to increase the
alignment between IT strategy and business strategy in a sense to convert intangible
IT capitals into tangible business values. To make the conversion even more
effectively, Kaplan and Norton (2006) has further classified IT investment in to four
categories: (1) transformational applications, systems and network that change the
prevailing business model of the enterprise; (2) analytic applications, systems and
networks that promote analysis, interpretation, and sharing of information/knowledge;
(3) technology infrastructure, the shared technology and managerial expertise required
to enable effective delivery and use of information capital applications; and (4)
transaction processing applications, systems that automate the basic repetitive
transactions of the enterprise.
In this research, we choose strategy maps as our primary tool to aid and ensure IT
strategic alignment.
2.2.2. Business Value. The past literature has categorized the business value of IT into
two major categories: (1) financial benefits and (2) non-financial benefits. The first
category focuses on the financial performance of organizations resulting from
investments. Many empirical studies have found support for a positive relationship
between IT resources and organization’s financial performance (Santhanam and
Hartono, 2003, Sheng et al 2005). Financial benefits can be measured through
tangible metrics, such as cost savings, productivity, market share, and profitability.
The second category is concerned with intangible benefits provided by IT, focusing
on improved business processes and relationships such as better customer services,
increased knowledge about customers, improved coordination with partners, superior
product quality, and competitive advantages.
In the past literature, cost-benefit analysis is typically used to assess the business
value of IT investments (King and Schrems, 1978). In the cost-benefit analysis, the
criteria of costs are usually simply straightforward, calculated by the amount of
money that a single investment needed, directly and indirectly. The criteria used in
evaluating the benefits of an IT investment, however, are relatively more complicated
and include either financial and non-financial criteria, or both. For instance, Salemron
(2002) values the benefits from three aspects, with both financial and non-financial
criteria: information accuracy, executive support, organization support. Mashhour
(2008) on the other hand, only considers financial benefit in the calculation. In
conclusion, the criteria used in cost-benefit analysis today still remains a bit
free-willed, depending on the researcher’s own attitude toward what benefits are
expected to be brought by IT investments.
2.2.3. E-Readiness. E-readiness is a relatively new concept that has been given
impetus by the rapid rate of Internet penetration throughout the world and the
dramatic advances in uses of IT in business and industry. The concept is originated by
the intent to provide a unified framework to evaluate the breadth and depth of the
digital divide between more and less developed or developing countries during the
later part of 1990s. E-readiness assessments can also reveal which bottlenecks are
worth the investment of time and money to be removed, and which can be worked
around (Mutula and Brakel, 2006). Later on, the concept is being transferred to
organizations and private sectors, used in decision along with IT investments, and
being described in many research works (e.g., Mutula and Brakel 2006 and Fathian et
al 2008).
The framework of E-readiness however, remains a bit diverged. From our study of
the past literature, we’ve summarized different e-readiness measurements into three
major categories: (1) organizational readiness (Fathian et al 2008, Mutula and Brakel
2006), (2) technological readiness (Fathian et al 2008, Mutula and Brakel 2006, Molla
and Licker 2005), and (3) environmental readiness (Fathian et al 2008, Mutula and
Brakel 2006, Oxely and Yeung 2001).
3. Research framework
Literature review has shown that IT portfolio management has two major issues to
consider: (1) the portfolio should align with organizational goals and (2) the portfolio
should balance risks and returns, while considering the resource constraints. We
therefore propose a methodology following the three major processes: (1) propose a
IT portfolio that can align IT investment with business needs; (2) prioritize IT
portfolio elements by considering business value and E-readiness simultaneously; and
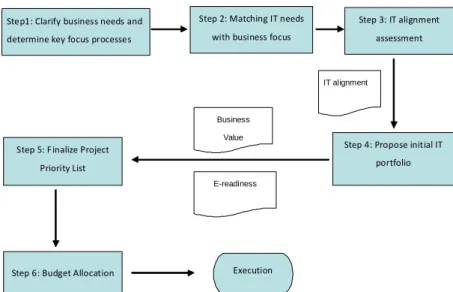
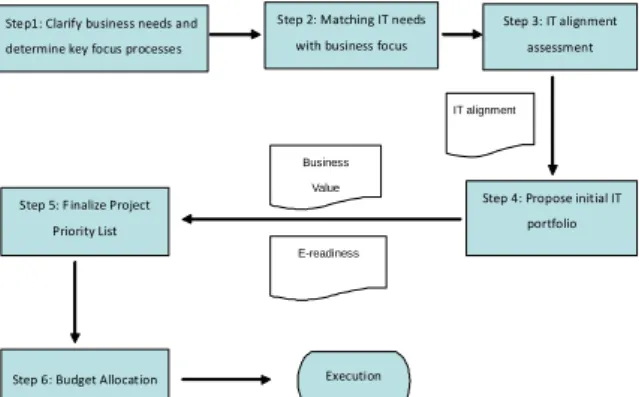
(3) adjust the IT portfolio based on IT budget constraints. The research framework is
shown in Figure 1.
Step1: Clarify business needs and determine key focus processes Step 2: Matching IT needs with business focus Business Value Execution Step 3: IT alignment assessment Step 4: Propose initial IT portfolio E-readiness Step 5: F inalize Project Priority List Step 6: Budget Allocation IT alignmentFigure 1: Research Model: Proposed IT Portfolio Approach
3.1 Align IT investments with business needs
In our research framework, we believe that for firms to justify the right IT
investments, IT alignment is to be achieved at the very beginning. In other words,
business demands should align IT demands closely. Three steps are proposed as
follows.
Step 1: Clarify business needs and determine key processes
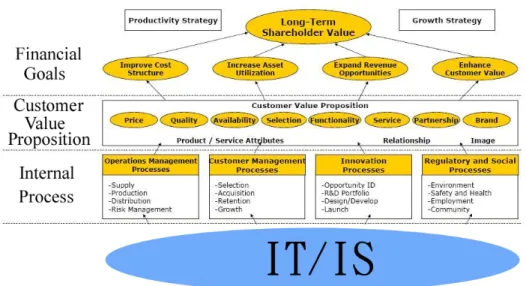
To clearly justify and understand the business demand of a firm, we adopt the
approach developed from strategy map (Figure 2). The process of defining business
needs starts from crafting the firm’s core strategy; which ultimately leads to long-term
shareholder value and financial benefits. These financial benefits may be achieved by
enhancing the customer’s value proposition towards the firm’s product or service.
After realizing customer’s value proposition, firm need to further justify which
processes will enhance the value proposition desired by customers, which we call it
the key focus processes. Through the entire analysis, the firm’s business needs and the
processes that are needed to be strengthened or further improved in order to satisfy
those needs are clearly depicted.
Figure 2: Using strategy map approach to analyze strategic-focused areas – an
example
The next step is to identify effective IT solutions concerning the business needs
highlighted in the firm’s strategy maps, which is described as follows.
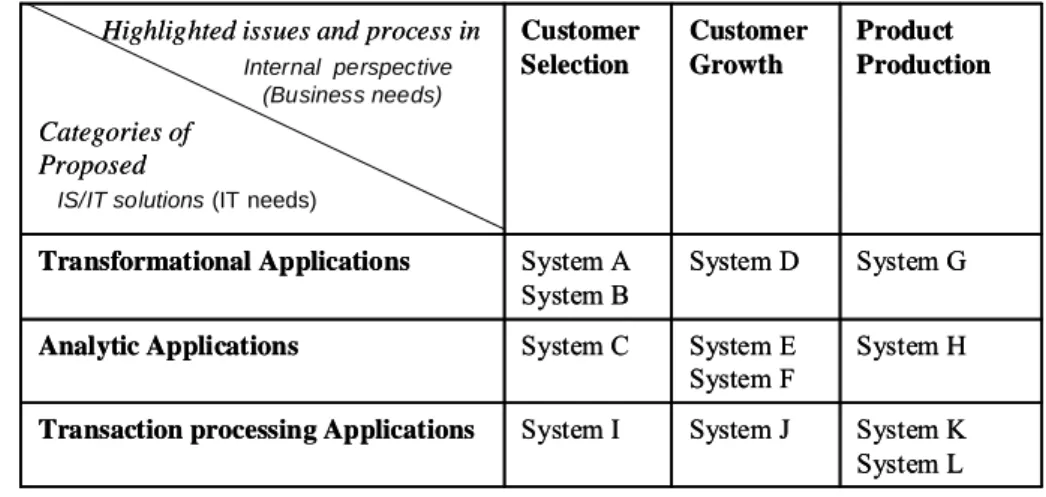
Step 2: Matching IT needs with business needs
As described in Section 2, strategy map approach has categorized three IT
applications based on the information processing needs, or shortly put, IT needs: (1)
transformational applications, (2) analytic applications, and (3) transaction processing
applications. To ensure the proposed IT solutions can align with business needs, we
develop a matrix that matches the IT needs with business needs. Table 1 shows an
example. Assume the company identifies three major business needs with the targeted
business processes: customer selection, customer growth, and product production.
They then propose a portfolio of IT solutions that can improve the underlying
processes. These solutions may fall into one of the three categories of IT needs. For
instance, to improve “customer growth”, there may be more than one candidates of IT
solutions, with some related to transformational application (system D), some analytic
applications (system E and F), and others transactional processing applications
(system J). While these systems are all potential candidates to improve the underlying
processes, the next question is how the company decides which is more critical and
should be invested prior to others? Since each targeted business process can be
enhanced by more than one type of IT solutions, this raises a question “which type of
IT is best aligned with company’s strategy?” We integrate Miles and Snow’s strategic
classification typology (1978) with strategy map to answer this question. Details are
described in Step 3.
System K System L System J
System I
Transaction processing Applications
System H System E System F System C Analytic Applications System G System D System A System B Transformational Applications Product Production Customer Growth Customer Selection
Highlighted issues and process in
Categories of Proposed System K System L System J System I
Transaction processing Applications
System H System E System F System C Analytic Applications System G System D System A System B Transformational Applications Product Production Customer Growth Customer Selection
Highlighted issues and process in
Categories of Proposed
Internal perspective (Business needs)
IS/IT solutions (IT needs)
Step 3: IT alignment assessment
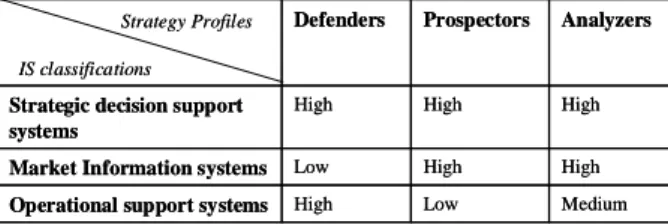
Based on the literature review in Section 2, Miles and Snow (1978) have classified
the firm’s competitive strategies into four types: prospector, analyzer, defender, and
reactor. Sabherwal and Chan’s research (2001) has further suggested that companies
with different competitive strategy should adopt different information applications. In
their research, they have studied the alignment between business and IS strategies,
focusing on three strategic types proposed by Miles and Snow, “prospectors”,
“analyzers”, and “defenders.” They disregarded reactors, because they consider it to
be an organization that either lacks a viable strategy or is in transition from one of the
three ideal strategies to another. For IT strategies, Sabherwal and Chan have
concluded three types of information systems, which happens to be very similar and
related to the three categories of information application identified by Kaplan and
Norton (2006) in terms of definition: (1) Operational support systems (similar with
Kaplan and Norton’s transaction processing applications), (2) Market informational
systems (similar with Kaplan and Norton’s analytic applications), and (3) Strategic
decision support system (similar with Kaplan and Norton’s transformational
applications). For each of the strategy types concerning Miles and Snow’s strategy
classification, Sabherwal and Chan have pointed out different levels of awareness and
attention one should pay to the three kinds of informational systems, ranked from
High, Medium, to Low (shown in Table 2).
Table 2. IS strategy profiles of defenders, prospectors, and analyzers (Sabherwal and
Chan 2001)
Medium Low
High Operational support systems
High High
Low Market Information systems
High High
High Strategic decision support
systems Analyzers Prospectors Defenders Strategy Profiles IS classifications Medium Low High Operational support systems
High High
Low Market Information systems
High High
High Strategic decision support
systems Analyzers Prospectors Defenders Strategy Profiles IS classifications
By combining the research result of Sabherwal and Chan with the strategy maps,
we are able to determine the IT solutions that best aligned with business needs under
different category of competitive strategies. We first classify companies into one of
the three categories (Defenders, prospectors, analyzers) based on Miles and Snow’s
typology, and then highlight the IT solutions that should pay the highest attention and
put them into our initial IT portfolio. An example is shown in Table 3. For the
company that is identified as defender, the systems that belong to transformational
applications and transaction processing applications are highlighted with the color of
“dark gray,” meaning that they belong to top priority investment, based on the
suggestion of the results by Sabherwal and Chan (2000). In contrast, analytic
applications are not highlighted with any color, meaning that they are with lowest
priority. According to Sabherwal and Chan (2000), there is no solution that should be
ranked as medium priority for defenders. In short, throughout this step, we can assure
the portfolio of IT solutions with highest IT-business alignment. Furthermore, we’ve
defined the levels of alignment with each different information systems, ranking them
from high priority to low priority.
Table 3: Initial IT portfolio for defenders
System K System L System J System I Transaction processing Applications System H System E System F System C Analytic Applications System G System D System A System B Transformational Applications Product Production Customer Growth Customer Selection
Highlighted issues and process
Categories of
Proposed IS/IT solutions
in Internal perspective
However, simply using the degree of alignment to justify IT investment priority is
not enough. For instance, although an intended IS investment is highly aligned with
the business strategy, it may be poorly in readiness; employees may not have adequate
knowledge in handling the system, and the basic technology infrastructure of the firm
may not be ready yet. On the other hand, if an IS investment is considered to be
medium-priority investments, but this IT investment is ready in every way, and in
nature it is a cost eliminator, reducing production cost in a very significant way and
creating great value to the company, should this investment still be ranked in the
second place? The two examples show the insufficiency to only consider IT alignment
in IT investments justification. Therefore, in our research framework, after prioritizing
IT investments according to their degree of alignment, we will make some
adjustments based on the assessment of two criteria “e-readiness” and “business
value”.
3.2 IT investments priorities adjustment
To make adjustment among the prioritization of IT investments, we assess an IT
investment from two aspects of considerations: (1) business value and (2) e-readiness.
Based on the literature review in Section 2, we assess the business value of an IT
investment with five criteria, including two financial criteria: (1) operating cost saving,
(2) productivity improvement, and three non-financial criteria: (3) competitive
advantage, (4) improved coordination with partners, and (5) customer satisfaction. As
for e-readiness, we will measure the degree of readiness from three important aspects
of considerations we have identified: (1) organizational readiness, (2) technological
readiness, and (3) environmental readiness. Through calculating the scores of each
aspect, we will get scores to show the levels of business value and e-readiness for
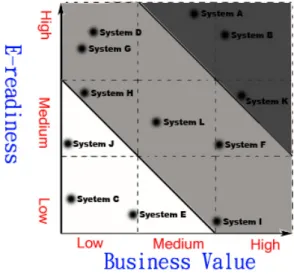
each portfolio element. We will then use a two-axis diagram to show the
corresponding position of an IT investment. Figure 4 provides the two-axis diagram.
The reason of using this two-axis diagram instead of assigning weightings to each
factor is that we cannot judge whether business value or e-readiness shows more
significance. In a matter of fact, there exists some trade-off and connection between
these two criteria. As can be seen from Figure 4, each desired IT investment is plotted
in the diagram according to their corresponding position with regards to business
value and e-readiness. The area colored in “dark gray” is where both business value
and e-readiness are scored highly; for area colored in light gray, it refers to a medium
score on both; and as for area remained uncolored, it means poorly in either business
value and e-readiness or even both.
The next step is to adjust the rankings of our initial IT portfolio. For those IT
investments that are located at the “dark gray” area, their original ranking will shift
one level higher; however, for investments that is already ranked in the “high- priority
investments”, will stay the same; as for IT investments that are located at the “light
gray” area, their ranking won’t be needed for any adjustment; at last, IT investments
located in the uncolored area, their ranking will shift one level lower, however, for
investments that is already ranked in the “low-priority investments”, will stay the
same.
We can use the following example to explain the adjustment process. For instance,
one IT investment is being justified as highly aligned with the business strategy, and
being ranked as “high priority investments”, however, from the assessment of
e-readiness and business value, it shows poorly in both, therefore we shift its ranking
from “high priority investments” to “medium priority investments”. On the other hand,
an IT investment might be ranked as “medium-priority investments” due to the poor
alignment with the business strategy; however in the assessment of e-readiness and
business value, it shows both highly ready and valuable, we then shift its ranking from
“medium priority investments” to “high priority investments.”
Figure 4: The value-readiness matrix
At last, we are able to finalize our priority list. The priorities are sequenced as
“high priority investments” first, then “medium-priority investments”, and at last
“low-priority investments”. In addition, with the investments ranked at the same level,
priorities among them are considered first by their degree of IT alignment. If there are
projects remaining the same priority, we use the score of business value and
e-readiness to justify the ranking, the one with higher score will be chosen first.
4. Application
there are more and more international conventions held in Asia countries rather than
European or North America countries (Chung, 2004). In this trend, of all the
international conventions held in 2006, Taiwan ranked 9
thin all Asia countries, and
Taipei city ranked 8
thin all Asia cities. The output value of MICE (Meetings,
incentives, Conventions and Exhibitions) industry in Taiwan will exceed 10 billion
NT dollars. Due to the high growth potential of MICE industry, Taiwan government
initiates a series of policies to assist the development of MICE industry through
constructing a new Taipei World Trade Center Exhibition hall located in Nangang,
Taipei city, while also assigning TAITRA (Taiwan External Trade Development
Council) to form a new department – “Exhibition Department”, specialized in setting
up the industrial strategies.
It is being noticed by the TAITRI exhibition department that the future trend of
MICE industry will certainly be more internationalized. The exhibitions held are no
longer to satisfy local companies, buyers, or visitors. Also, branding and marketing
will be further stressed, which means the type of exhibitions will shift from
multifunctional exhibitions toward specialized product or industry exhibitions. It is
obvious that MICE industry will become more “Informationalized”, using IT to lower
activity cost, increase the exhibition’s efficiency, and fasten the response to global
market. TAITRA exhibition department recognizes the need to set up a new
internet-based MICE system platform, and wishes the system can process all the
necessary works and services online in order to provide the Taipei World Trade Center
Nangang Exhibition hall a stronger competitive advantage.
Since the platform consist of different applications, it is quite impossible to invest
and implement the whole platform at once. It is necessary to cut down the project into
different phases and build the platform sequentially. The proposed methodology is
implemented and the following is a summary of this particular example.
4.1. Initial IT portfolio
This part of the proposed model is divided into three phases. The first phase
focuses on the clarification of business needs and determination of key focused
processes. The second phase focuses on the matching of IT needs with business focus.
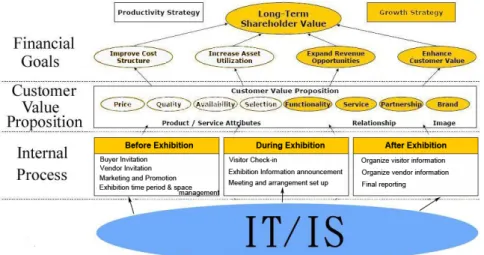
The third phase focuses on the assessment of IT alignment. As seen in Figure 5, the
financial goals of TAITRA are “expanding revenue opportunities” and “enhancing
customer value.” Customer’s value propositions are more toward functionality,
service, partnership, and brand. Three internal processes are proposed to enhance
customer value: (1) “before exhibition”― including the processes of buyer invitation,
vendor invitation, marketing and promotion, and the management of exhibition time
period and space, (2) “during exhibition” ― including the processes of visitors’
check-in, exhibition information announcement, and meeting arrangement, and (3)
“after exhibition” ― including the processes of the management of visitor and vendor
information and final reporting.
Figure 5:
Using the strategy map approach to analyze strategic-focused areas of
TAITRA
Next, the suitable IT applications that can fulfill the needs of the three targeted
internal processes are proposed. In order to determine the most appropriate IT
applications for a targeted process, TAITRA conduct focus group discussions. Table 4
shows the results. Currently, TAITRA does not identify any transformational
applications.
(4) Online Seminar/activity reminder system (3) Vendor management system (3) Instant exhibition information announcement system (2) Exhibition space management system (2) Instant visitor counts technology (1) Identity recognition technology (1) Exhibition time period management system Transaction processing Applications (3) Buyer management system (2) Online match making system (2) Marketing activity management system (1) After exhibition statistic reporting system (1) Marketing activity and commercial news release) (1) Press release and marketing application Analytic Applications Transformational Applications After Exhibition During Exhibition Before Exhibition
Main categories in Internal Categories of
Proposed IT solutions (IT needs)
(4) Online Seminar/activity reminder system (3) Vendor management system (3) Instant exhibition information announcement system (2) Exhibition space management system (2) Instant visitor counts technology (1) Identity recognition technology (1) Exhibition time period management system Transaction processing Applications (3) Buyer management system (2) Online match making system (2) Marketing activity management system (1) After exhibition statistic reporting system (1) Marketing activity and commercial news release) (1) Press release and marketing application Analytic Applications Transformational Applications After Exhibition During Exhibition Before Exhibition
Main categories in Internal Categories of
Proposed IT solutions (IT needs) processes
At last, we apply the strategic classification typology developed by Miles and
Snow (1978) to examine the role TAITRA exhibition department in Taiwan’s MICE
industry. Since TAITRA takes the role as market leader and innovator in Taiwan
MICE industry and is willing to adapt new technologies and new business model,
their strategic role is defined as “Prospector.” We also use Miles and Snow typology
classification tool to confirm this classification
1.
Then, according to Sabherwal and Chan (2001), the main focus of IT for
prospectors should be on transformational applications and analytic applications
(Both ranked as high priority), while transaction processing applications is considered
to be not so important. Therefore, the initial IT portfolio for TAITRA is proposed
below:
High-priority investment: (1) after-exhibition statistic reporting system, (2) buyer
management system, (3) marketing activity management system, (4) marketing
activity and commercial news release system, (5) online match making system,
and (6) press release and marketing application
Medium-priority investment: NONE
Low-priority investment: (1) exhibition time period management system, (2)
exhibition space management system, (3) identity recognition technology,
(4)instant exhibition information announcement system, (5) instant visitor counts
technology, (6) online seminar/activity reminder system, and (7) vendor
management system.
4.2. Priority Adjustment
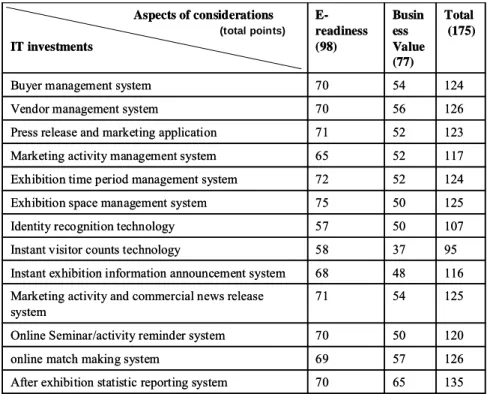
To further improve the initial IT portfolio, a scoring chart with seven-point likert
scale
2is developed to assess benefit value and e-readiness for each proposed IT
application. The result is shown in Table 5. Based on the result, the value-readiness
matrix is developed, as shown in Figure 6.
Table 5. The assessment of business value and e-readiness
135 65
70 After exhibition statistic reporting system
126 57
69 online match making system
120 50
70 Online Seminar/activity reminder system
125 54
71 Marketing activity and commercial news release
system
116 48
68 Instant exhibition information announcement system
95 37
58 Instant visitor counts technology
107 50
57 Identity recognition technology
125 50
75 Exhibition space management system
124 52
72 Exhibition time period management system
117 52
65 Marketing activity management system
123 52
71 Press release and marketing application
126 56
70 Vendor management system
124 54
70 Buyer management system
Total (175) Busin ess Value (77) E-readiness (98) Aspects of considerations IT investments 135 65 70 After exhibition statistic reporting system
126 57
69 online match making system
120 50
70 Online Seminar/activity reminder system
125 54
71 Marketing activity and commercial news release
system
116 48
68 Instant exhibition information announcement system
95 37
58 Instant visitor counts technology
107 50
57 Identity recognition technology
125 50
75 Exhibition space management system
124 52
72 Exhibition time period management system
117 52
65 Marketing activity management system
123 52
71 Press release and marketing application
126 56
70 Vendor management system
124 54
70 Buyer management system
Total (175) Busin ess Value (77) E-readiness (98) Aspects of considerations IT investments (total points)
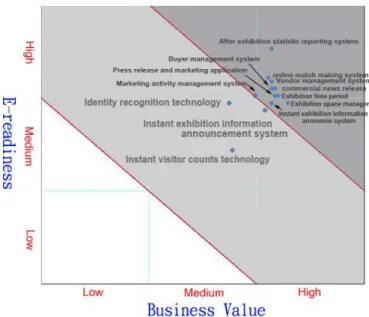
Figure 6.
Value-Readiness Matrix of TAITRA case
As can seen from the matrix, all of the IT investments are situated in the “High-High”
area, except for identity recognition technology, instant exhibition information
announcement system, and instant visitor counts technology. As a result, four ITs that
belong to the category of low-priority investments in the initial IT portfolio are shifted
one level higher into the medium-priority investments, transforming the IT portfolio
into a new priority order:
High-priority investment: (1) After exhibition statistic reporting system, (2)
Buyer management system, (3) Marketing activity management system, (4)
Marketing activity and commercial news release system, (5) Online match
making system, and (6) Press release and marketing application
Medium-priority investment: (1) Exhibition space management system, (2)
Exhibition time period management system, (3) Online seminar/activity reminder
system, and (4) Vendor management system
Low-priority investment: (1) Identity recognition technology, (2) Instant
exhibition information announcement system, and (3) Instant visitor counts
technology
At last, the budget is allocated based on the priority ordering of the IT
investment.
5. Summary and Conclusion
This paper has presented a new IT portfolio approach for justifying IT investment
priorities. The approach, through strategy maps, helps to identify the important
internal processes. A set of IT applications are then proposed to improve these
processes. These IT applications are formed as the initial IT portfolio based on Miles
and Snow’s strategy classification typology. The initial IT portfolio is then adjusted
according to value-readiness matrix. The ultimate goal is to provide a quantifiable
prescriptive model to improve the quality of IT investment. The example presented
here has demonstrated the applicability of the model to support IT investment of
TAITRA; the same model can be applied to other organizations.
There are several unique features about the proposed model. First, the model
provides a powerful tool to complement the strategy maps. Strategy maps are
qualitative in nature and are applied to general business innovations. It include neither
analytical models nor corresponding decision support systems for IT portfolio
management. The proposed model does not eliminate subjectivity completely, but that
is not an attainable or desirable end result. The advantage of the proposed model is
that it adds quantitative precision to an otherwise qualitative decision-making process.
Second, the proposed framework not only incorporate IT strategic alignment, IT
business values, and e-business readiness, but also coordinates them through a
fine-tuning process. The diagrams and matrices resulting from the process allow the
decision maker to examine the sensitivity of IT investment priorities with respect to
changes in competitive strategies and its corresponding business needs, as well as
changes in values and readiness. Finally, the example provided in this paper
demonstrates the applicability and ease of use of the model in different organizations.
This study raises interesting issues that warrant further research. Through this
article has demonstrated the use and benefits of the proposed method, further
evaluation and refinement of the model using additional field studies may prove
beneficial.
References
[1] J. Bacon J, “The Use of Decision Criteria in Selecting Information Systems/Technology
Investments,” MIS Quarterly, 16 (3), 1992, pp. 335-353.
[2] E. F. Bedell, The Computer Solution: Strategies for Success in the Information Age,
Homewood, Dow-Jones Irwin, 1985.
[3] R. Cao, W. Ding, and C. Tian, “Using resource and portfolio management solution to
align IT investment with business,” International Journal of Electronic Business, 4 (3/4), 2006, pp. 239-246.
[4] W. S. C. Desarbo, A. D. Benedetto, M. Song, and I. Sinha, “Revisiting the Miles and
Snow Strategic Framework: Uncovering Interrelationships Between Strategic Types, Capabilities, Environmental Uncertainty, and Firm Performance,” Strategic Management Journal, 26, 2004, pp. 47-74.
[5] J. R. Drake and T. A. Byrd T. A, “Risks in Information Technology Project Portfolio Management,” Journal of Information Technology Theory and Application, 8 (3), 2006, pp. 1-11.
[6] P. B. Escobar, “Information systems investment decisions in business practice: the
Spanish case,” European Journal of Information Systems, 7, 1998, pp. 202-209.
[7] M. Fathian, P. Akhavan, and M. Hoorali, “E-readiness assessment of non-profit ICT
SMEs in a developing country: The case of Iran,” Technovation, 28, 2008, pp. 578-590.
[8] Z. Irani, “Information systems evaluation: navigating through the problem domain,”
Information & Management, 40, 2002, pp. 11-24.
[9] M. Jeffery and I. Leliveld, “Best practices in IT portfolio management,” MIT Sloan
Management Review, 45 (3), 2004, pp. 40-49.
[10] R. S. Kaplan and D. P. Norton, Alignment: Using the Balanced Scorecard to Create Corporate Synergies, Harvard Business Press, 2006.
[11] R. S. Kaplan and D. P. Norton, Strategy Maps: Converting Intangible Assets into Tangible Outcomes, Harvard Business Press, 2003.
[12] J. Karimi, Y. P. Gupta, and T. M. Somers T. M., “The Congruence between a firm’s Competitive Strategy and Information Technology Leader’s Rank and Role,” Journal of Management Information Systems, 13 (1), 1996, pp. 63-88
[13] G. Kearns, “A Multi-Objective, Multi-Criteria Approach for Evaluating IT Investments: Results from Two Case Studies,” Information Resources Management Journal, 17 (1), 2004, pp. 37-62.
[14] J. L. King and E. L. Schrems, “Cost-Benefit Analysis in Information Systems Development and Operation,” Computing Surveys, 10 (1), 1978, pp. 19-34
[15] T. A. Kirkpatrick, “CIOs speak on ROI,” CIO Insight, 1(11), 2002, available via:
www.cioinsight.com, results of questionnaire available via:
common.ziffdavisinternet.com/download/0/1396/0110 rio research.pdf.
[16] C. Lin, Y. A. Huang, and J. Burn, “Realizing B2B e-commerce benefits: the link with IT maturity, evaluation practices, and B2BEC adoption readiness,” European Journal of Information Systems, 16, 2007, pp. 806-819.
[17] J. N. Luftman, “Assessing IT/business alignment,” Information Systems Management. 20 (4), 2003, pp. 9–15.
[18] B. Maizlish and R. Handler R. IT Portfolio Management Step-by-Step: Unlocking the
Business Value of Technology.Wiley, John & Sons Incorporated, 2005.
[19] R. E. Miles and C. C. Snow, Organization Strategy, Structure and Process, McGraw-Hill, New York, 1978.
[20] A. Molla and P. S. Licker P. S., Perceived E-Readiness Factors in E-Commerce Adoption: An Empirical Investigation in a Developing Country, International Journal of Electronic Commerce, 10(1), 2005, pp. 83–110.
[21] S. M. Mutula and P. Brakel P, “An evaluation of e-readiness assessment tools with respect to information access: Towards an Integrated information rich tool,” International Journal of Management, 26, 2006, pp. 212-223.
[22] M. C. A. Nievelt, “Managing with information technology, a decade of wasted money?” Compact, 1992, pp. 15-24.
[23] J. E. Oxley and B. Yeung, “E-Commerce Readiness: Institutional Environment and International Competitiveness,” Journal of International Business Studies, 32 (4), 2001, pp. 705-723.
[24] M. M. Parker, R. J. Benson, and H. E. Trainor H.E, Information Strategy and Economics, New Jersey, Prentice-Hall, 1989.
[25] G. Premkumar and K. Ramamurthy, “The role of interorganisational and organizational factors on the decision mode for adoption of interorganisational systems,” Decision Sciences 26 (3), 1995, pp. 303–336.
[26] T. J. W. Renkema and E. W. Bergout E. W, “Methodologies for information systems investment evaluation at the proposal stage: a comparative review,” Information and Software Technology, 39, 1997, pp. 1-13.
[27] B. D. Reyck, Y. Grushka-Cockayne, M. Lockett, S. R. Calderini, M. Moura, and A. Sloper, “The impact of project portfolio management on information technology projects,” International Journal of Project Management, 23, 2005, pp. 524-537. [28] R. Sabherwal and Y. E. Chan Y. E., Alignment Between Business and IS Strategies: A
Study of Prospectors, Analyzers, and Defenders, Information Systems Research, 12 (1), 2001, pp. 11-33.
[29] J. L. Salmeron, “EIS profitability, costs and benefits: an evolutionary approach,” Industrial Management & Data Systems, 102 (5), 2002, pp. 284-288.
[30] R. Santhanam and E. Hartono, “Issues in linking information technology capability to firm performance,” MIS Quarterly 27 (1), 2003, pp. 125–153.
[31] H. Sheng, F. F. H. Nah, and K. Siau, “Strategic implications of mobile technology: A case study using Value-Focused Thinking,” Journal of Strategic Information Systems, 14, 2005, pp. 269-290.
[32] P. A. Strassmann, Information Payoff, New York, Free Press, 1990.
[33] H. Tavakolian, “Linking the Information Technology Structure with Organizational Competitive Strategy: A Survey,” MIS Quarterly, September 1989, pp. 309-317.
[34] C. Verhoef, “Quantitative IT portfolio Management,” Science of Computer, 45, 2002, pp. 1-96.
[35] H. J. Wen and S. C. Shih, “Strategic Information Technology Prioritization,” The journal of Computer Information Systems, 46 (4), 2006, pp. 54-63.
[36] J. W. Weiss, A. Thorogood, and K. D. Clark. “Three IT-Business Alignment Profiles: Technical Resource, Business Enabler, and Strategic Weapon,” Communications of the
Association for Information Systems, 18, 2006, pp. 676-691
[37] L. Willcocks and S. Lester, “Assessing IT productivity: Any way out of The Labyrinth?” In: Willcocks, L., Feeny, D., Islei, G. (Eds.), Managing IT As A Strategic Resource. McGraw-Hill, Maidenhead, 1997, pp. 64–89
(二) 計畫成果自評
在全球化及技術急遽變遷的今日,企業所面臨的是嚴峻且極具考驗的競爭環境,
在此挑戰之下,企業依賴資訊系統的程度更勝以往。企業依賴資訊系統不僅是在
應付日常的營運,更希望能藉此建立競爭優勢。因此,企業在有限資源的條件之
下,如何評量資訊系統的價值,並且投資一項『對』的且『重要』的資訊系統,
為企業當下刻不容緩的議題。在此需求之下,本研究所建立的資訊系統投資組合
的方法論,可提供企業一個完善的工具幫忙評估及決定資訊系統的投資組合,並
且根據三項指標:
(1)資訊技術調準 (IT alignment),
(2)商業價值 (business
value),(3) E 化準備度來衡量投資組合內每項資訊系統投資的優先順序。本研
究並以個案研究的方式驗證本方法論的信度及可行性。
由於在財務管理的理論裡,財務投資組合已經有定義完善的方法論,相較之下,
在資訊管理的領域裡,資訊系統的投資組合一直欠缺一套有理論基礎之方法架
構。因此本研究研擬出來的方法論,能幫助(1)實務界評估資訊系統投資及(2)
研究者進一步瞭解資訊系統投資組合的理論及應用。
本計畫之研究成果豐碩。在過去一年中,階段性之研究成果已有五篇國際會議論
文(Three articles in the 2011 International Joint Conference on Service Sciences, one
article in the 44
thHawaii International Conference on System Science, and one article
in the 15
stPacific Asia Conference on Information Systems)以及一篇期刊論文
出席國際學術會議心得報告
本人出席兩場國際學術會議,並發表論文。其心得報告暨論文全文分述如下:壹、HICSS—第 44 屆夏威夷國際系統科學會議
計畫編號 NSC 99-2410-H-004-103 計畫名稱 建構 IT 投資組合評量之方法論 出國人員姓名 服務機關及職稱 張欣綠,國立政治大學資訊管理學系 會議時間地點 Howaii, U.S.A. 會議名稱 中文:第四十四屆夏威夷國際系統科學會議英文:The Fourty-fourth Hawaii International Conference on System Sciences 發表論文題目 Using the portfolio method to justify IT investments: a case study
一、
參加會議經過
This year, ten topics were arranged in the conference: architecture, cloud computing, consumer-focused processes, crisis management, cross culture, data mining, ethics, H-C interactions, security, and social networks. There are also one keynote and one distinguished lecture: Cynthia Breazeal and Larry Smarr. The conference was sponsored by IEEE computer society and University of Hawaii. Combining all the varieties, this conference has significant impacts on information systems research. Recent research that shows HICSS ranked second in citation ranking among 18 Information Systems (IS) conferences, ranked third in value to the MIS field among 13 Management Information Systems (MIS) conferences, and ranked second in conference rating among 11 IS conferences.
Dr. Cynthia Breazeal made the conference keynote. She is an associate professor at the MIT Media Lab where she founded and directs the Personal Robots Group. She is a pioneer of Social Robotics and Human Robot Interaction. In her speech, she highlighted a number of provocative research findings that illuminate the social attributes of personal robots. An important goal of her lab is to use socially interactive robots as a scientific tool to understand human behavior, to design machines that can engage us on social and emotional levels, and to use these insights to create robotic technologies that can enhance human performance and quality of life with specific applications in healthcare, education, entertainment, and telecommunication.
二、
與會心得
Two interesting papers are discussed in the sessions that I have participated. I summarize the discussion results as follows.
[Complexity in information systems design]
Owen and Linger present an information systems design project in an Australian government department. This project has been used in the department as a vehicle for organizational change and value creating for the organization. Through this empirical study it demonstrates the need to expand the repertoire of project management methods, processes, techniques and tools to deal with this complexity aligning with the ‘rethinking project management’ agenda.
[Project management systems]
Karayaz, Keating, and Henrie aim to develop the concept of project management system from the perspective of system science. They develop the background and define a perspective of project management systems. Then a model for project management system is developed from systems sciences and management cybernetics. Their initial explorations are promising, demonstrated by a case study application review using a complex system of systems (SoS) project encompassed multiple government agencies, and they offer future directions and implications for further model refinements, applications and research into project management systems.
參、 建議
Comments to the paper are summarized below.
[Research question]
The paper needs a more focused set of research questions. Currently the ‘main question… is how IT decision to be made’ (Author’s terms.). Is this actually what the paper is about? You don’t present much evidence on how IT investment decisions are actually made so I am not sure that this should be your central question. Also at the end you state that you have presented an IT portfolio approach for justifying investment decisions – this is not the same as making investment decisions so I am now unclear about what it is your portfolio approach is really intended to do.
1.
[Research methodology]
1. One main concern about the method you develop though is that it is premised on very
straightforward linear assumptions about how decisions are/should be made (step 1 - identify business needs/priorities, step 2- match IT needs to business needs... step 6 budget
rational/linear approach to IT systems development has been heavily critiqued in existing literature. There is a lot of rather simialr work on Business Requirements Planning, for example (that you do not really refer to) and that has been subject to the same critque. Your model assumes, for example, that priorities are set prior to budget allocations and in the absence of political interests . As your method also follows this step by step approach it is, unfortunately, subject to the same critique as this earlier work.
2. Another concern here (as again most of what is discussed is self-evident across much of the IT literature) is the use of Miles and Snow’s typology to define competitive strategy. This is somewhat dated and across many sectors today – particularly those characterised by
significant IT investment - anything other than a prospector approach (in Miles and Snow’s terms) would not offer competitive advantage. I would therefore have preferred to have a seen more recent strategic typolgies discussed or applied. In addition some critique of the idea that all systems can be neatly characterised as either offering strategic decision support, market information or operational support would have been useful as many IT systems today, such as ERP systems, have multiple functionality. Nevertheless the approach that is discussed in the following sections is systematically developed and the case example does help to contextualise how this approach could be used in practice in order to develop a more systematic and sensitive approach to IT investment prioritisation.
肆、 攜回資料名稱及內容
A. Conference paper abstracts B. Conference program outline
C. Revision strategy and comments to my presented paper
伍、發表論文
Developing an IT Portfolio Approach to Justify IT Investments
Hsin-Lu Chang National Chengchi University
Jeff Chang
National Chengchi University 96356012 @nccu.edu.tw
Kai Wang
National University of Kaohsiung [email protected]
Abstract
Due to the rapid speed of globalization and evolving technologies, firms rely on IT much heavier than before. They use IT not just to cope with the environment, but also to gain competitive advantages. Therefore, it is important for firms to invest on the right while also critical IT with limited resources. To
fulfill this need, this research aims at developing an IT portfolio method to evaluate and determine the priorities of IT investments based on three criteria: IT alignment, business value, and e-readiness. A real business practice serves as a case to demonstrate the applicability of our proposed framework. We believe the final findings are helpful to (1) practitioners who
can use this framework to justify their IT investments; and (2) researchers who can build upon this model to further examine the application of IT portfolio methods.
1. Introduction
Today, investments in IT have constituted up to 50% of the annual capital expenditures of large organizations (Willcocks and Lester, 1997; Premkumar and Ramamurthy, 1995). A survey of 400 top IT executives has shown that 60% of them reported an increase in the level of pressure to prove return on IT investment (ROI), 70% believe that their metrics do not fully capture the value of IT, and nearly half lack confidence in their ability to accurately calculate ROI on IT investments (Kirkpatrick, 2002). The results highlight the importance of IT investment decision process. The main question that should be asked is how IT decision to be made. To answer the question, the focus is on the design of the methodologies that can be used for IT investment decision.
Numerous researchers have done great contributions in this area. Among them, IT portfolio approach has gained great awareness. Similar to the portfolio management framework utilized in the financial services sector, IT portfolio approach is a combination of people, processes, and corresponding information and technology that senses and responds to change. The goal is to deliver measurable business value, tangible and intangible, while aligning and improving the business and strategy (Maizlish and Handler, 2005). The uniqueness and advantage of IT portfolio is that it considers various business needs and different IT investment evaluation methodologies to form an ideal investment decision process. But controversially, that is also where its disadvantages reveal.
Traditional IT portfolio approach takes each business concern as single criteria, which in some way we can take it as an extension of the multi-criteria approach. However, are all the criteria, such as IT alignment, risk, value, IT maturity, IT readiness, financial constraints, etc. with the same importance? Is there any criteria that should be paid more attention to than the others? Is there any sequence among all decision criteria? One that should be evaluated first, then comes the rest?
This research aims at proposing a revised IT portfolio approach to solve these issues. We will start from defining important concepts in the IT investment domain, then forming and explaining our methodologies. Afterwards, a case study will be
proposed to demonstrate the efficacy of our proposed methodology.
2. Literature review
Since this research aims to apply IT portfolio approach to justify IS investment, it is important for us to know why this approach is useful and how we are going to use it. The literature review will focus on two aspects:
1. Tools that are used to evaluate IT investment and develop IT portfolio.
2. The weighting and scoring methods that have been applied to prioritize and rank investments in the portfolio.
2.1. The IT investment evaluation method
To determine what IT investment should be made, two questions are important: (1) “How is the investment decision made?” and (2) “why is the investment decision made?” The first question links to the decision-making methodology and the second addresses the criteria followed in the process (Escobar 1998).
With regard to decision-making process, Renkema and Berghoutb (1997) have distinguished four basic approaches that can be recognized in many methods proposed:
1. The financial approach– focuses on the incoming and outgoing cash flows as a result of the investment made. Examples include ROI, the payback period, the internal rate of return, the net present value, and so on.
2. The multi-criteria approach– begins with a number of goals or decision criteria, and then assigns each with proper scores and weighting to create one single measure for each investment for justifying the priority of IT investments. One famous method in this category is the “information economics method” proposed by Parker et al (1989), which evaluates an IT investment with criteria from three domains: (1) enhanced ROI, (2) business domain, and (3) technology domain.
3. The ratio approach – pays attention to the possibilities to compare organizational effectiveness by means of ratios. Several ratios have been proposed to assist in IS investment evaluation. Examples of meaningful ratios include IS expenditures against total turnover and all yielding that can be attributed to IS investments against total profits. Ratios do not necessarily take only financial figures into account. IS expenditures can, for instance, be related to the total number of