103
DOES GOVERNANCE MECHANISM AFFECT THE
DISCLOSURES OF TOP MANAGEMENT’S
COMPENSATION?
CHUN HO CHEN
Department of Accounting, National Chung Hsing University
YUN SHENG HSU
Department of Accounting, National Chung Hsing University
TZU-CHING WENG
Department of Accounting, Feng Chia University
HSIN YI CHI*
Department of Accounting, National Chung Hsing University
ABSTRACT
The paper examines the role of corporate governance in the disclosure of top management’s compensation. We find that companies with higher levels of top management shareholding provide greater transparency in their compensation disclosures. By contrast, firms with a higher proportion of executive directors, the greater divergence between the control and cash flow rights and CEO duality, will have a lower transparency of compensation disclosures. In summary, our findings suggest that firms with weaker governance mechanism have a greater agency problem and a lower transparency of top management’s compensation disclosures.
Keywords: corporate governance, disclosure, compensation, information transparency (Received: July, 2012; 1st revised: November, 2012; 2nd revised: December, 2012;
INTRODUCTION
Prior studies indicate that corporate governance has a significant impact on the level of executive compensation. However, few studies investigate the relation between the transparency of executive compensation disclosure and governance structures. The purpose of this paper is to examine whether there is an association between the disclosure transparency of top management’s compensation and the effectiveness of governance structures in Taiwan.1 More specifically, we aim to determine whether the transparency of top management’s compensation is lower among Taiwanese firms with weaker governance structures. Several large financial scandals, such as Enron, WorldCom, etc., have raised concerns regarding top management’s compensation. Regulators argue that the mandated disclosures of top management’s compensation mitigates the information asymmetry between top management and outside shareholders, thus this strengthening disclosures will lessen the agency conflict and improve corporate governance. Several studies find that top executives receive greater compensation in firms with weaker governance structures (e.g., Lambert, Larcker, & Weigelt, 1993; Yermack, 1996; Core, Holthausen, & Larcker, 1999). In this study, we go one step further by examining whether the transparency of top management’s compensation disclosures is lower among firms with weaker governance structures.
In 1992, the U.S. Securities and Exchange Commission (SEC) adopted regulations that increased the quality and quantity of top management’s compensation disclosure. The purpose of these regulations was to improve corporate governance by increasing the transparency of compensation disclosures. In 2002, after several financial scandals, the U.S. Securities and Exchange Commission (SEC) announced the Sarbanes-Oxley Act required more stringent compensation disclosures of top management. In 2005, Hong Kong Exchanges (HKEx) followed suit by requiring all listed companies to disclose the compensation paid to their top management. In the same period, the regulators of
1 In this paper, top management is defined as including top executives and board directors. We find that the
chief executive officer, CEO (or called president) and board chair of the board are the two most powerful persons in most Taiwanese companies. Hence, in investigating the transparency of top management’s compensation, we especially focus on the compensation disclosure of the CEO and the board chair of the board, while also considering the compensation disclosures of vice-presidents.
European countries required compensation transparency reporting of top management. Based on the above statements, it is apparent that the regulation trend toward stronger governance mechanisms was aimed at increasing the transparency of top management’s compensation. In order to improve information transparency, the regulatory agencies of Taiwan announced in 1995 “The Guidelines of Financial Statements by Securities Issuers,” which requires public companies to disclose information regarding the compensation paid to directors and top executives.2 However, Wu (2005) indicated that some Taiwanese listed firms failed to comply with the mandated disclosure regulations of the compensation paid to the board chair and the CEO. This finding motivated us to examine the disclosure of top management’s compensation in Taiwan and the determinants of compensation disclosure.
We examine whether there is an association between governance mechanisms and the disclosure transparency of top management’s compensation of Taiwanese listed companies. The results indicate that companies with higher levels of shareholding in their top management tend to comply with the compensation disclosure rules. Whereas firms with a greater divergence between the control rights and cash flow rights of the controlling shareholder tend not to comply with the rules, and also to the dual role of the CEO and the board chair. Further, we find that companies with higher levels of shareholding in top management provide greater transparency in the disclosure of their compensation. By contrast, companies with a higher proportion of executive directors, the greater divergence of ownership structure of the controlling shareholder, and, if the board chair is also the CEO, the results show lower transparency in their disclosures of top management’s compensation. In summary, our findings suggest that firms with weaker governance structures have a greater agency problem which leads to a lower transparency of top management’s compensation disclosures.
Our study contributes to the existing literature in several ways. First, in contrast to prior studies (Bassett, Koh, & Tutticci, 2007; Laksmana, 2008; Chizema, 2008), this
2 The regulations of top management compensation disclosure in Taiwan require that each of the directors
and the CEO (or called president) disclose his or her compensation separately. However, the compensation can be combined for other executives, e.g., vice-presidents, provided they are on the same level within the firm hierarchy.
study considers the controlling-minority shareholder agency problems of East Asian corporations. The findings have already been noted as follows: firms with a greater divergence between the control rights and cash flow rights of the controlling shareholder tend not to comply with the compensation disclosure rules and have a lower transparency of top management’s compensation disclosures. Second, our study examines the relation between corporate governance structures and the disclosure transparency of top management's compensation. Unlike previous research (Coulton, James, & Taylor, 2001), we find a statistically significant relation between corporate governance structures and compensation disclosures. Third, this paper try to emphasis new regulation of top management’s compensation disclosures are too ambiguous and low transparency. This new revision of top management’s compensation disclosures will violate the world trend of improving corporate governance, then the investors, the creditors and financial press will not to monitor excess compensation of top management. This paper hopes to raise concern about the topic. The conclusions of this paper will provide the reference for government authority to revise compensation disclosure regulation in the future.
The remainder of this paper is organized into seven sections. In section 2, we review the prior literature on corporate governance and the disclosure of executives’ compensation. In section 3, we develop the research hypothesis, construct the empirical model and define the variables. Section 4 describes the data and presents descriptive statistics. The empirical results and sensitivity test are discussed in section 5. Finally, section 6 provides a summary and conclusion.
DISCLOSURE REGULATIONS OF TOP MANAGEMENT’S
COMPENSATION AND LITERATURE REVIEW
Disclosure Regulations in Taiwan
In order to improve information transparency, the regulatory agencies of Taiwan announced in 1995 “The Guidelines of Financial Statements by Securities Issuers,” which requires public companies to disclose information regarding the compensation paid to directors and top executives in the footnotes of financial statements. Since 2001, Taiwan
has required public companies to disclose top management’s compensation in proxy statements. The regulations of top management compensation disclosure in Taiwan require that each of the directors and the CEO (or called president) disclose their compensation separately. Nevertheless, the disclosure of vice-presidents’ compensation can be combined with that of other vice-presidents. In this study, it is found that some companies have not fully complied with the compensation disclosure rules and have lower transparency in their disclosure of top management’s compensation. This paper tries to examine whether the disclosure transparency of top management’s compensation is affected by governance mechanisms.
Literature Review
Prior studies have examined the determinants of the equilibrium level of disclosure; these studies indicate that firm characteristics such as firm size, growth opportunity, firm performance, the demand of outside financing, and analyst following to determine the equilibrium level of disclosure (Lang & Lundholm, 1993; Frankel, McNichols, & Wilson, 1995). In addition, Beekes and Brown (2006) find that firms with better governance quality make more informative disclosures.
According to entrenchment hypothesis (La Porta, Lopez-de-Silanes, & Shleifer, 1999; Claessens, Djankov, & Lang, 2000; Yeh, Lee, & Woidtke, 2001; Fan & Wong, 2002), when governance structures is weaker, then the agency conflict between inside managers and outside shareholders is more serious. Many studies indicate that governance mechanisms affect voluntary disclosures and mandatory disclosures (Ho & Wong, 2001; Eng & Mak, 2003; Gul & Leung, 2004; Chen & Courtenay, 2006; Chen & Hsu, 2007; Kelton & Yang, 2008; Chau & Gray, 2010). These studies indicate that agency problems will be more serious when governance mechanisms are weaker. Therefore, weak governance structures will lead to lower information disclosures.
Prior studies indicate that firms with weak governance structures pay greater compensation to top management (Lambert et al., 1993; Yermack, 1996; Core et al., 1999). However, few studies investigate the relation between the transparency of
executive compensation disclosure and governance structure. Coulton et al. (2001) find that the transparency degree of compensation disclosure is negatively related to the level of CEO compensation, and is positively related to firm size. This means that if the level of CEO compensation is higher and the firms are smaller, then the transparency of compensation disclosure will be lower. However, Coulton et al. (2001) find no relation between specific governance structures and the transparency of CEO compensation disclosure. Lang and Lundholm (1993) also indicate that disclosure scores have a positive relation with firm size, firm performance, and security issuance. Bassett et al. (2007) examine the disclosures of employee stock options (ESO) and find that external auditor quality has a positive association with ESO disclosures, while the dual role of the CEO and board chair is associated with a lower level of ESO disclosures. Laksmana (2008) finds that board (compensation committee) meeting frequency and board (committee) size are positively associated with the transparency of the disclosures of executive compensation practices. Chen (2010) document that firms with greater unexpensed and estimated abnormal compensation are less motivated to comply with compensation disclosure rules, and there is lower disclosure transparency of top management’s compensation of these firms. Finally, Robinson, Xue, and Yu(2011) indicate that noncompliance with mandatory compensation disclosures are positively associated with excess CEO compensation and media criticism of CEO compensation during the previous year.
Several studies indicate that implementing the compensation disclosure regulations would improve firm performance. Nikos and Zaharoulla (1998) document that top executive compensation showed a significant relation with operation performance after the U.S. SEC adopted the new compensation disclosure rules in 1992. In addition, Kin (2003) finds that implement compensation disclosure regulations are helpful in improving the return on equity and stock return.
HYPOTHESIS DEVELOPMENT
Prior studies indicate that firm characteristics such as firm size, growth opportunity, firm performance, the demand of outside financing, and analyst following to determine the equilibrium level of disclosure (Lang & Lundholm, 1993; Frankel et al., 1995). In this paper, we examine the association between key governance mechanisms and the disclosure transparency of top management’s compensation.
According to the interest convergence hypothesis (Jensen & Meckling, 1976), when managers own more shares, the agency conflict between inside managers and outside shareholders is lessened. Ahigh shareholding may therefore result in greater disclosure, thus reducing agency costs (Leftwich, Watts, & Zimmerman, 1981). There is more interest convergence between firm value and top management when top management’s shareholding is greater, and it leads to a more transparent disclosure policy. In contrast to the above argument, prior studies indicate different findings that managerial ownership is negatively associated with voluntary disclosure (Eng & Mak, 2003; Kelton & Yang, 2008).
Overall, prior research provides mixed evidence on the link between the level of disclosure and top management’s shareholding. By the way, we expect the relation between compensation disclosure and top management’s shareholding is not clear. Accordingly, these competing explanations lead to the following nondirectional hypothesis stated in alternative form:
Hypothesis 1(a): The disclosure transparency of top management’s compensation is positively associated with top management's shareholding.
Hypothesis 1(b): The disclosure transparency of top management’s compensation is negatively associated with top management's shareholding.
In contrast to the U.S., most companies in Taiwan are family controlled. Under a concentrated ownership environment, the derived agency problem is the wealth expropriation by the controlling shareholder (e.g., La Porta et al., 1999; Claessens et al., 2000; Fan & Wong, 2002; Lee & Yeh, 2004). In a family-controlled ownership there are
close ties between the controlling family and top management, and a separation between the control rights and the cash flow rights of controlling shareholder. The controlling shareholder usually has significant control rights in excess of their cash rights through pyramid structures and cross-holding (La Porta et al., 1999). We argue the greater the deviation between control rights and cash flow rights of controlling shareholder, the greater the motivation will be to expropriate minority shareholders by lowering the transparency of compensation disclosures. Based on the above argument, this paper proposes a second hypothesis:
Hypothesis 2: A divergence between the control rights and cash flow rights of the controlling shareholder is negatively associated with the disclosure transparency of top management’s compensation.
Chen and Jaggi (2000) document that the ratio of the proportion of independent non-executive directors on corporate boards is positively associated with the finnancial disclosures. Cheng and Courtenay (2006), Kelton and Yang (2008), Chau and Gray (2010) also provide the same evidences. In addition, Laksmana (2008) documents that (outside) independent directors whose reputation are at stake are more likely to report more detail of compensation practices than (inside) executive directors. In general, more outside independent directors on the board means the board has less inside executive directors, and vice versa. Based on self-interest motivation of providing unclear executives compensation, more executive directors on the board has less monitoring effectively lead to lower transparency of compensation disclosures
We argue that a higher proportion of executive directors on the board will result in less effective monitoring of the compensation disclosure policy. Our third hypothesis states this:
Hypothesis 3: The proportion of executive directors on the board is negatively associated with the disclosure transparency of top management’s compensation.
When the CEO also serves as the board chair of the board, excessive compensation to the top management is likely to result, along with the adoption of a less transparent compensation disclosure policy. Yermack (1996) documents that the agency problem is higher when the CEO is also the board chair. Bassett et al. (2007) indicate that an executive occupy the dual role of board chair and CEO is associated with a lower level of ESOs disclosures. Also, Core et al. (1999) indicate that firms pay greater CEO compensation when the CEO is also the board chair. We argue that the disclosure of top executive compensation is less transparent when the CEO plays this dual role. Our fourth hypothesis states this:
Hypothesis 4: The dual role of CEO and board chair is negatively associated with the disclosure transparency of top management’s compensation.
EMPIRICAL MODEL AND VARIABLES MEASUREMENT
In this study, we measure the disclosure transparency of top management’s compensation by assessing whether the disclosures fully comply with Taiwan’s regulations. We use the Binary Logit model to test the effect of governance mechanisms on firm compliance with the regulations. In addition, we employ the Ordered Logit model to test the effect of governance mechanisms on the transparency ranking of top management’s compensation. We examine whether there is an association between key governance structure and the disclosure transparency of top management’s compensation of Taiwanese listed companies. We do not attempt to examine all possible governance mechanisms; we only focus on key governance mechanisms.
The empirical model of estimated variables for firm i at time t is as follows:
COMP_TRANSP it=β0+β1 HOLD it+β2 DIVER it+β3 EXEDIR it+β4 DUAL it+ β5 Ln COMP it
+Β6 Ln SIZE it+β7 ROA it+β8 GROWTH it-2,t+β9 LEV it+β10 AQ it
+
j
γj INDij +
kThe definition and measurement of variables are explained as follows:
COMP_TRANSP1 = The first transparency measure of top management’s compensation
disclosures. A dummy variable equals to one if the disclosures of top management’s compensation fully comply with the regulations (greater disclosure transparency), and zero otherwise (lower disclosure transparency).3 The regulations of top management compensation disclosure in Taiwan that require each of the board chair, the directors and the CEO(or called president) have to disclose their compensation separately, but each vice-president’s compensation could be combined to disclose with the same hierarchy of other vice-president(s).
COMP_TRANSP2 = The second transparency measure of top management’s compensation
disclosures. There are four transparency rankings (Ranks 1, 2, 3 and 4) of top management compensation disclosures.4 This paper refers to Chen (2010) to classify the transparency ranking of compensation disclosure into 1, 2, 3, and 4. HOLD = Top management’s shareholding at the year end. The top management’s
shareholding is the percentage of outstanding shares owned by the directors, CEOs and vice-presidents.
DIVER = The divergence between control rights and cash flow rights of the controlling shareholder.
EXEDIR = The proportion of executive directors on the board.
DUAL= The dual role of CEO/board chair. A dummy variable equals to one if the CEO is
3 The regulations of top management’s compensation disclosure in Taiwan require that each of the
directors and the CEO (or called president) disclose their compensation separately. However, the disclosure of the vice-presidents’ compensation can be combined with that of other vice-presidents.
4 In the second transparency measure, we classified four transparency ranking, where Rank 1 and Rank 4
were the lowest and the highest ranking, respectively. Firms were classified as Rank 1 if they disclosed the aggregate amount of the board chair’s compensation, or if the compensation of the CEO was combined with that of other directors and executives.Firms that did not disclose their vice-presidents’ compensation were classified as Rank 2. If firms separately reported the disclosure of the board chair’s compensation and CEO compensation, and the compensation of the vice-president was combined with that of other executives on the same hierarchical level, the firms were classified as Rank 3. If the firms separately reported the disclosure of the board chair’s compensation and CEO compensation, and the vice-presidents’ compensation was also separately listed, the firms were classified as Rank 4.
also the board chair of the board, and zero otherwise.
Ln COMP= The natural logarithm of the sum of the fair value of the board chair’s and CEO’s compensations.5
Ln SIZE = The natural logarithm of the firm’s net sales.
ROA= The ratio of earnings before interest and taxes to total assets. Return on assets (ROA) is a profitability measurement in this paper used to control the effect of profitability on the disclosure of top management’s compensation.
GROWTH=Growth opportunities as measured by the 3-year average market-to-book
value ratio of total assets.
LEV= Debt ratio defined as total liability divided by total assets.
AQ= The auditor specialist, which captures auditor quality. All firms have equal industry market shares for the continuous variable specification. We calculate an auditor's industry market share to proxy for the assets of clients audited by an auditor in the industry.6
IND= Dummy variables to control for industry effect. YEAR= Dummy variables to control for year effect.
DATA AND DESCRIPTIVE STATISTICS
Data
This study examines the association between governance mechanisms and the top management’s compensation disclosures of companies listed in the Taiwan Stock Exchange (TSE). The data were mainly collected from the Taiwan Economic Journal (TEJ) database. The disclosures of top management’s compensation were hand-collected from the financial statement or proxy statement on “Market Observation Post System” of
5 In the sensitivity analysis, we also use the estimated excess compensation of top management to test the
effect of governance on compensation disclosure. These results see later section 6-2.
6 Prior studies indicate that industry specialist auditors ensure more complete, relevant, and reliable
information, and therefore higher disclosure quality (Dunn and Mayhew, 2004; Almutairi, Dunn and Skantz, 2009).
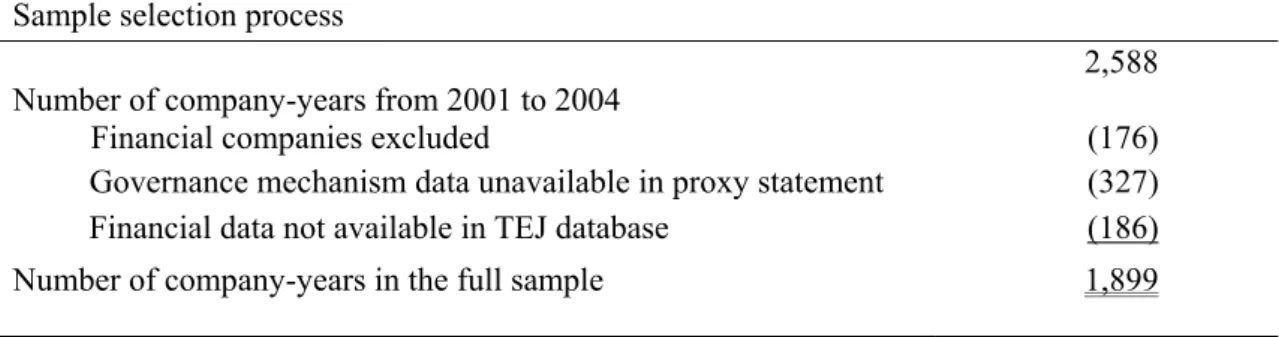
Taiwan listed companies (MOPS, http://mops.twse.com.tw/index.htm). In order to compute the proxy measurement of growth opportunity, we needed three years data prior to the sample year for the market-to-book value ratio of total assets. After deleting companies with incomplete data, the final sample consisted of 1899 observations listed in the TSE during 2001 to 2004. 7 The sample selection process is presented in Table 1.
TABLE 1 Sample selection Sample selection process
Number of company-years from 2001 to 2004
2,588
Financial companies excluded (176)
Governance mechanism data unavailable in proxy statement (327) Financial data not available in TEJ database (186) Number of company-years in the full sample 1,899
Descriptive Statistics Analysis
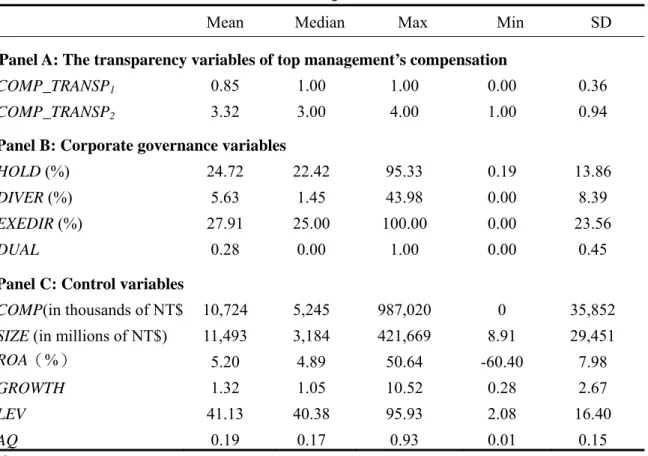
The descriptive statistics for the transparency variables of top management’s compensation, governance mechanism variables and other control variables of the sample firms are reported in Table 2. We find that the mean of the dummy variable for whether the disclosures of top management’s compensation fully comply with the regulations (COMP_TRANSP1) is 0.85. This means that, on average, 85% of the sample firms comply with the regulations. The mean of the transparency ranking of top management’s compensation (COMP_TRANSP2) is 3.32, which shows that the average transparency ranking of compensation disclosure is between 3 and 4. The median was 3 which showed that more than half of the sample companies had the higher transparency ranking in relation to the compensation disclosures. 8
7 The regulation is that companies should disclose the compensation information of top management in
detail before 2004. But in new regulation since 2005, companies just have to divide the compensation to several ranges and only disclose the number of top management in each compensation range. Due to the regulation change of top management compensation disclosure since 2005, we cannot evaluate the disclosure transparency of top management’s compensation, so this paper cannot do empirical test after 2005. Hence, this paper set the sample period up to 2004.
8 This paper use Taiwan Semiconductor Manufacturing Company (TSMC) as an example to demonstrate
how to estimate the disclosure transparency. The paper searches the compensation disclosure information from financial statement on MOPS website. The compensation disclosure of TSMC in 2003, we can found the company separately reported the disclosure of the board chair’s compensation and CEO compensation, and the compensation of the vice-president was combined with that of other executives on the same hierarchical level. The disclosures of top management’s compensation just fully comply with the regulations, so we set COMP_TRANSP1 equal to 1, and COMP_TRANSP2 is classified as Rank 3.
With respect to corporate governance structure, the average shareholding of the directors, the CEO (or called president) and vice-president are 24.72%. In East Asia, most companies have a greater deviation of control rights from cash flow rights than in America and Europe. The mean divergence of control rights and cash flow rights is 5.63%. The mean proportion of executive directors on the board is 27.91%, and the maximum is 100%, which shows that all of the directors concurrently serve as top executives. The CEO is also the board chair in about 28% of the sample firms.
TABLE 2 Descriptive statistics
Mean Median Max Min SD
Panel A: The transparency variables of top management’s compensation
COMP_TRANSP1 0.85 1.00 1.00 0.00 0.36
COMP_TRANSP2 3.32 3.00 4.00 1.00 0.94
Panel B: Corporate governance variables
HOLD (%) 24.72 22.42 95.33 0.19 13.86
DIVER (%) 5.63 1.45 43.98 0.00 8.39
EXEDIR (%) 27.91 25.00 100.00 0.00 23.56
DUAL 0.28 0.00 1.00 0.00 0.45
Panel C: Control variables
COMP(in thousands of NT$) 10,724 5,245 987,020 0 35,852
SIZE (in millions of NT$) 11,493 3,184 421,669 8.91 29,451
ROA(%) 5.20 4.89 50.64 -60.40 7.98
GROWTH 1.32 1.05 10.52 0.28 2.67
LEV 41.13 40.38 95.93 2.08 16.40
AQ 0.19 0.17 0.93 0.01 0.15
Note:
COMP_TRANSP1 = A dummy variables equal to one if the disclosures of top management compensation
fully comply with the regulations, and zero otherwise. The regulations of top management compensation disclosure in Taiwan that require each of the board chair, the directors and the CEO(or called president) have to disclose their compensation separately, but each vice-president’s compensation could be combined to disclose with the same hierarchy of other executives.
COMP_TRANSP2 = The transparency ranking (Rank 1, 2, 3, and 4) of top management’s compensation
disclosures were classified in this paper. It was classified as Rank 1 if the firms disclose the aggregate amount of board chair compensation or CEO compensation was combined with other directors and executives. If the firms have not to disclose their vice-presidents’ compensation was classified as Rank 2. It was classified as Rank 3 if the firms disclose board chair’s compensation and CEO compensation were separately listed and vice-presidents’ compensation was combined with the same hierarchy of other executives. If the firms disclose board chair compensation and CEO compensation were separately listed and vice-presidents’ compensation were also separately listed was classified as Rank 4.
HOLD =The directors’ shareholding is the percentage of outstanding shares owned by top management,
including the directors, CEO and vice-presidents.
DIVER= The divergence between control rights and cash flow rights of the controlling shareholder. EXEDIR=The proportion of executive directors in the board.
DUAL =A dummy variable equal to one if the CEO is also board chair of the board, and zero otherwise. COMP =The sum of fair value of the board chair and CEO compensation.
SIZE =The firm size is measured by firm’s net sales.
ROA = Return on assets is defined as the ratio of earnings before interest and taxes to total assets. GROWTH =Growth opportunities are defined as 3-year average market-to-book value ratio of total assets. LEV =Debt ratio is defined as total liability divided by total assets.
AQ =Auditor quality is defined as an auditor's industry market share of net sales.
EMPIRICAL RESULTS
We examine whether there is an association between governance mechanisms and the disclosure transparency of top management’s compensation in Taiwanese listed companies. The governance mechanisms include top management’s shareholding (HOLD), the divergence between control rights and cash flow rights of the controlling shareholder (DIVER), the proportion of executive directors on the board (EXEDIR), and the dual role of the CEO and board chair (DUAL).
The Effect of Governance Mechanisms on Regulations Compliance
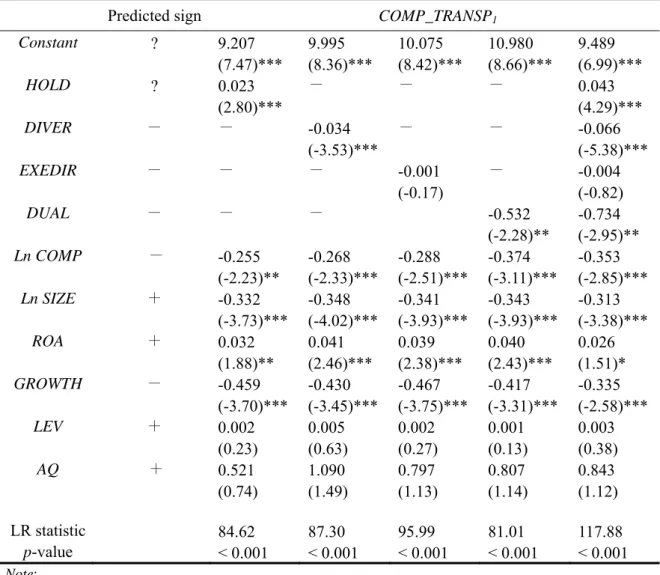
In this study, we employ Binary Logit model to test the effect of governance mechanisms on whether the disclosures of top management’s compensation fully comply with the regulations. The regression results are presented in Table 3. We use four governance mechanism variables in each of the first four columns to test the four research hypotheses. We put all the four governance mechanism variables into the empirical model and the results are presented in the fifth column.
The regression results presented in the first column of Table 3 show that full compliance with the regulations is significantly related to top management’s shareholding (HOLD). The coefficient of top management’s shareholding is significantly positive at the 1% level (z value 2.80). The results support hypothesis 1(a) that there is a positive relationship between top management’s shareholding and the disclosure transparency of top management’s compensation. When their shareholding is greater, the directors and other top management team members have a greater motivation to monitor both compensation and the disclosure policy of compensation.
The second column of Table 3 shows that the coefficient of the divergence between control rights and cash flow rights of the controlling shareholder (DIVER) is significantly negative at the 1% level (z value -3.53). This means that a greater deviation of control rights from cash flow rights will induce more serious entrenchment and lower the likelihood that firms will fully comply with disclosure regulations (i.e. lower disclosure transparency of top management’s compensation). The result is consistent with our expectations and supports hypothesis 2. In contrast to the U.S., the concentrated ownership environment in East Asia leads to an agency problem whereby wealth is expropriated by the controlling shareholder (e.g., La Porta et al., 1999; Claessens et al., 2000; Lee & Yeh, 2004). The coefficient of the proportion of executive directors in the board (EXEDIR) is negative, as presented in the third column. The sign of the coefficient is consistent with our expectations, but not significant (z value -0.17). Thus, the result does not support hypothesis 3. The fourth column shows that the coefficient of the dummy variable for whether the CEO is also the board chair (DUAL) is significantly positive at the 5% level (z value -2.28). This result is consistent with our expectations and supports hypothesis 4.
The empirical results of the fifth column include all the four governance mechanisms in the Binary Logit model. The results are similar to those of the first to fourth columns described above. There is a positive relationship between top management’s shareholding and compliance with governmental regulations regarding the disclosure of top management’s compensation. By contrast, there is a significant negative relation between the divergence of control rights from cash flow rights of the controlling shareholder and compliance with the disclosure regulations, and also between the dual role of the CEO/board chair and disclosure compliance. These results are consistent with hypotheses 1(a), 2 and 4.
With respect to the control variables, the coefficient of the level of top management’s compensation (Ln COMP) is significantly negative at the 1% level. This result indicates that firms with a high level of top management’s compensation are less likely to fully comply with the disclosure regulations. The coefficient of firm size (Ln SIZE) is significantly negative at the 1%, it indicates that firm size has a negative relation
with disclosure regulations compliance. The results are inconsistent with prior studies (Lang & Lundholm, 1993; Hossain, Perera, & Rahman, 1995; Meek, Roberts, & Gray, 1995; Coulton et al., 2001). The coefficient of the return on assets (ROA) is significantly positive at the 10% level, this indicates that firms with greater profitability are more likely to fully comply with the disclosure regulations. By implication, firms with lower levels of profitability are less likely to fully comply with the disclosure regulations. We explain the result by suggesting that top management will worry about whether their compensation is excessive when the firm’s profitability is poor, and hence are less likely to fully disclose their compensation. The results are consistent with our expectations. The coefficient of growth opportunity (GROWTH) is negative and significant at the 1% level.
TABLE 3 Binary logit regressions of the disclosure transparency of top management’s compensation
Predicted sign COMP_TRANSP1
Constant ? 9.207 9.995 10.075 10.980 9.489 (7.47)*** (8.36)*** (8.42)*** (8.66)*** (6.99)*** HOLD ? 0.023 - - - 0.043 (2.80)*** (4.29)*** DIVER - - -0.034 - - -0.066 (-3.53)*** (-5.38)*** EXEDIR - - - -0.001 - -0.004 (-0.17) (-0.82) DUAL - - - -0.532 -0.734 (-2.28)** (-2.95)** Ln COMP - -0.255 -0.268 -0.288 -0.374 -0.353 (-2.23)** (-2.33)*** (-2.51)*** (-3.11)*** (-2.85)*** Ln SIZE + -0.332 -0.348 -0.341 -0.343 -0.313 (-3.73)*** (-4.02)*** (-3.93)*** (-3.93)*** (-3.38)*** ROA + 0.032 0.041 0.039 0.040 0.026 (1.88)** (2.46)*** (2.38)*** (2.43)*** (1.51)* GROWTH - -0.459 -0.430 -0.467 -0.417 -0.335 (-3.70)*** (-3.45)*** (-3.75)*** (-3.31)*** (-2.58)*** LEV + 0.002 0.005 0.002 0.001 0.003 (0.23) (0.63) (0.27) (0.13) (0.38) AQ + 0.521 1.090 0.797 0.807 0.843 (0.74) (1.49) (1.13) (1.14) (1.12) LR statistic 84.62 87.30 95.99 81.01 117.88 p-value < 0.001 < 0.001 < 0.001 < 0.001 < 0.001 Note:
1. All variables are as defined in Table 2.
The Transparency Ranking of Top Management’s Compensation Disclosures
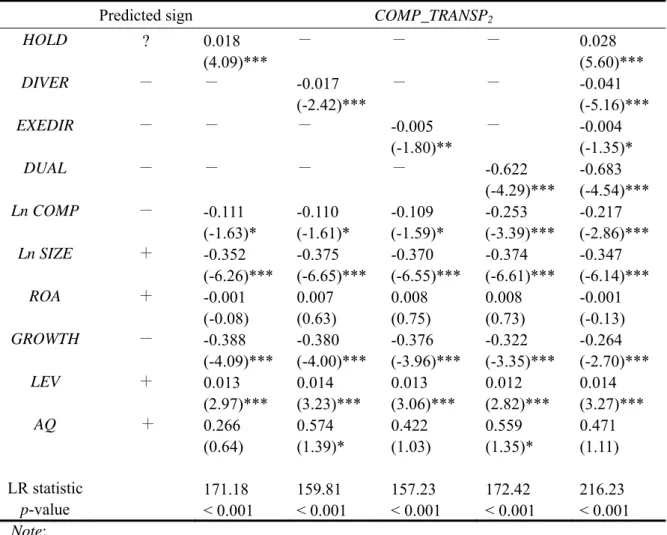
The regression results presented in the first column of Table 4 show that the transparency ranking of top management’s compensation disclosures are significantly related to top management’s shareholding. The coefficient of the directors’ shareholding is significantly positive at the 1% level (z value 4.09). Thus hypothesis 1(a) is supported. When directors and other top management team members own more shares, they have a greater motivation to monitor compensation and the disclosure policy of compensation due to their interest convergence with the firms.
The second column of Table 4 shows that the divergence between control rights and cash flow rights of the controlling shareholder (DIVER) is significantly negative at the 1% level (z value -2.42). This result indicates that a greater deviation of control rights from cash flow rights is associated with a lower level of disclosure. Thus hypothesis 2 is supported. The coefficient of the proportion of executive directors in the board (EXEDIR) is negative and significant at the 5% level (z value -1.80) as shown in the third column. This result supports hypothesis 3. The dummy variable for whether the CEO is also the board chair (DUAL) is negative and significant at 1% level (z value -4.29) as shown in the fourth column. This indicates that a more serious agency problem will be generated when the CEO is also the board chair. These results are consistent with Bassett et al. (2007) and they support hypothesis 4.
The results of the fifth column include all the four governance mechanisms in the empirical model. The results are similar to those in the first column to fourth column. The transparency ranking of top management’s compensation disclosures are significantly positively related to top management’s shareholding. By contrast, the transparency ranking of top management’s compensation disclosures are significantly negatively related to a divergence between the control rights and cash flow rights of the controlling shareholder, the proportion of executive directors, and the dummy variable for whether the CEO is also the board chair. These results are consistent with hypotheses 1(a), 2, 3 and 4.
With respect to the control variables, the results are similar to those in the first to fifth columns in Table 4. The transparency ranking of top management’s compensation disclosures are significantly positively related to leverage, and significantly negatively related to the level of top management’s compensation, firm size and growth opportunity.
TABLE 4 Ordered logit regression of transparency ranking of top management’s compensation disclosures
Predicted sign COMP_TRANSP2
HOLD ? 0.018 - - - 0.028 (4.09)*** (5.60)*** DIVER - - -0.017 - - -0.041 (-2.42)*** (-5.16)*** EXEDIR - - - -0.005 - -0.004 (-1.80)** (-1.35)* DUAL - - - - -0.622 -0.683 (-4.29)*** (-4.54)*** Ln COMP - -0.111 -0.110 -0.109 -0.253 -0.217 (-1.63)* (-1.61)* (-1.59)* (-3.39)*** (-2.86)*** Ln SIZE + -0.352 -0.375 -0.370 -0.374 -0.347 (-6.26)*** (-6.65)*** (-6.55)*** (-6.61)*** (-6.14)*** ROA + -0.001 0.007 0.008 0.008 -0.001 (-0.08) (0.63) (0.75) (0.73) (-0.13) GROWTH - -0.388 -0.380 -0.376 -0.322 -0.264 (-4.09)*** (-4.00)*** (-3.96)*** (-3.35)*** (-2.70)*** LEV + 0.013 0.014 0.013 0.012 0.014 (2.97)*** (3.23)*** (3.06)*** (2.82)*** (3.27)*** AQ + 0.266 0.574 0.422 0.559 0.471 (0.64) (1.39)* (1.03) (1.35)* (1.11) LR statistic 171.18 159.81 157.23 172.42 216.23 p-value < 0.001 < 0.001 < 0.001 < 0.001 < 0.001 Note:
1. All variables are as defined in table 2.
2. z-statistics are presented in parentheses. ***, **, and * denote significance at 1%, 5%, and 10% level, respectively.
ROBUSTNESS TESTS
Alternative Empirical Models: The Probit Model and Ordered Probit Model
The cumulative distribution function assumes logistic distribution under the Binary Logit model and Ordered Logit model. If the cumulative distribution function is the standard normal distribution, the Binary Probit model and Ordered Probit model should
be employed. We use these two models to re-test the empirical models in Table 3 and Table 4. The results are presented in Table 5.
The fist column of Table 5 shows that full compliance with the regulations regarding top management’s compensation disclosures (COMP_TRANSP1) is positively significantly related to top management’s shareholding. By contrast, full compliance with the disclosure regulations is negatively significantly related to the divergence between control rights and cash flow rights of the controlling shareholder, and also to the dummy variable for whether the CEO is the board chair. The results support hypotheses 1(a), 2 and 4.
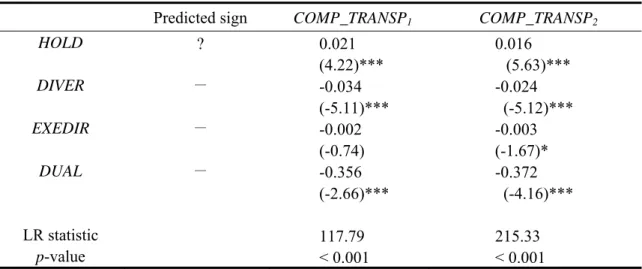
The second column of Table 5 shows that the transparency ranking of top management’s compensation disclosures (COMP_TRANSP2) are positively significantly related to the directors’ shareholding. By contrast, the transparency ranking of top management’s compensation disclosures are negatively significantly related to the proportion of executive directors, the divergence between control rights and cash flow rights of the controlling shareholder, and the dummy variable for whether the CEO is also board chair. The results support hypotheses 1(a), 2, 3 and 4. Based on the above results from the alternative models, we conclude that the prior results in Table 3 and Table 4 are robust.
TABLE 5 Robustness tests: Using alternative model by binary probit and ordered probit Predicted sign COMP_TRANSP1 COMP_TRANSP2
HOLD ? 0.021 0.016 (4.22)*** (5.63)*** DIVER - -0.034 -0.024 (-5.11)*** (-5.12)*** EXEDIR - -0.002 -0.003 (-0.74) (-1.67)* DUAL - -0.356 -0.372 (-2.66)*** (-4.16)*** LR statistic 117.79 215.33 p-value < 0.001 < 0.001 Note:
1. All variables are as defined in table 2.
2. z-statistics are presented in parentheses. ***, ** and * denote significance at 1%, 5%, and 10% level, respectively.
Excess Top Management’s Compensation
In the prior empirical model, we used the level of top management’s compensation to test the effects of compensation transparency and compliance with the disclosure regulations on the disclosure policy of firms. Here, we employ the estimated excess compensation of top management (EX_COMP) to replace this measurement refer to Chen
(2010) and Robinson et al. (2011). We conjecture that excess compensation is a better measure of compensation disclosure than the level of top management’s compensation.
EX_COMP is defined as the estimated excess compensation of the board chair and the
CEO divided by net sales. Based on prior research (Core et al. 1999), we estimate the excess compensation of top management for firm i at time t by equations 2 and 3.
COMPEN it=β0+β1 Ln SIZE it+β2 ROA it+β3 RET it+β4 GROWTH it-2,t+β5 HOLD it
+β6 LEV it+β7 STDROA it+β8 STDRET it+
jγj INDij +
k
θk YEARik+εit………..………...……...(2)
EX_COMP it=COMPEN it-COMPEN
*
it=εit ………..…..…………..………(3)
Where,
COMPEN = The sum of the actual compensation of the board chair, the CEO and the vice
presidents.
EX_COMP =The estimated excess compensation of the board chair, the CEO and the vice
presidents.
COMPEN *= The estimated fair compensation of the board chair, the CEO and the vice
presidents calculated by equation 2.
Ln SIZE =The natural logarithm of the firm’s net sales.
ROA = The ratio of earnings before interest and taxes to total assets. RET = Annual stock return.
GROWTH =Growth opportunities measured by the 3-year average market-to-book value
HOLD = The top management’s shareholding measured as the percentage of outstanding
shares owned by the directors, the CEO and the vice presidents. LEV = Debt ratio defined as total liability divided by total assets.
STDROA = The standard deviation of return on asset in the past five years. STDRET = The standard deviation of annual stock return in the past five years.
IND= Dummy variables to control for industry effect. YEAR= Dummy variables to control for year effect.
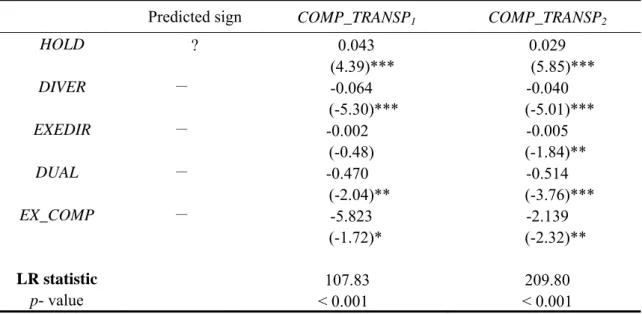
The results are presented in Table 6. It can be seen that full compliance with the disclosure regulations (COMP_TRANSP1) is positively significantly related to top management’s shareholding and negatively significantly related to the divergence between control rights and cash flow rights of the controlling shareholder, and the dummy variable for whether the CEO is also the board chair. These results give further support to hypotheses 1(a), 2 and 4. The transparency ranking of top management’s compensation disclosures (COMP_TRANSP2) are positively significantly related to the directors’ shareholding and negatively significantly related to the proportion of executive directors, the divergence between control rights and cash flow rights of the controlling shareholder, and the dummy variable for whether the CEO is also the board chair. The results are similar to those in Tables 3 and Tables 4, these results indicate that the prior results are robust. In addition, the coefficient of the estimated excess compensation of top management is negatively significant at the 10% and 5% levels (z value -1.72 and -2.32, respectively). The results are consistent with those obtained using the level of top management’s compensation as the measure.
TABLE 6 Robustness tests: Estimated excess compensation instead of the level of top management’s compensation
Predicted sign COMP_TRANSP1 COMP_TRANSP2
HOLD ? 0.043 0.029 (4.39)*** (5.85)*** DIVER - -0.064 -0.040 (-5.30)*** (-5.01)*** EXEDIR - -0.002 -0.005 (-0.48) (-1.84)** DUAL - -0.470 -0.514 (-2.04)** (-3.76)*** EX_COMP - -5.823 -2.139 (-1.72)* (-2.32)** LR statistic 107.83 209.80 p- value < 0.001 < 0.001 Note:
1. EX_COMP = the excess compensation measures of top management, is defined as estimated excess compensation of the board chair and the CEO divided by net sales. Other variables are as defined in table 2.
2. z-statistics are presented in parentheses. ***, **, and * denote significance at 1%, 5%, and 10% level, respectively.
Alternative Governance Mechanism Include Other Governance Variables
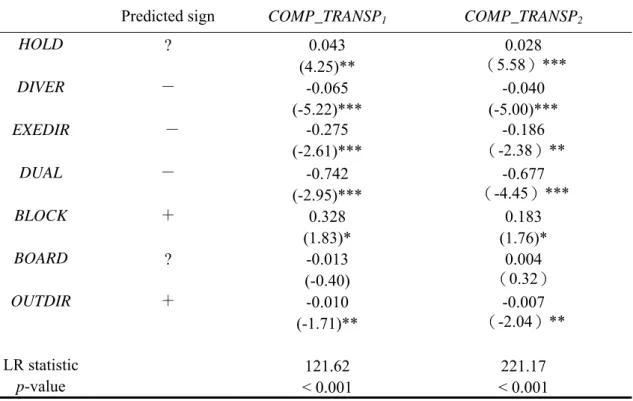
We put three additional variables of governance structure into the empirical model. These three additional variables are the dummy variable for the outside blockholder (BLOCK)9, the board size (BOARD)10, and the proportion of outside directors (OUTDIR).11 Outside blockholders will enhance the monitoring of disclosure decisions. Hence, we predict that firms with outside blockholders will provide greater disclosure of top management’s compensation. Prior studies document that larger boards are less effective in monitoring management (Jensen, 1993; Yermack, 1996). We therefore predict that a larger board will have a negative effect on the degree of disclosure transparency. By contrast, a greater proportion of outside directors will enhance the monitoring of the disclosure policy; thus, we predict that the proportion of outside directors will have a positive relation with the compensation disclosure.
The empirical results using the additional governance variables are presented in
9 The dummy variable is equal to one if the firm has an outside blockholder whose ownership exceeds 5%
of the outstanding shares, and zero otherwise.
10 The board size is measured by the total number of the directors on the board at the year-end. 11 The proportion of outside directors is measured by the percentage of outside directors on the board.
Table 7. The results of each testable variable are similar to the previous results in Table 3 and Table 4. The results show that the dummy variable for whether the firm has an outside blockholder (BLOCK) is positively significantly related to whether firms fully comply with the disclosure regulations, and to the transparency ranking of top management’s compensation disclosures. But the proportion of outside directors (OUTDIR) is negatively significantly related to whether firms fully comply with the disclosure regulations, and to the transparency ranking of top management’s compensation disclosures. The results indicate that outside directors do not have an effective monitoring mechanism for compensation disclosures due to election problems in Taiwan. Based on the above results, we conclude that the empirical results are consistent with Table 3 and Table 4. The results are still robust.
TABLE 7 Robustness tests: Alternative governance mechanism include other governance mechanism variables
Predicted sign COMP_TRANSP1 COMP_TRANSP2
HOLD ? 0.043 0.028 (4.25)** (5.58)*** DIVER - -0.065 -0.040 (-5.22)*** (-5.00)*** EXEDIR - -0.275 -0.186 (-2.61)*** (-2.38)** DUAL - -0.742 -0.677 (-2.95)*** (-4.45)*** BLOCK + 0.328 0.183 (1.83)* (1.76)* BOARD ? -0.013 0.004 (-0.40) (0.32) OUTDIR + -0.010 -0.007 (-1.71)** (-2.04)** LR statistic 121.62 221.17 p-value < 0.001 < 0.001 Note:
1. BLOCK= Dummy variable equal to one if the firm has an outside blockholder who owns exceed 5% of the outstanding shares, and zero otherwise. BOARD= The total number of the directors on the board at the year-end. OUTDIR= The proportion of the outside directors is the percentage of outside directors in the board. Other variables are as defined in Table 2. 2. z-statistics are presented in parentheses. ***, **, and * denote significance at 1%, 5%, and
CONCLUSIONS
Prior studies indicate that corporate governance has a significant impact on the level of executive compensation. Nevertheless, few studies investigate the relation between the transparency of top management compensation disclosures and governance mechanisms. In this paper, we examine the association between East-Asia governance regimes and the disclosure transparency of top management’s compensation. We use compliance with the disclosure regulations and the transparency ranking of top management’s compensation to measure the disclosure policy of firms. We find that firms are more likely to fully comply with the regulations of compensation disclosure when their shareholding is higher. By contrast, a divergence between the ownership structure of the controlling shareholder, and the dual role of the CEO/board chair, are likely to result in less than full compliance with the regulations of compensation disclosures. We also find that the transparency ranking of top management’s compensation is positively related to top management’s shareholding. By contrast, we find that the transparency ranking is negatively related to a divergence between the control rights and cash flow rights of the controlling shareholder, the proportion of executive directors on the board, and the dual position of the CEO/board chair. The robustness tests support these findings.
Overall, our results suggest that firms with weaker governance mechanisms have greater agency problems and a lower level of disclosure transparency with regard to top management’s compensation. In contrast to Coulton et al. (2001), this paper finds that measures of corporate governance have a statistically significant relation with the disclosures of top management’s compensation. Our results suggest that the regulatory agencies should enhance their monitoring of the disclosures of top management’s compensation in order to mitigate the disclosure agency problem and reduce information asymmetry.
REFERENCES
Ahmed, K. & Courtis, J. K. 1999. Association between corporate characteristics and disclosure levels in annual reports: A meta-analysis. British Accounting Review, 31(1): 35-61.
Aleksandar, A., Boyle, G., & McNoe, W. 2002. Public disclosure of executive
compensation: Do shareholders need to know? Pacific-Basin Finance Journal 10(1): 97-117.
Almutairi, A. R., Dunn, K. A., & Skantz, T. 2009. Auditor tenure, auditor specialization, and information asymmetry. Managerial Auditing Journal, 24 (7): 600-623.
Ball, R., Kothari, S., & Robin, A. 2000. The effect of international institutional factors on properties of accounting earnings. Journal of Accounting and Economics, 29(1): 1-15.
Bassett, M., Koh, P. S., & Tutticci, I. 2007. The association between employee stock option disclosures and corporate governance: Evidence from an enhanced disclosure regime. The British Accounting Review, 39: 303-322.
Beekes, W. & Brown, P. 2006. Do better-governed Australian firms make more informative disclosures? Journal of Business Finance and Accounting, 33(3): 422-450.
Boyd, B. K. 1994. Board control and CEO compensation. Strategic Management Journal, 15(5): 335-344.
Bradbury, M. 1992. Voluntary disclosure of financial segment data: New Zealand evidence. Accounting and Finance, 32(2):15-26.
Brounen, D., Cools, T., & Schweitzer, M. 2001. Information transparency pays: Evidence from European property shares. Real Estate Finance, 18(2): 39 -43.
Byrd, J., & K. Hichman. 1992. Do outside directors monitor managers? Evidence from tender offer bids. Journal of Financial Economics, 32(2): 195-221.
Chau, G. & Gray, S. J. 2010. The effect of unexpensed compensation and abnormal compensation on the disclosures of top management’s compensation. Journal of International Accounting, Auditing and Taxation, 19(2): 93-109.
Chen, C. H. 2010. The effect of unexpensed compensation and abnormal compensation on the disclosures of top management’s compensation. The International Journal of Accounting Studies, 50: 89-113. (in Chinese)
Chen, C. J. P. & Jaggi, B. 2000. Association between independent non-executive directors, family control and financial disclosures in Hong Kong. Journal of Accounting and Public Policy, 19(4-5): 285-310.
Chen, J. P. & Hsu, C. Y. 2007. A study of association between corporate governance structure and information disclosure. Chiao Da Management Review, 27(2): 55-109. (in Chinese)
Cheng, C. M. & Courtenay, S. M. 2006. Board composition, regulatory regime and voluntary disclosure. The International Journal of Accounting, 41: 262-289. Chizema, A. 2008. Institutions and voluntary compliance: The disclosure of individual
executive pay in Germany. Corporate Governance: An International Review, 16: 359-374.
Claessens, S., Djankov, S., & Lang, L. H. P. 2000. The separation of ownership and control in East Asian corporation. Journal of Financial Economics, 58: 81-112. Core, J. E., Holthausen, R. W., & Larcker, D. F. 1999. Corporate governance, chief
executive officer compensation, and firm performance. Journal of Financial Economics, 51: 371-406.
Coulton, J., James, C., & Taylor, S. 2001. The effect of compensation design and corporate governance on the transparency of CEO compensation disclosures. Working Paper. University of Technology, Sydney.
Crystal, G. S. 1991. In search of excess: The overcompensation of American executives. New York: Norton.
Dunn, K. & Mayhew, B.W. 2004. Audit firm industry specialization and client disclosure quality. Review of Accounting Studies, 9(1): 35-58.
Eng, L. & Mak,Y. 2003. Corporate governance and voluntary disclosures. Journal of Accounting and Public Policy, 22: 325-345.
Fan, P. H. & Wong, T. J 2002. Corporate ownership structure and the in formativeness of accounting earnings in East Asia. Journal of Accounting and Economics, 33(3): 401-425.
Finkelstein, S. & Hambrick, D. 1989. Chief executive compensation: A study of the intersection of markets and political processes. Strategic Management Journal, 10(1): 121-134.
Frankel, R., McNichols, M., & Wilson, G. 1995. Discretionary disclosure and external financing. The Accounting Review, 70(1): 135-150.
Gomez-Mejia, L. R. & Wiseman, R. M. 1998. A behavioral agency model of managerial risk taking. Academy of Management Review, 23(1): 133-153.
Gul, F. A. & Leung, S. 2004. Board leadership, outside directors expertise and voluntary corporate disclosures. Journal of Accounting and Public Policy, 23:351-379. Healy, P. M. & Palepu, K. G. 1993. The effect of firms’ financial disclosure strategies on
stock prices. Accounting Horizons, 7(1): 1-11.
Ho, S. M. & Wong, K. S. 2001. A study of the relationship between corporate governance structures and the extent of voluntary disclosure. Journal of International
Hossain, M., Perera, M., & Rahman, A. 1995. Disclosure in annual reports of New Zealand companies. Journal of International Financial Management and Accounting, 6(1): 69-85.
Jensen, M. C. 1993. The modern industrial revolution, exit and the failure of internal control systems. Journal of Finance, 48(3): 831-880.
Jensen, M. C. & Meckling, W. H. 1976. Theory of the firm: management behavior, agency costs and ownership structure. Journal of Financial Economics, 3(4): 305-360.
Jensen, M. & K. Murphy. 1990. Performance pay and top-management incentives. Journal of Political Economy, 98(2): 225-264.
Kelton, A. & Yang, Y. 2008. The impact of corporate governance on internet financial reporting. Journal of Accounting and Public Policy, 27(1): 62-87.
Kin, L. 2003 Economic consequences of regulated changes in disclosure: the case of executive compensation. Journal of Accounting and Economics, 35(3): 285-314. La Porta, R., Lopez-de-Silanes, F., & Shleifer, A. 1999. Corporate ownership around the
world. Journal of Finance, 54(2): 471-517.
Laksmana, I. 2008. Corporate board governance and voluntary disclosure of executive compensation practices. Contemporary Accounting Research, 25: 1147-1182. Lambert, R., Larcker, D., & Weigelt, K. 1993. The structure of organizational incentives.
Administrative Science Quarterly, 38(3): 438-461.
Lang, M. & Lundholm, R. 1993. Cross-sectional determinants of analyst ratings of corporate disclosures. Journal of Accounting Research, 31(2): 246-271.
Lee, T. S. & Yeh, Y. H. 2004. Corporate governance and financial distress: Evidence from Taiwan. Corporate Governance: An International View, 12(3): 378-388.
Leftwich, R., Watts, R. L., & Zimmerman, J. L. 1981. Voluntary corporate disclosure: the case of interim reporting. Journal of Accounting Research, 19: 50-77.
Meek, G. K., Roberts, C.B., & Gray, S. J. 1995. Factors influencing voluntary annual report disclosures by U.S., U.K. and continental European multinational
corporations. Journal of International Business Studies, 26(3): 555-572.
Mehran, H. 1995. Executive compensation structure, ownership, and firm performance. Journal of Financial Economics, 38(2): 163-184.
Morck, R., Yeung, B., & Wu, W. 2000. The information content of stock markets: Why do emerging markets have synchronous stock price movements? Journal of Financial Economics, 58(1): 215-260.
Murphy, K. J. 1985. Corporate performance and management remuneration: An empirical analysis. Journal of Accounting and Economics, 7(2): 11-42.
Nagar V., Nanda, D. & Wysocki, P. 2003. Discretionary disclosure and stock-based incentives. Journal of Accounting and Economics, 34(1): 283-309.
Nikols, V. & Afxentiou, Z. 1998. The association between the SEC’s 1992 compensation disclosure rule and executive compensation policy changes. Journal of Accounting and Public Policy, 17(1): 27-54.
Robinson, J. R., Xue, Y., & Yu, Y. 2011. Determinants of disclosure noncompliance and the effect of the SEC review: evidence from the 2006 mandated compensation disclosure regulations. The Accounting Review, 86(4): 1415-1444.
Schleifer, A. & Vishny, R. W. 1986. Large shareholders and corporate control. Journal of Political Economy, 94(3): 461- 488.
Wu, H. C. 2005. The disclosure of directors’ compensation: minority shareholders couldn’t observe the salary of top management. Business Weekly, 919: 82-84. (in Chinese)
Yeh, Y. H., Lee, T. S., & Woidtke, T. 2001. Family control and corporate governance: Evidence from Taiwan. International Review of Finance, 2(1): 21-48.
Yermack, D. 1996. Higher market valuation for firms with a small board of directors. Journal of Financial Economics, 40(2): 185-211.
Biographical Sketch
Chun-Ho Chen is an associate professor of the department of Accounting at National Chung Hsing University. He received his Ph.D. in accounting at National Taiwan University. His primary research focuses on compensation plan, corporate governance, and earnings management.
Yun-sheng Hsu is an associate professor and the chair of the department of Accounting at National Chung Hsing University. He received his Ph.D. in accounting at National Taiwan University. His primary research focuses on earnings management.
Tzu-Ching Weng is assistant professor of Department of Accounting, Feng Chia University. Her teaching areas include Intermediate Accounting, Internal Control and Advanced Auditing. She completed her Ph.D. degree at Department of Accounting, National Chengchi University. Her research areas included Financial Accounting and Auditing. Her research papers have been published at international and domestic academic journals.
Hsin-Yi Chi is associate professor of Department of Accounting, National Chung Hsing University. His teaching areas include intermediate Accounting and Advanced Auditing. He received his Ph.D. degree at Department of Accounting, National Central University. His research areas included Financial Accounting and Auditing. Her research papers have been published at international and domestic academic journals.
公司治理機制是否影響高階管理當局之薪酬揭露? 陳俊合 國立中興大學 會計學系 副教授 許永聲 國立中興大學 會計學系 副教授 翁慈青 逢甲大學 會計學系 助理教授 紀信義* 國立中興大學 會計學系 副教授 中文摘要 本文探討公司治理機制對高階管理當局薪酬揭露透明度之影響,本文結果顯示,當 高階管理當局持股比率越高,則其薪酬揭露透明度較高。相對而言,當董事會中執 行董事比率越高、控制權與現金流量權偏離程度越高以及董事長兼任總經理時,則 其薪酬揭露透明度較低。總而言之,本文結果指出當公司治理機制較弱時,會產生 較大的代理問題,並導致其高階管理當局薪酬揭露透明度較低。 關鍵詞: 公司治理、揭露、薪酬、資訊透明度。 *通訊地址:紀信義,國立中興大學會計學系,40227 台中市南區國光路 250 號。 E-mail: hychi @nchu.edu.tw