國立交通大學
生物科技學系
碩士論文
醇亞硫酸基轉移酶及
3′磷酸腺甘酸 5'磷酸硫酸合成酶
之螢光檢測法
Fluorometric Assay for Alcohol Sulfotransferase &
PAPS synthetase through
Regeneration of PAPS
研究生
: 陳偉迪
指導教授
: 楊裕雄 博士
醇亞硫酸基轉移酶及
3′磷酸腺甘酸 5'磷酸硫酸合成酶
之螢光檢測法
Fluorometric Assay for Alcohol Sulfotransferase &
PAPS synthetase through Regeneration of PAPS
研 究 生:陳偉迪 Student: Wei-Ti Chen
指導教授:楊裕雄 博士 Advisor: Dr. Yuh-Shyong Yang
國立交通大學
生物科技學系
碩 士 論 文
A Thesis
Submitted to Department of Biological Science and Technology
National Chiao Tung University
in Partial Fulfillment of the Requirements
for the Degree of
Master of Science
in
Biological Science and Technology
July 2005
Hsinchu, Taiwan, Republic of China
中華民國九十四年七月
醇亞硫酸基轉移酶及
3′磷酸腺甘酸 5'磷酸硫酸合成酶
之螢光檢測法
學生: 陳偉迪 指導老師: 楊裕雄 博士
國立交通大學生物科技學系碩士班
摘要
亞硫酸化普遍地存在於生物系統中,而且被亞硫酸化的生物分子會明顯改 變其生理化學性質。過去的研究已經證實 3′磷酸腺甘酸 5'磷酸硫酸合成酶(3’-phosphoadenosine 5’-phosphosulfate synthetase, PAPSS)和亞硫酸基轉移酵素 (sulfotransferase, ST)兩類酵素涉及亞硫酸化反應。前者可活化無機硫酸根成為 PAPS,後者則催化產生的 PAPS 之亞硫酸基至接收分子。本論文主要是發展螢 光檢測法來探討此兩類酵素在亞硫酸化的重要性,如探討四級結構對於亞硫酸 基轉移酵素的影響,並分成三個章節敘述之。首先,我們建立了不同類的亞硫 酸基轉移酵素的表達與純化方法。而且首次報導關於醇亞硫酸基轉移酵素 (alcohol sulfotransferase, AST)之螢光檢測法。此方法有別於放射性同位素的終點 式檢測,屬於連續性的螢光檢測法。檢測系統的主旨是利用重組的酚亞硫酸基
轉 移 酵 素(phenol sulfotransferase, PST)催化受質 4-methylumbelliferyl sulfate
(MUS)做為亞硫酸基提供者並轉移至 3’-phosphoadenosine 5’-phosphate (PAP)再
生 3’-phosphoadenosine 5’-phosphosulfate (PAPS) ,此核苷酸的亞硫酸基再由
AST 催化。在設計的環境中,重組的 PST 不會催化 AST 的受質,而且反應後
產生4-methylumbelliferone (MU)之螢光變化不但可以定量 AST 的活性,也有足
夠的靈敏度來測出ng 或 pmole 的酵素活性。在此研究中,許多 hDHEA-ST 的
生化特性可被測得,文中並將此法與放射性同位素法就靈敏度等特質相比較, 以及於第二章中研究四級結構對於亞硫酸基轉移酵素的影響。第三章,我們成
Fluorometric Assay for Alcohol Sulfotransferase & PAPS
synthetase through Regeneration of PAPS
Wei-Ti Chen and Yuh-Shyong Yang
Institute of Biological Science and Technology, College of Biological Science and Technology, National Chiao Tung University, Hsinchu, Taiwan, ROC
ABSTRACT
The sulfoconjugation of biomolecules occurred widely in biological system which resulted in a dramatic change in the physicochemical property of the sulfonated compounds. Previously, 3’-phosphoadensine 5’-phosphosulfate synthetase (PAPSS) and sulfotransferases (STs) were found to involve in the course of sulfonation. The former activates inorganic sulfate to form PAPS, and the latter catalyzes the sulfuryl group of PAPS transferring to an acceptor molecule. The thesis is divided into three chapters, and introduces sensitive fluorometric assays developed for investigation into their fundamental issues concerning the role of sulfonation, such as the effects of quaternary structure on sulfotransferase function. First chapter described the convenient expression and purification procedure of recombinant STs by affinity column. Furthermore, a first continuous fluorometric assay was developed for alcohol sulfotransferase (AST). It utilized PAPS regenerated from 3’-phosphoadenosine
5’-phosphate (PAP) by a recombinant phenol sulfotransferase (PST) using
4-methylumbelliferyl sulfate (MUS) as the sulfuryl group donor. The change of fluorescence intensity of 4-methylumbelliferone (MU) corresponded directly to the amount of active AST and was sensitive enough to measure ng or picomole amount of the enzyme activity. Some properties of hDHEA-ST were determined by this method and were found comparable to published data. In second chapter, this coupled-enzyme assay was applied to study some effects of quaternary structure on AST. Some catalytic properties and thermal stability were compared between dimeric (wild-type) and monmeric (mutant) cytosolic STs. Final chapter described molecular cloning, expression, and purification of recombinant PAPSS. By coupling with the physiological reaction of PST, the activities of recombinant PAPSS were also determined fluorometrically. The two fluorometric methods developed not only are useful for the routine and detailed kinetic study of these important class of enzymes but also have the potential for the development of a high-throughput procedure using
Acknowledgement
努力了這麼久,實在是很辛苦!不過終於到了這個令人振奮的時刻,首 先感謝我的指導教授楊裕雄老師在這碩士兩年生涯中一路的指導與照顧, 讓我有機會在碩士班發表了第一篇研究。還記得四年前剛做專題的我,是 粗線條地不知道如何做好實驗,所幸在楊老師無限的提供資源及研究的腦 力激盪之下,讓我成長茁壯,對於研究及未來的壓力都能從容應對。 能夠順利畢業,要感謝的人很多,首先在次的感謝指導我的楊老闆, 沒有老師的指導,我可能還是大剌剌的我。也要感謝愛我的家人,能夠跟 我ㄧ起分享莫大的壓力及豐碩的成果,尤其是爸爸和姑姑們,雖然我們倆 話不多,但是你總是提供我最好的經濟支援,讓我無後顧之憂。另外,我 也要謝謝簡慶德老師、楊進木老師、陳怡宏老師在碩士論文口試所提出的 諸多可行的建議,使得這篇碩士論文更加完整,謝謝您們 實驗室的夥伴們,真是捨不得你們呀!(不過男兒志在四方,還是得努 力的向前衝、盡全力求勝。)首先感謝兩位亦師亦友的大學長們(小木和小 羊),不僅在研究上適時地給我注入強心針,也常帶給我無限的歡樂。另外, 也特別感謝小米和大俠,讓我亮紅燈的身體重新回復正常狀態。還有我的 兩位首徒(也是逆徒),嚕嚕米和江大哥,陳平狗會永遠記住你們的存在!ST 組就交給你們啦!也感謝當了我六年同學的來斯利(談心別忘了有我在),只 有我們倆了解我們是清白的。里奇與大晃,以後有機會要來聚聚呀!最後感 謝實驗室的政則、莊博、郁吟、小羿(小隻個羿)、樸樸(別忘了到台北一起 喝到X)、蜜柑(踩地雷最佳夥伴)、嘉蔚、小志、淑婷、小樹、佩綺、韋如、CONTENTS PAGE
Abstract (Chinese)...i
Abstract (English)... ii
Acknowledgement...iii
Contents...iv
Contents of Figures and Tables...v
Abbreviation and Symbol...vii
Chapter 1 Fluorometric Assay for Alcohol Sulfotransferase...1
Chapter 2 Effects of Quaternary structure on Sulfotransferase
Function………...………...23
Chapter 3 Molecular Cloning, Expression, Purification, and
Fluorometric Assay of human PAPSS………43
References...………...…...62
Appendix Materials and Methods………...………...69
CONTENTS OF TABLES AND FIGURES PAGE
Chapter 1
Table I Production of PAPS from PAP and MUS catalyzed by K65ER68G……..13
Table II The relative emission coefficient of MU at 450 nm…………...………...14
Table III Activities of AST and arylsulfatase in biological samples……...…….….15
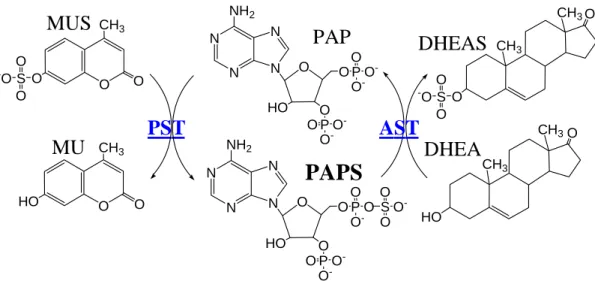
Figure 1 Scheme for the determination of AST activity…...16
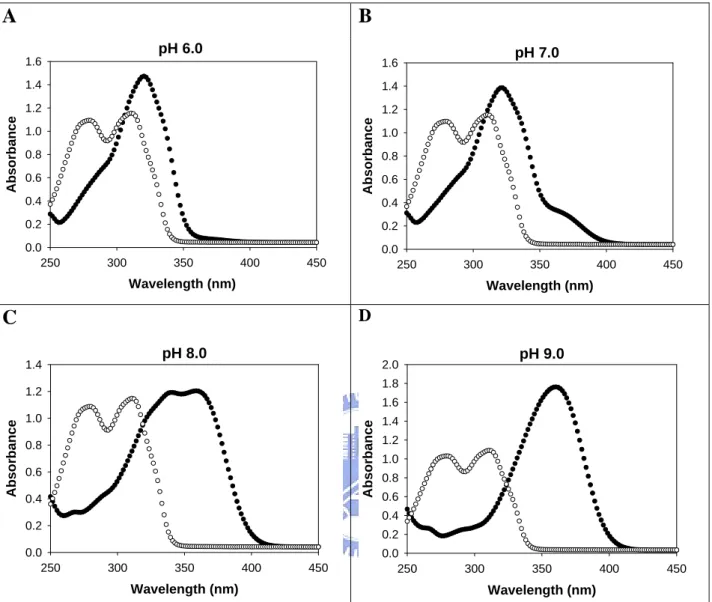
Figure 2 Absorption spectra of MUS and MU...………...17
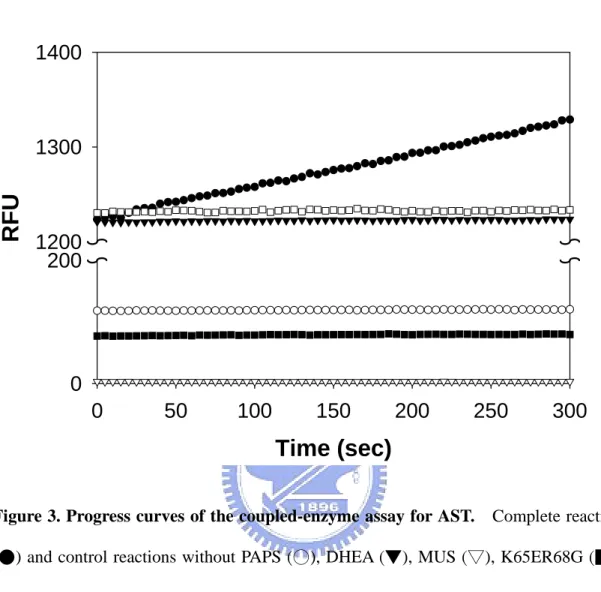
Figure 3 Progress curves of the coupled-enzyme assay for AST...18
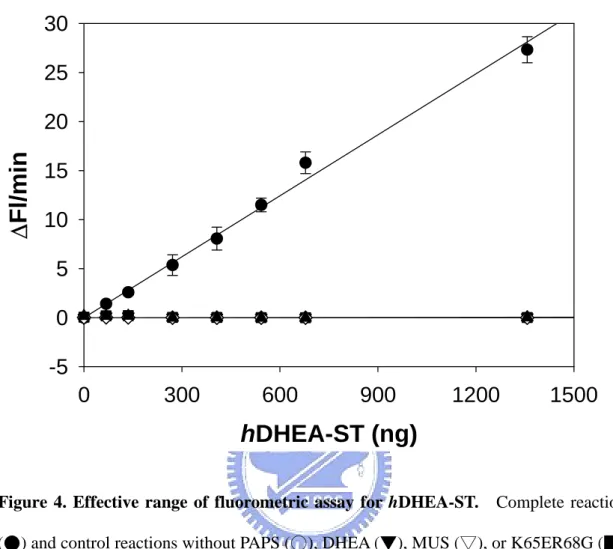
Figure 4 Effective range of fluorometric assay for hDHEA-ST...19
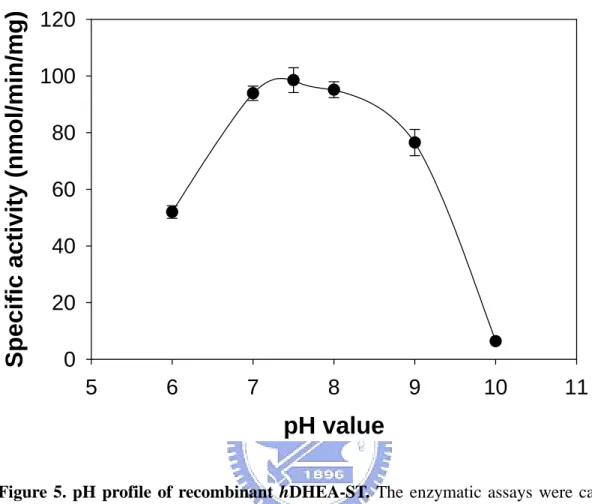
Figure 5 pH profile of recombinant hDHEA-ST……...20
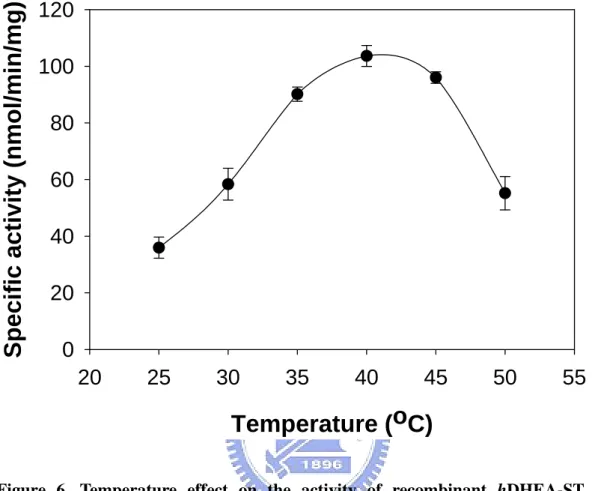
Figure 6 Temperature effect on the activity of recombinant hDHEA-ST…….……21
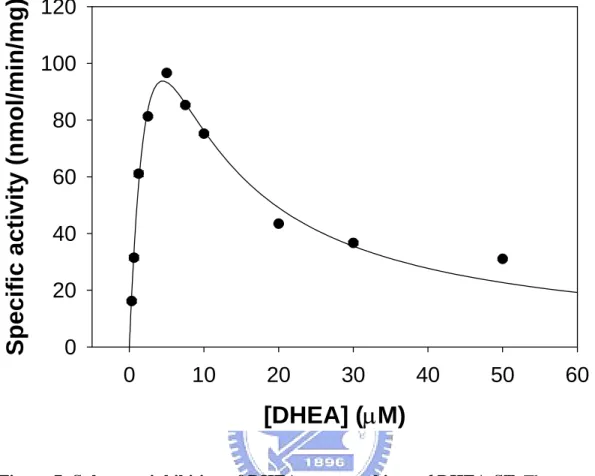
Figure 7 Substrate inhibition of DHEA on recombinant hDHEA-ST………...22
Chapter 2
Table I Calibration standard proteins and parameters of gel filtration………..…..35Table II Molecular weight determination on Sephacryl S-200 HR………...36
Table III Kinetics of pNPS and PAP with rat wild-type and V266E PST…...….….37
Table IV Kinetics of DHEA and PAPS with rat wild-type and V260E DHEA-ST...38
Table V Inhibitory/stimulatory effects of divalent metal cations on the activities of PST, AST, and their mutants………...39
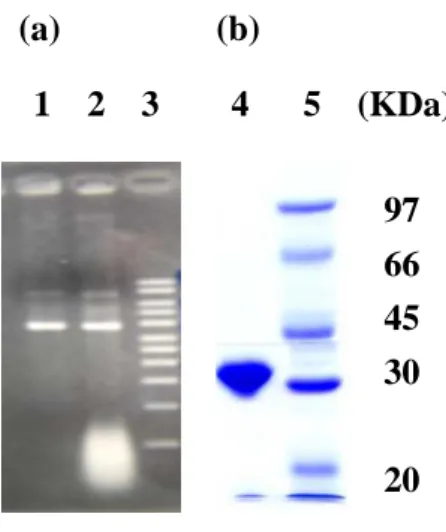
Figure 1 PCR product of mutagenesis and SDS-PAGE…...40
Figure 2 Calibration curve on Sephacryl S-200 HR………...………...41
Chapter 3
Figure 1 Scheme for the determination of PAPSS activity...55
Figure 2 DNA electrophoresis of constructing human PAPS synthetase cDNA…...56
Figure 3 SDS-PAGE for determination of human PAPSS...57
Figure 4 Substrate inhibition of MU on recombinant wild-type and PAP-free (K65ER68G) PSTs………..………58
Figure 5 Inhibition of PAP-free PST by ATP………....………....59
Figure 6 Progress curves of the coupled-enzyme assay for PAPSS...60
Abbreviation and Symbol
Abbreviation and Symbol Full name
PST Phenol sulfotransferase
AST Alcohol sulfotransferase
hDHEA-ST Human dehydroepiandrosterone sulfotransferase
hPAPSS Human PAPS synthetase
ε Absorption (extinction) coefficient
bis-tris propane 1,3-bis[tris(hydroxymethyl)methylamino]propane Bromphenol blue 3’, 3’’, 5’, 5’’-tetrabromophenolsulfonephthalein
PAP Adenosine 3’,5’-bisphosphate
3’-phosphoadenosine 5’-phosphate
PAPS Adenosine 3’-phosphate 5’-phosphosulfate
3’-phosphoadenosine 5’-phosphosulfate
MUS 4-methylumbelliferyl sulfate
MU 4-methylumbelliferone
DTT Dithiothreitol, Cleland’s Reagent
EDTA (Ethylenedinitrilo)tetraacetic acid
PMSF Phenylmethylsulfonyl fluoride
MES 2-[N-morpholino]ethanesulfonic acid
SDS Sodium Dodecyl Sulfate
TEMED N, N, N’, N’-tetramethylethylene diamine
DHEA Dehydroepiandrosterone
U Units;µmole/min
RFU Relative fluorescence unit
A280 Absorption at 280 nm
Km Michaelis constant
Kis Inhibitory constant of substrate inhibition
Chapter 1 Fluorometric Assay for Alcohol Sulfotransferase
(Published in Analytical Biochemistry (2005) vol.339 page 54-60)
A sensitive fluorometric assay was developed for alcohol sulfotransferase (AST). This was the first continuous fluorometric assay reported for AST. It utilized 3’-phosphoadenosine 5’-phosphosulfate (PAPS) regenerated from 3’-phosphoadenosine 5’-phosphate (PAP) by a recombinant phenol sulfotransferase (PST) using 4-methylumbelliferyl sulfate (MUS) as the sulfuryl group donor. The recombinant PST did not use the alcohol substrate under the designed condition, and the sensitivity for AST activity was found comparable to that of radioactive assay as reported in the literature. The change of fluorescence intensity of 4-methylumbelliferone (MU) corresponded directly to the amount of active AST and was sensitive enough to measure ng or picomole amount of the enzyme activity. This fluorometric assay was used to determine the activities of AST as purified form and in crude extracts of pig liver, rat liver, and Escherichia coli. Some properties of
hDHEA-ST were determined by this method and were found comparable to published
data. Under similar assay conditions, the contaminated activities of arylsulfatase in crude extracts were also determined. This method not only is useful for the routine and detailed kinetic study of this important class of enzymes but also has the potential for the development of a high-throughput procedure using microplate reader.
Introduction
Sulfotransferases (STs) are a large family of enzymes that catalyze the transfer of sulfuryl group from PAPS to numerous endogenous and exogenous compounds (Jakoby and Ziegler, 1990). Cytosolic STs catalyze the sulfonation of steroid hormones, catecholamines/neurotransmitters, drugs and environmental chemicals, and are involved in hormone homeostasis and metabolic detoxication/activation of xenobiotics (Coughtrie et al., 1998; Duffel and Guengerich, 1997; Falany et al., 1993; Mulder and Jakoby, 1990; Weinshilboum et al., 1994). In contrast, Golgi membrane-bound STs catalyze the sulfonation of macromolecules including glycosaminoglycans and proteins, and play important roles in the modulation of receptor binding, intercellular communication, and signaling processes (Bowman and Bertozzi, 1999; Weinshilboum et al., 1997).
As a member of cytosolic STs, AST catalyzes the sulfonation of various steroids and their derivatives as well as many xenobiotic alcohols (Falany, 1997; Weinshilboum et al., 1997). Substrates of human AST include hydroxysteroids such as dehydroepiandrosterone (DHEA), testosterone, β-estradiol, and many other endogenous steroids (Chen et al., 1996; Kakuta et al., 1998). Steroid sulfonation has been recognized as an important function for maintaining steroid hormone level in
vivo (Chang et al., 2004). A prominent example is that the bulk of DHEA produced by
adrenal glands is sulfonated and secreted into circulation, which served as a precursor for the androgenic and estrogenic steroids in extra-adrenal tissues (Kroboth et al.,
products (Ramaswamy and Jakoby, 1987), which involve stopping the reactions by heat treatment after a fixed time interval, centrifugation to remove precipitates formed, and changing the solvent system prior to thin-layer or paper chromatography. These procedures are tedious for routine and detailed kinetic studies of AST enzymes. Other reported AST assays are also end-point analyses requiring the determination of PAP using high-performance liquid chromatography (Sheng and Duffel, 2001). Routine spectrophotometric assays, however, have been available only for PST (Ramaswamy and Jakoby, 1987). Despite the considerable progress made in recent years on AST enzymes, several fundamental issues concerning the role of neurosteroids in neuron morphogenesis, regulation, and physiological involvement still remain to be fully elucidated. The present study was prompted by an attempt to develop a convenient assay in order to address theses important issues.
Here we report the development of a fluorometric assay for AST (Figure 1). In this assay, the regeneration of PAPS from PAP with MUS as the sulfuryl group donor was catalyzed by PAP-free PST in a reverse physiological reaction (Lin and Yang, 1998). This reaction was coupled to AST, where purified human dehydroepiandrosterone sulfotransferase (hDHEA-ST) was used. The product, MU, served as fluorometric indicator to monitor hDHEA-ST activity.
Experimental Procedures
Materials. MUS, MU, DHEA, PAP, PAPS, tris[hydroxymethyl]aminomethane
(Tris), 2-[N-morpholino]ethanesulfonic acid (MES), phenylmethylsulfonyl fluoride (PMSF), [ethylenedinitrilo] tetracetic acid (EDTA), glutathione (reduced form) and dithiothreitol (DTT) were purchased from Sigma (St. Louis, MO). Potassium phosphate (dibasic), glycine, and sodium dodecyl sulfate (SDS) were obtained from J. T. Baker (Phillipsburg, NJ 08865 U.S.A.). Glutathione S-transferase Sepharose fast flow was obtained from Amersham Pharmacia Biotech Asia Pacific (Hong Kong). All other chemicals were of the highest purity commercially available.
Preparation of PAP-free PST. The β-form of recombinant PST (Yang et al., 1996)
was used as the PAP-free enzyme. Recombinant mutant PST, K65ER68G, was cloned into an expression vector, pET3c, and transformed into Escherichia coli BL21 (DE3) (Chen et al., 1992). The enzyme isolation procedure was the same as described earlier (Yang et al., 1996), which resulted in a homogeneous protein as determined by SDS-polyacrylamide gel electrophoresis (Laemmli, 1970).
Preparation of hDHEA-ST. Recombinant hDHEA-ST was cloned into an
expression vector, pGEX-2TK and transformed into Escherichia coli BL21 (DE3). The expression and purification of hDHEA-ST was described previously (Chang et al., 2001) and a homogeneous protein was obtained as determined by
absorbency at 280 nm (1.7 ml/mg cm-1 and 2.4 ml/mg cm-1, respectively) (Gill and
von Hippel, 1989) with an UV/Vis spectrophotometer (Hitachi UV/Vis-3300, Japan).
PST assay. The activity of PAP-free PST, K65ER68G, was determined based on
the change of fluorescence due to the production of MU from MUS as measured using a spectrofluorometer (Hitachi F-4500, Japan). The excitation and emission wavelengths were 360 nm and 450 nm, respectively. The reaction mixture included 5 mM 2-mercaptoethanol, 4 mM MUS, 20 µM PAP, 100 mM potassium phosphate buffer (pH 7.0), and 0.5-2 µg K65ER68G. This assay was also referred to as a reverse physiological reaction catalyzed by K65ER68G. One unit was defined as 1 µmol of PAP converted to PAPS per minute with 4-methylumbelliferyl sulfate under the reaction conditions described above.
Coupled-enzyme assay for AST. Reaction mixture (1ml) contained 100 mM potassium phosphate buffer (pH 7.0), 5 mM 2-mercaptoethanol, 20 µM PAPS, 4 mM MUS, 5 µM DHEA, and 3.2 mU (5.4 µg) K65ER68G. AST (hDHEA-ST or crude extract) was added following a preincubation period so as to start the reaction at 37°C. Because commercial PAPS contained significant amounts of PAP which is an inhibitor of sulfotransferase (Duffel and Jakoby, 1981; Yang, et al., 1996) the assay mixture was preincubated for 15 min prior to the addition of DHEA to ensure that all PAP had been converted to PAPS by K65ER68G before complete enzymatic reaction was started. The production of MU was monitored by fluorescence as previously described. The change of fluorescence was linear for over 20 min of initial reaction time.
prepared from 20 g each of frozen rat or pig liver which was mixed with 20 ml buffer A (10 mM Tris-HCl at pH 7.4 plus 125 mM sucrose, 10% glycerol, 1 mM DTT, l.5 mM PMSF, and 1 mM EDTA) and homogenized with liquid nitrogen. Bacterial cell extract was prepared from about 1 g Escherichia coli pelleted from 250 ml cell culture, which was mixed with 20 ml buffer A and sonicated three times, then collect supernatants.
Results and Discussion
K65ER68G as catalyst for the regeneration of PAPS. In this proposed coupled-enzyme assay, PST was used to regenerate PAPS from PAP and MUS as illustrated in Figure 1. Under the similar conditions, arylsulfatase activity not only could be determined in the presence of only MUS but PST activity could be also determined in the absence of AST or its substrate. Two characteristics of wild-type PST, however, might prevent the effective production of PAPS. It had been shown that wild-type PST contained tightly bound PAP (Yang et al., 1996), a sulfotransferase inhibitor which exists in all sulfotransferase-catalyzed reactions. Moreover, phenols were also inhibitors of PST (Duffel and Jakoby, 1981). Under reducing conditions, the activity of PST could be significantly affected by the presence of PAP and/or phenol in the proposed PAPS regenerating system. A ternary complex of PST, PAP, and phenol might form to slow down the regeneration of PAPS from PAP (Marshall et al., 2000; Vakiani et al., 1998; Whittemore et al., 1985). Fortunately, previous studies had demonstrated that a PST mutant, K65ER68G, was free of the complications mentioned above (Yang et al., 1996). Preliminary studies showed that K65ER68G could efficiently catalyze the production of PAPS, and PAP and MU did not inhibit the reaction under the conditions adopted in this report. As shown in Table 1, Km for
MUS determined was not significantly affected by the pH of the solution. In contrast,
Vmax of the same reaction was significantly decreased at pH 9.0. These data were
useful for the design of coupled-enzyme assay.
Selection of excitation and emission wavelengths for the coupled-enzyme assay.
concentration of MUS (4 mM) was used to saturate the PAPS regenerating system based on data compiled in Table 1. A suitable excitation wavelength was determined to prevent the “inner filter effect” (Lackowicz, 1983) caused by the absorption of MUS. Briefly, due to different absorption spectra of MUS and MU the excitation (absorption) wavelength of MU must be selected carefully to avoid absorption from MUS. The excitation wavelength, therefore, was selected according to the absorption spectra of MU and MUS as shown in Figure 2. The suitable excitation wavelength was chosen by comparing the absorption spectra of the two compounds. Therefore, AST activity was in effect determined by the increase of fluorescence of MU at 450 nm upon excitation at 360 nm. The relative emission coefficient of the fluorescence at 450 nm was determined under different conditions as shown in Table 2. The sensitivity of this method could thus reach nM range since the pmole amount of MU could be reliably determined. The intensity of the fluorescence was significantly dependent on the pH value ranging from 6 to 10, primarily due to the deprotonation of MU at alkaline pH (pKa of MU = 7.8 (Sun et al., 1998)). The temperature effect was
less significant as shown in Table 2.
Coupled-enzyme assay. It is expected that the reaction rate of AST, which was in
the range of sub-µmole/min/mg (Chang et al., 2001), could be easily monitored using this coupled-enzyme system. It is worth pointing out that the major requirements for this assay were the adequate amount of MUS, an excess of K65ER68G activity, and a saturating PAPS concentration.
hDHEA-ST. Some background fluorescence due to the auxiliary reaction was
observed. This was probably because of the presence as an impurity of PAP in commercially available PAPS (Duffel and Jakoby, 1981; Yang et al., 1996;). The fluorescence background was, however, low in the absence of PAPS, K65ER68G, or MUS. Under these conditions, the auxiliary reaction did not take place. No effects were observed on the measured rates by raising the concentration of PAPS (data not shown), which indicated that PAPS concentration was saturating enough for the coupling system to reach its maximum activity. Taking together the results shown in Figure 3, it was concluded that the continuous changes in fluorescence were specifically attributable to hDHEA-ST activity.
To determine the linear range of AST assay at a given K65ER68G concentration (3.2 mU), the rate of MUS reduction was measured using a concentration range (0.07-1.35 µg) of hDHEA-ST as shown in Figure 4. Although this linear range and sensitivity of hDHEA-ST assay could be further extended, it was suitable for our needs under the present situation.
To test our coupled-enzyme assay and compare the results with the data appeared in the literature, the hDHEA-ST was characterized by this fluorometric assay as shown in Figures 5 to 7. These results fitted perfectly with previously reported data using radioactive assay procedures (Chang et al., 2001). Figure 5 shows the pH-dependency of the DHEA-sulfonating activity. The optimum pH spanned from 7 through 9. The enzyme activity at pH 6.0 was approximately 50% of that in the optimum pH range. Virtually no activity was detected at pH 10.0. The effects of temperature on the DHEA-sulfonating activity was examined over 25-50℃ as shown in Figure 6. Maximum sulfonating activity was observed at approximately 40℃. The enzyme activity at 25℃ and 50℃ were approximately 50% of maximal activity at
DHEA concentration on the DHEA-sulfonating activity. Significant substrate inhibition was observed as previously reported (Chang et al, 2004; Duffel and Jakoby, 1981). Substrate inhibition leading to the formation of a nonproductive enzyme-PAP-substrate complex (Marchall et al, 2000; Vakiani et al, 1998; Whittemore et al, 1985) in fact is a rather common feature among member of the sulfotransferase family (Falany et al, 1989; Marcus et al, 1980; Otterness et al, 1992). These results compare favorably to published Km values determined by a noncoupled,
radioisotopic thin-layer chromatography assay (Chang et al, 2001; 2004). DHEA were reported to yield Km and Kis values of 2.1 and 3.8 µM, respectively (Chang et al,
2001). This coupled assay determined these values to be 4.7 and 4.3 µM, respectively. We suggest that the discrepancy between these values is due to the inherent inaccuracy of the radioisotopic assay. This coupled-enzyme assay allows the continuous measurement of initial reaction velocity more accurately than end-point assays. Besides, it was found that the sensitivity of this fluorometric assay was comparable to that of the radioactive assay for AST reported in the literature (Chang
et al, 2001; 2004). The activity of the amount of enzyme used (100 ng) previously
could be easily determined by the present method as shown in Figure 4.
Determination of AST activity in biological samples. We further demonstrated the
feasibility of present assay for measuring AST activity in biological samples. In addition, several other enzyme activities associated with sulfonation/desulfonation could also be determined under similar conditions. Sulfatase, alcohol and phenol
could not be observed in the absence of PAPS, and therefore reaction condition II gave a background activity exhibited mainly by arylsulfatase. The sulfatase activity was further confirmed and quantified under the reaction conditions that contained only MUS and buffer (or in the absence of DHEA and PAPS, data not shown). PST activity could also be determined using a similar procedure (data was not shown since it did not interfere with the AST activity). In the absence of MUS, the fluorescence observed was close to the experimental error (data not shown) and represented the background derived from the interference of biological samples. Thus, the AST activity could be calculated simply by subtracting arylsulfatase activity from that measured in the complete coupled-enzyme reaction. Based on this method, the AST activity in rat liver was found to be significantly higher than that in pig liver or E. coli (Table 3). Moreover, the AST activity extracted from transformed E. coli cells (with pGEX-2TK) was approximately 100 times than that in untransformed cells.
Conclusion
We developed in this study a continuous fluorometric AST assay whose sensitivity was comparable to that of the end-point radioactive assay reported in the literature. This method was demonstrated to be useful for the determination of AST activities associated with homogeneous AST or those present in crude extracts from biological samples. This new assay procedure could be adapted for high-throughput assay using a microplate reader.
Acknowledgement
This work was supported by National Science Foundation, under Grant NSC 92-2311-B-009-003 and the Brain Research Center of the University System of Taiwan, under Grant 91B-711 and 92B-711.
Table 1
Production of PAPS from PAP and MUS catalyzed by K65ER68Ga
pH Km (µM) Vmax (nmol min-1 mg-1)
6.0 161 ± 14 204 ± 7
7.0 183 ± 15 399 ± 9
8.0 196 ± 21 142 ± 5
9.0 167 ± 51 2.9 ± 0.2
a The reaction mixture included 5 mM β-mercaptoethanol, 20 µM PAP, and MUS (50
µM - 3.2 mM) plus 0.55 µg enzyme in 100 mM buffer (MES at pH 6.0, potassium phosphate at pH 7.0, and Tris at pH 8.0 and pH 9.0). The Km and Vmax were obtained
using nonlinear regression by SigmaPlot 2001, V7.0 and Enzyme Kinetics Module, V1.1 (SPSS Inc., Chicago, IL).
Table 2
The Relative Emission Coefficient of MU at 450 nma
Relative Emission coefficient (cm-1nM-1)
Temperature (℃) pH 25 30 35 37 40 45 50 6.0 0.12 7.0 0.4 0.43 0.45 0.48 0.50 0.52 0.55 7.5 0.64 8.0 1.14 9.0 2.14 10.0 4.10 a
The fluorescence of MU (100, 200, and 400 nM) in 100 mM buffer (MES at pH 6.0, potassium phosphate at pHs 7.0 and 7.5, Tris-base at pHs 8.0 and 9.0 and glycine at pH 10.0) was determined with a spectrofluorometer (Hitachi F-4500, Japan). The excitation and emission wavelengths were at 360 and 450 nm, respectively.
Table 3
Activities of AST and arylsulfatase in biological samples a
Rat liver Pig liver E. coli E. coli ( with pGEX-2TK)
Reaction conditions Enzyme activity involved Specific activity (pmole/min/A280) Total activity (nmole/min/g) Specific activity (pmole/min/A280) Total activity (nmole/min/g) Specific activity (pmole/min/A280) Total activity (nmole/min/g) Specific activity (pmole/min/A280) Total activity (nmole/min/g) I. Complete AST+ sulfatase 245 ± 4 39.6 ± 0.7 132 ± 4 7.2 ± 0.2 6.1 ± 1.0 2.9 ± 0.7 280 ± 10 236 ± 8.1
II. – PAPS b sulfatase 34.5 ± 1.5 5.6 ± 0.2 21.2 ± 5.1 0.8 ± 0.3 0.4 ± 0.1 0.6 ± 0.1 5.0 ± 1.3 0.8 ± 0.2
I – II AST 210 ± 6 34.0 ± 0.9 113 ± 12 6.2 ± 0.4 5.6 ± 1.0 2.3 ± 0.7 274 ± 11 231 ± 9
a
Detailed procedures were described under Coupled-enzyme assay for AST in Materials and Method except that purified hDHEA-ST was replaced by the extract of biological sample. Specific activity referred to MU produced following the addition of extract whose protein
concentration was determined by absorption at A280. Total activity referred to MU produced with one gram of wet cell or liver.
b
O O CH3 HO O O CH3
PAP
PAPS
MUS
MU
PST
O S O O -O N N N N O NH2 HO O P O -O -O O P O O -O O S O -O N N N N O NH2 HO O P O -O -O O P O -O -O CH3 HO O CH3 CH3 O O CH3DHEAS
DHEA
S O O -OAST
Figure 1. Scheme for the determination of AST activity. This assay was based on the
regeneration of PAPS from PAP catalyzed by a recombinant PST (K65ER68G) using MUS as the sulfuryl group donor. In coupled-enzyme assay, PST represented an auxiliary enzyme, and the product, MU, was used as a fluorescent indicator of enzyme turnover. Moreover, the biosynthesis of PAPS from ATP and SO4
was catalyzed by hPAPS synthetase, which was a bifunctional enzyme with activity of ATP sulfurylase and APS kinase.
A
B
pH 6.0 Wavelength (nm) 250 300 350 400 450 Abso rb anc e 0.0 0.2 0.4 0.6 0.8 1.0 1.2 1.4 1.6 pH 7.0 Wavelength (nm) 250 300 350 400 450 Abs orb an ce 0.0 0.2 0.4 0.6 0.8 1.0 1.2 1.4 1.6C
D pH 8.0 Wavelength (nm) 250 300 350 400 450 Abso rb ance 0.0 0.2 0.4 0.6 0.8 1.0 1.2 1.4 pH 9.0 Wavelength (nm) 250 300 350 400 450 A b so rb an ce 0.0 0.2 0.4 0.6 0.8 1.0 1.2 1.4 1.6 1.8 2.0Figure 2. Absorption spectra of MUS and MU. The spectra were obtained in 1ml
aqueous solutions contained 100 µM MUS (○) or MU (●) and 100 mM buffer (MES at
Time (sec)
0
50
100
150
200
250
300
RFU
0
200
1200
1300
1400
Figure 3. Progress curves of the coupled-enzyme assay for AST. Complete reaction
(●) and control reactions without PAPS (○), DHEA (▼), MUS (▽), K65ER68G (■),
or hDHEA-ST(□) of coupled-enzyme assay for AST were conducted at pH 7.0, 37°C.
Detailed procedures were described under Coupled-enzyme assay for AST in Materials
hDHEA-ST (ng)
0
300
600
900
1200
1500
∆
Fl/min
-5
0
5
10
15
20
25
30
Figure 4. Effective range of fluorometric assay for hDHEA-ST. Complete reaction
(●) and control reactions without PAPS (○), DHEA (▼), MUS (▽), or K65ER68G (■) of coupled-enzyme assay were run in a total volume of 1000 µl at 37°C. Detailed
procedures were described under Coupled-enzyme assay for AST in Materials and
Methods. Each point was determined from triplicate assay data and standard error was
pH value
5
6
7
8
9
10
11
Specific activity (nmol/min/mg)
0
20
40
60
80
100
120
Figure 5. pH profile of recombinant hDHEA-ST. The enzymatic assays were carried
out with about 0.5 µg recombinant hDHEA-ST under the condition of Coupled-enzyme
assay for AST as described in Materials and Methods using different buffer systems (100
mM MES at pH 6.0, potassium phosphate at pH 7.0, Tris-base at pH 8.0 or 9.0, and glycine at pH 10.0). Each point was determined from triplicate assay data and standard error was obtained by SigmaPlot 2001, V7.0 (SPSS Inc., Chicago, IL).
Temperature (oC)
20
25
30
35
40
45
50
55
Specific activity (nmol/min/mg)
0
20
40
60
80
100
120
Figure 6. Temperature effect on the activity of recombinant hDHEA-ST. The
enzymatic assays were carried out with about 0.5 µg recombinant hDHEA-ST under the
condition of coupled-enzyme assay for AST at pH 7.0 in different temperature. Each point was determined from triplicate assay data and standard error was obtained by SigmaPlot 2001, V7.0 (SPSS Inc., Chicago, IL).
[DHEA] (
µM)
0
10
20
30
40
50
60
Specific activity (nmol/min/mg)
0
20
40
60
80
100
120
Figure 7. Substrate inhibition of DHEA on recombinant hDHEA-ST. The enzymatic
assays were carried out under the condition of coupled-enzyme assay for AST at pH 7.0 with about 0.5 µg recombinant hDHEA-ST and different DHEA concentrations (0.3 ~ 50.0 µM). The kinetic parameters were obtained using the substrate inhibition equation v
= V[S]/{Km + [S](1 + [S]/Kis)}by SigmaPlot 2001, V7.0 and Enzyme Kinetics Module,
Chapter 2 Effects of Quaternary structure on Cytosolic
Sulfotransferase Function
Cytosolic sulfotransferases (STs) catalyze the sulfonation of small molecules including xenobiotics, bioamines, hormones, and steroids. The enzymes, including mammalian phenol sulfotransferase (PST) and alcohol sulfotransferase (AST), are generally homodimers in solution and play a role in detoxication, hormone homeostasis and signal transduction, such as neurotransmission. Previous structural characterization of mutations within the dimer interface of cytosolic ST have demonstrated that KTVE motif are the common protein-protein interaction motif that mediates their homo- as well as heterodimerization. Through site-directed mutagenesis, and gel filtration, we also confirm that a single mutation of Val266 to Glu was sufficient to convert rat PST (rPST) to a monomer by breaking hydrophobic KTVE motif. The similar result was found in AST by mutation of Val260 to Glu. First, kinetic constants of substrates (pNPS and DHEA) and cofactors (PAP and PAPS) were determined to identify the effect of dimerization on cytosolic ST catalysis. Second, due to stimulatory and inhibitory effects of metal ions on cytosolic STs, metal effect on dimeric and monomeric STs was also compared. No significant difference on catalysis between dimer and monomer was observed either in PST and AST. Therefore, thermal inactivation was investigated into the thermostability in dimeric and monomeric STs. Although the importance of dimerization still cannot be elucidated by these studies, redox effect and stiochiometry of binary (PAP-ST) or ternary complex (PAP-substrate-ST) need to be characterized for understanding this special protein-protein interaction in cytosolic STs.
Introduction
Sulfotransferases (STs) are a large family of enzymes that catalyze the transfer of sulfuryl group from the common 3’-phosphoadenosine 5’-phosphosulfate (PAPS) to numerous endogenous and exogenous compounds (Jakoby and Ziegler, 1990). Cytosolic STs catalyze the transfer of the sulfuryl group to numerous small molecules including steroids, bioamines, therapeutic drugs, and environmental chemicals. Therefore, sulfonation is not only considered to be deactivation and secretion processes of biological signal molecules and xenochemicals, but also be involved in maintaining physiological homeostasis such as steroid hormones (Falany, 1997).
Cytosolic STs consist of around 300 amino acid residues, and are found as dimers in solution. It has been reported that STs are capable of forming not only homodimers but also heterodimers. For example, the sulfonation activity of N-hydroxy-2-acetylaminofluorene is associated with three different dimers of STs from rat liver cytosol. Interestingly, they are aryl ST-IV dimer, ST1C1 dimer, and AST-IV/ST1C1 heterodimer determined through purification and mass analysis (Kiehlbauch et al., 1995). However, protein-protein interaction of STs has not been well studied and the functional significance of the dimerization process is not known at the present time. The crystal structures of numerous cytosolic STs have recently been solved (Bidwell et al., 1999; Dajani et al., 1999; Kakuta et al., 1997; Kakuta et al., 1998; Pedersen et al., 2000), and they reveal a conserved PAPS-binding site and similar
by the dimer interface. Previously, structural comparisons and mutagenesis studies were undertaken with mouse SULT1E1 (a monomer) and human SULT1E1 (a dimer) in an attempt to identify a common structural motif. It was found that the mutations V269E and V260E converted the homodimers SULT1E1 and SULT2A1, respectively, into monomers. It was further shown that the mutations P269T and E270V in mouse SULT1E1 precipitated the formation of a homodimeric structure. It was concluded that the common motif KxxxTVxxxE (KTVE motif) is responsible for the dimerization of STs (Petrotchenko et al., 2001).
To date, despite protein-protein interaction was found since 2001 (Petrotchenko et al., 2001), the effect of quaternary structure on cytosolic sulfotransferase catalysis was still not elucidated. In this report, we show a single mutation of valine to glutamic acid was sufficient to convert dimeric ST to a monomer by breaking hydrophobic KTVE motif. To identify effects of the dimerization on sulfotransferase function, we generated two monomeric STs from rat phenol sulfotransferase and human DHEA sulfotransferase to investigate metal effect, substrate inhibition, redox effect, and stiochiometry of binary or ternary complex.
Experimental Procedures
Materials. pNPS, pNP, DHEA, MUS, β-naphthol, PAP, PAPS,
tris[hydroxymethyl]aminomethane (Tris), phenylmethylsulfonyl fluoride (PMSF), [ethylenedinitrilo] tetracetic acid (EDTA), PAP-agarose and dithiothreitol (DTT) were purchased from Sigma (St. Louis, MO). Potassium phosphate (dibasic), glycine, and sodium dodecyl sulfate (SDS), metal ions were obtained from J. T. Baker (Phillipsburg, NJ 08865 U.S.A.). DEAE Sepharose fast flow, Prep Sephacryl S-200 HR, PCR and gel band purification kit, and low molecular weight gel filtration calibration kit were obtained from Amersham Pharmacia Biotech Asia Pacific (Hong Kong). Oligonucleotides were obtained from Mission Biotech (Taipei, ROC). Taq polymerase, and reagents for PCR were obtained from New England Biolabs (Taiwan). Plasmid DNA extraction Kit was purchased from VIOGENE (Illkirch Cedex, France) and Agarose was purchased from Ultra Violent (Taipei, ROC). All other chemicals were of the highest purity commercially available.
Site-Directed Mutagenesis. Double-stranded primers (forward primer, 5’-ttcactgaa
gcccagaatgag, and reverse primer, 5’-ggcttcagtgaaggtattttt) encoding a single amino acid mutation in the PST gene was used to get mutated PST by means of Quickchange protocol. Wild-type PST cDNA packaged in pET3c prokaryotic expression vector was used as the template in conjunction with specific mutagenic primers. Thirty cycles of
400 µM concentrations of each of the four deoxynucleotide triphosphates (dNTPs), 1×
PfuTurbo buffer, and 2.5 units of PfuTurbo DNA polymerase. The PCR product was
treated with DpnI for 1 h at 37 °C followed by transformation of BL21 (DE3)
Escherichia coli cells. C. The mutated PST sequence was verified by nucleotide
sequencing (Sanger et al., 1977). The same protocol was also utilized to generate monmeric DHEA-ST by mutation residue 260 from valine to glutamic acid using double-stranded primer (forward primer, 5’-ttcactgaagcccagaatgag, and reverse primer, 5’- ggcttcagtgaaggtattttt).
Preparation of wild-type and mutant enzymes. Recombinant wild-type and mutant
(V266E) PST were cloned into an expression vector, pET3c (Chen et al., 1992), while recombinant wild-type and mutant (V260E) DHEA-ST were cloned into an expression vector, pGEX-2TK (Chang et al., 2001). Four plasmids were transformed into
Escherichia coli BL21 (DE3) for overexpression. The enzyme isolation procedures were
the same as described earlier (Chang et al., 2001; Yang et al., 1996), which resulted in a homogeneous protein as determined by SDS-polyacrylamide gel electrophoresis (Laemmli, 1970).
Determination of protein concentration. Protein concentration of the homogeneous
form of wild-type and mutant form of PST and DHEA-ST were estimated on the basis of absorbency at 280 nm (1.7 ml/mg cm-1 and 2.4 ml/mg cm-1, respectively) (Gill and von Hippel, 1989) with a UV/Vis spectrophotometer (Hitachi UV/Vis-3300, Japan).
Enzyme assay for PST. PST activity was determined based on the change of
absorbency at 400 nm due to the production of pNP (ε = 10,500 cm-1
M-1 at pH 7.0) from
pNPS as measured using a UV/Vis spectrophotometer (Hitachi UV/Vis-3300, Japan). The
reaction mixture included 5 mM 2-mercaptoethanol, 1 mM pNPS, 2 µM PAP, 100 mM Bis-Tris propane (at pH 7.0), and 2 µg PST. The α-form activity was determined in the absent PAP, and the β-form activity was the difference between total and α-form activity.
The spectrophotometric physiological assay followed the decrease in absorbance of freshly prepared pNP (100 µM) when PAPS (300 µM) was the sulfuryl group donor. Rate
was linear with time when average absorbance changed at 400 nm of less than 0.025 per minute was followed for 3 minute.
Coupled-enzyme assay for AST. Reaction mixture (1ml) contained 100 mM potassium
phosphate buffer (pH 7.0), 5 mM 2-mercaptoethanol, 20 µM PAPS, 4 mM MUS, 5 µM DHEA, 3.2 mU (5.4 µg) K65ER68G. AST (hDHEA-ST or crude extract) was added
following a preincubation period so as to start the reaction at 37°C (Chen et al., 2005). Because commercial PAPS contained significant amounts of PAP which is an inhibitor of sulfotransferase (Duffel and Jakoby, 1981; Yang, et al., 1996) the assay mixture was preincubated for 15 min prior to the addition of DHEA to ensure that all PAP had been converted to PAPS by K65ER68G before complete enzymatic reaction was started. The production of MU was monitored by fluorescence as previously described. The change of fluorescence was linear for over 20 min of initial reaction time.
size exclusion chromatography, proteins were exchanged into 20 mM Tris base (pH 7.5), 50 mM sodium acetate, 250 mM NaCl, 0.1 mM EDTA (SEC buffer), using a Millipore ultrafiltration unit. Aliguots (2 ml of 10 mg/ml protein solution) were injected onto a Pharmacia Sephacryl S-200 HR column and eluted with SEC buffer at 4℃ at flow rate
of 0.5 ml/min. Protein elution was monitored by absorbance at 280 nm, and fractions were collected and analyzed by enzyme assay to confirm the presence and retention time of sulfotransferase. Molecular weights were estimated against calibration standards: ribonuclease A (15.6 KDa), chymotrypsinogen A (19.4 KDa), ovalbumin (47.6 KDa), and Albumin (62.9 KDa).
Kinetic constants determinations. Measurement of the kinetic constants of each
substrate was performed by varying the concentrations of one substrate, while keeping the other substrate at a fixed and near saturating concentration. The apparent Km and Vmax
were determined using nonlinear regression by Sigmaplot 2001, V7.0 and Enzyme Kinetics Module, V1.1 (SPSS inc., Chicago, IL).
Determination of the Stimulatory/Inhibitory Effects of Divalent Metal Cations on PST, AST, and their mutants. To determine the stimulation/inhibition patterns of divalent
metal cations on purified sulfotransferases, enzymatic assays in the presence or absence of divalent metal cations were performed. The standard assay mixture (phosphate buffer was replaced by HEPES buffer) was similar as described under enzymatic assay but also contained 10 mM of the divalent cation tested, while controls containing all the reagents, but without divalent metal ion or with 10 mM EDTA, were assayed in parallel.
Thermal inactivation studies. Activity measurements were preincubated in the
dry-bath at the desired temperature, and were performed by enzymatic assay after a 10 min incubation. The reaction mixture was the same as described in enzyme assay.
Results and Discussion
Mutated enzyme preparation. Previous structural studies have delineated the
physiological dimerization interface of cytosolic sulfotransferases to the conserved sequence KXXXTVXXXE that occurs near the C-terminus (Petrotchenko et al., 2001). The KTVE motifs of two given monomers appear to form a zipper-like, anti-parallel interface, leading to the dimerization of two monomers. The main feature of the interface can be described as complementary hydrophobic interactions and backbone hydrogen bonds in the central portion of motif that are reinforced by an ion pair at each end of the motif (Petrotchenko et al., 2001). For the reason, residue 266, valine, of PST was selected and mutated to glutamic acid, and the product of site-directed mutagenesis was seen in
Figure 1a. The same protocol was also utilized to generate monmeric DHEA-ST by
mutation residue 260, valine, to glutamic acid (data not shown). Using bacterial expression, V266E mutant of PST was purified through DEAE sepharose, Sephacryl S-200 HR, and PAP-agarose to get homogeneous forms analyzed by SDS-PAGE in
Figure 1b. For the expression and purification of V260E DHEA-ST, GSTrap Fast Flow,
Sephacryl S-200 HR, and PAP-agarose were used (data not shown).
Calibration curve preparation and molecular weight estimation. SEC (Sephacryl
S-200 HR) was used to examine the quaternary structure of V266E and V260E mutants compared to the wild-type PST and DHEA-ST, respectively. Using a set of molecular weight standards, the calibration curve in which Vo (the retention time of eluted blue dextran) was 35.70 ml was prepared by plotting log(molecular weight) versus retention
time in Figure 2. Detail parameters under this condition were described in Table 1. By means of the calibration curve, the apparent molecular weight of wild-type and mutant PST and DHEA-ST were calculated as described in Table 2. The estimated molecular weight of wild-type PST was approximately 2-fold than that of V266E. These data indicated that the interface of dimerization was easily disrupted through site-directed mutagenesis to form monomeric PST because glutamic acid might spoil hydrophobic zipper-like KTVE motif as similar in previous studies (Petrotchenko et al., 2001). Similar result was observed between wild-type and V260E DHEA-STs.
Kinetic analysis. Kinetic constants of pNPS and PAP catalyzed by wild-type and
V266E PST were determined by transfer reaction as described in Table 3. Apparently Km
values for PAP of the monomer and dimmer were 75 and 69 nM, respectively, and the Km
values for pNPS were 2.28 and 2.29 µM, respectively. This experiment indicated that the
behavior of monomer (V266E) with respect to pNPS and PAP was significantly yet different with comparison from wild-type PST. However, this data conflicted with previous studies that approximately 0.5 equivalents of PAP bound per subunit for wild-type (dimeric) PST (Yang et al., 1996). Similar kinetic data were observed in wild-type and V260E DHEA-ST as described in Table 4. Substrate inhibition was found both in wild-type and V260E DHEA-ST, but kinetic constants either in Km and Kis were
cytosolic STs (Sakakibara et al., 1994; Suiko et al., 1996). For example, the activity of human monoamine PST was strongly stimulated by Mn2+, and this result may be corresponding to neurodegenerative disease (Suiko et al., 1996). In this experiment, we report a systematic investigation of the effects divalent metal cations on the activities of PST, AST, and their mutants as shown in Table 5. The degrees of inhibition or stimulation were calculated by comparing the activities determined in the presence of metal cations with the activities determined in the absence of metal cations or with 10 mM EDTA. Both in PST and V266E PST, stimulatory effect was observed by Mg2+, Na2+, Mn2+, Ca2+, and Co2+, while inhibitory effect was observed by Fe2+. However, in DHEA-ST and V260E DHEA-ST, stimulatory effect was only observed by Mg2+and Ca2+, while inhibitory effect was observed by Mn2+ and Co2+. Although there was different pattern between PST and DHEA-ST, there was not significantly distinctness between wild-type and defects in quaternary structure of PST and DHEA-ST.
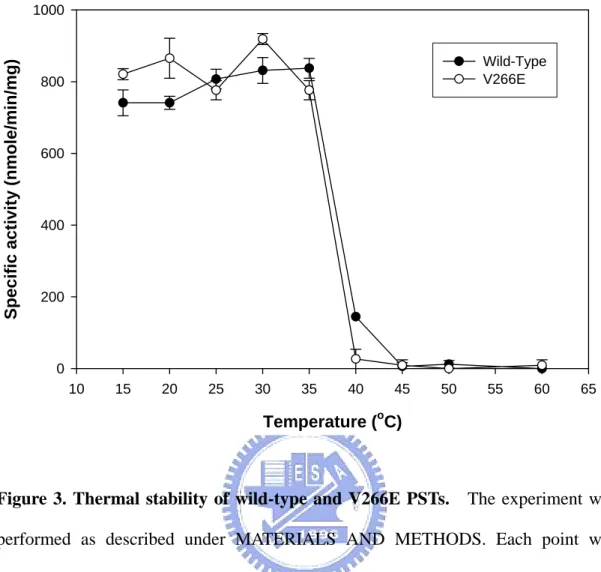
Thermal inactivation. The quaternary structure of protein was shown to be
responsible for its thermal stability (Julia et al., 2003). Therefore, independence of sulfotransferase catalysis, we assessed the conformational ability of wild-type and dimer interface mutant (V266E) by determining the effects of temperature on their catalytic activity (Figure 3). Steep inactivation was observed between 35 to 40 ℃ in both enzymes.
The experiments showed that the V266E mutant has similar thermal ability to the wild-type enzyme in this assay. Similar pattern was observed in wild-type and V260E DHEA-ST except steep inactivation occurred between 40 to 50 ℃ (data not shown).
Conclusion
Monomeric ST was easily obtained by disrupting KTVE motif. Using site-directed mutagenesis, rat PST and human DHEA-ST, were mutated to the monomer analyzed by gel filtration (Table 1-2). Preliminary results (Table 3-5) had shown that catalytic properties of monomeric ST might not be significantly different from those of the homodimeric form. However, the data also conflicted with previous studies that approximately 0.5 equivalents of PAP bound per subunit for wild-type (dimeric) PST (Yang et al., 1996). These results indicatesthat previous data with the wild-type enzyme may require reinterpretation. Moreover, independence of sulfotransferase catalysis, thermal stability of wild-type and defect in quaternary structure was similar. Therefore, to understand the importance of quaternary structure on sulfotransferase catalysis, redox effect and stiochiometry of binary (PAP-ST) or ternary complex (PAP-substrate-ST) needed to be characterized.
Table 1
Calibration standard proteins and parameters of gel filtration
Standard a Mw log(Mw) Ve b Kav c Albumin 67000 4.83 50.59 0.2 Ovabumin 43000 4.63 56.78 0.3 Chymotrypsinogen A 25000 4.40 69.96 0.4 Ribonuclease A 13700 4.14 77.79 0.5 a
Standard proteins were purchased from Amersham Pharmacia Biotech Asia Pacific (Hong Kong).
b
Ve represents the retention time of eluted protein under the condition as described under
Preparation of Calibration Curve in MATERIALS AND METHODS.
c
Table 2
Molecular weight determination on Sephacryl S-200 HR
sample Ve a Kav b log(Mw) Mw c rPST(wtd) 52.8 0.20 4.75 56514 rPST(V266E) 64.5 0.34 4.47 29246 hDHEA-ST(wt) 49.2 0.16 4.84 69921 hDHEA-ST(V260E) 61.5 0.30 4.55 35700 a
Ve represents the retention time of eluted protein under the condition as described under
Preparation of Calibration Curve in MATERIALS AND METHODS.
b
Kav was calculated by the equation (Kav = (Ve – Vo) / (Vt – Vo) ) c
The apparent molecular weight (Mw) was calculated by comparison of retention time (Ve) to data obtained from molecular weight standards described under Table 1.
d
Table 3
Kinetics of pNPS and PAP with rat wild-type and V266E PST a
pNPS a PAP b PST Km mM Vmax nmol/min/mg Km µM Vmax nmol/min/mg Wild type 2.29 ± 0.14 1218 ± 44 0.075 ± 0.011 1322 ± 64 V266E 2.28 ± 0.19 1320 ± 62 0.069 ± 0.019 1225 ± 41 a
The reaction mixture included 5 mM β-mercaptoenthanol, 2 µM PAP, and pNPS (0.75
- 5 mM) plus 2 µg enzyme in 100 mM buffer (Bis-Tris propane at pH 7.0). The Km and
Vmax were obtained using nonlinear regression by SigmaPlot 2001, V7.0 and Enzyme
Kinetics Module, V1.1 (SPSS Inc., Chicago, IL).
b
The reaction mixture included 5 mM β-mercaptoenthanol, 1 mM pNPS, and PAP (0.01 - 2 µM) plus 2 µg enzyme in 100 mM buffer (Bis-Tris propane at pH 7.0). The Km
and Vmax were obtained using nonlinear regression by SigmaPlot 2001, V7.0 and Enzyme
Table 4
Kinetics of DHEA and PAPS with rat wild-type and V260E DHEA-ST a
DHEA a PAPS b AST Km µM Kis µM Vmax nmol/min/mg Km µM Vmax nmol/min/mg Wild type 4.7 ± 0.3 4.3 ± 0.3 119 ± 10 3.9 ± 0.4 125 ± 12 V266E 5.6 ± 0.5 4.9 ± 0.5 125 ± 15 4.2 ± 0.6 131 ± 20 a
The reaction mixture included 5 mM β-mercaptoenthanol, 20 µM PAPS, and DHEA (0.3 - 50 µM) plus 0.5 µg enzyme in 100 mM buffer (potassium phosphate at pH 7.0).
The Km, Kis,and Vmax were obtained using nonlinear regression by SigmaPlot 2001, V7.0
and Enzyme Kinetics Module, V1.1 (SPSS Inc., Chicago, IL).
b The reaction mixture included 5 mM β-mercaptoenthanol, 5 µM DHEA, and PAPS
(0.5 - 20 µM) plus 0.5 µg enzyme in 100 mM buffer (potassium phosphate at pH 7.0).
The Km and Vmax were obtained using nonlinear regression by SigmaPlot 2001, V7.0 and
Table 5
Inhibitory/stimulatory effects of divalent metal cations on the activities of PST, AST, and their mutants a.
Enzymes Metal cations PST V266E PST DHEA-ST V260E DHEA-ST LiCl2 97% 94% 100% 101% MgCl2 113% 109% 122% 115% MnCl2 110% 104% 50% 50% CaCl2 120% 110% 128% 110% ZnCl2 N.D. b N.D. b N.D. b N.D. b FeCl2 25% 20% N.D. b N.D. b CoCl2 115% 110% 17% 10% NaCl2 100% 99% 100% 105% a
Specific activities of the STs are determined in the concentration of the divalent metal cations tested was 10 mM. Data shown represent percentage compared with control (100 %).
b
N.D. refers to “no activity detected" and, therefore, the complete inhibition of the
(a) (b)
Figure 1. PCR product of mutagenesis and SDS-PAGE. (a) Lane 1 and 2 were the plasmid of wild-type and V266E, respectively. Lane 3 was DNA marker made of 500, 1000, 1500, 2000, 2500, 3000, 4000, 5000, 6000, 8000, 10000 bp. (b) Lane 4 was homogeneous form of V266E rPST, and lane 5 was protein marker made of phosphorylase b (97 kDa),bovine serum albumin (66 kDa),ovalbumin (45 kDa), carbonic anhydrase (30 kDa),soybean trypsin inhibitor (20.1 kDa).
97 66 45 30 20 1 2 3 4 5 (KDa)
log (molecular weight) 4.2 4.4 4.6 4.8
Kav
0.1 0.2 0.3 0.4 0.5 0.6 y = -0.48x + 2.52 R2 = 0.98Figure 2. Calibration curve on Sephacryl S-200 HR. A molecular weight calibration curve, which defined the relationship between the elution volumes of a set standards and the logarithm of their respective molecular weights, was determined with Prep Sephacryl S-200 HR as described under MATERIALS AND METHODS. Calibration standards used were ribonuclease A (15.6 KDa), chymotrypsinogen A (19.4 KDa), ovalbumin (47.6 KDa), and Albumin (62.9 KDa).
Temperature (oC) 10 15 20 25 30 35 40 45 50 55 60 65 Spe c if ic a c tivit y ( n mol e /min/ m g) 0 200 400 600 800 1000 Wild-Type V266E
Figure 3. Thermal stability of wild-type and V266E PSTs. The experiment was performed as described under MATERIALS AND METHODS. Each point was determined from triplicate assay data and standard error was obtained by SigmaPlot 2001, V7.0 (SPSS Inc., Chicago, IL).
Chapter 3 Molecular Cloning, Expression, Purification, and
Fluorometric assay of human PAPS synthetase
Sulfonation is a major pathway in the biotransformation of many xenobiotic compounds, such as drugs and toxic chemicals. 3’-phosphoadenosine 5’-phosphosulfate (PAPS) plays a key role in offering sulfuryl group to sulfotransferases for mediating these reactions. In higher organism, such as human and mouse, the synthesis of PAPS from inorganic sulfate and ATP is catalyzed by bufunctional enzyme called PAPS synthetase (PAPSS). In this project, we successfully cloned the gene for human PAPSS1 as a step forward understanding tissue-specific expression of this enzyme. In addition, a convenient fluorometric assay for PAPSS had been developed. This assay replaced end-point radioisotopic method and was the first continuous method in this report. PAP-free PST proved to be ideal under the present situation because of its higher tolerance to substrate inhibition by PAP and MU and inhibition by ATP, a substrate for PAPSS-catalyzed step, than wild-type PST. PAP-free PST, therefore, was used to catalyze PAPS, which biosynthesized by human PAPSS, with MU as sulfuryl group acceptor in the literature. The reactant, MU, served as fluorometric indicator to monitor hPAPSS activity. This method not only is useful for the routine and detailed kinetic study of this important class of enzymes but also has the potential for the development of a high-throughput procedure using microplate reader.
Introduction
Sulfonation, an important pathway in the metabolism of many drugs, other xenobiotics, and biomolecules, is mediated through the universal sulfuryl group donor, 3’-phosphoadenosine 5’-phosphosulfate (PAPS) (Gregory and Robbins, 1960). PAPS plays a role in offering sulfuryl group for the sulfotransferases that catalyze these reactions (Klaassen and Boles, 1997; Weinshilboum and Otterness, 1994). In prokaryotes, PAPS is synthesized from 2 moles of ATP and 1 mole of SO42- by two
separate enzymes, ATP sulfurylase and adenosine 5’-phosphate kinase (Farooqui, 1980; Klaassen and Boles, 1997). The former enzyme catalyzes the synthesis of adenosine phosphosulfate (APS) from ATP and SO42-, while the latter enzyme
phosphorylates APS in the presence of another molecule of ATP to form PAPS. However, in higher organisms, such as human and mice, these reactions are catalyzed by a single bifunctional enzyme, PAPS synthetase (PAPSS) (Figure 1, step A). Previously, two isoforms of PAPSS, PAPSS1 and PAPSS2, have been identified in both humans and mice (Girard et al., 1998; Kurima et al., 1998; Li et al., 1995; ul Haque et al., 1998; Venkatachalam et al., 1998). Northern blot analysis showed different patterns of tissue expression: PAPSS1 mRNA was highly expressed in human brain, whereas PAPSS2 mRNA was not, but the opposite was true of human liver (Xu et al., 2000).
Despite the considerable progress made in recent years on PAPSS enzymes, rare evidences demonstrated different PAPSS patterns of tissue expression, and no
conducted by monitoring [35S]PAPS from free carrier [35S]SO42- (Hazelton et al.,
1985; Vargas, 1988; Wong et al., 1990) which involve stopping the reactions by heat treatment after a fixed time interval, removing precipitates formed by centrifugation, and changing the solvent system prior to thin-layer or paper chromatography. These procedures are tedious for routine and detailed kinetic studies of PAPSS enzymes. Other reported PAPSS assays are also end-point analyses requiring the determination of PAPS using radiochemical coupled-enzyme assay (Xu et al., 2000). In an attempt to begin the process of characterizing PAPSS activity, the present study was to develop a convenient assay in order to address theses important issues.
Here, we report the molecular cloning, expression, and purification of human PAPSS (hPAPSS) for the biosynthesis of PAPS (Figure 1, step A). This reaction was coupled to PAP-free PST, and a continuous fluorometric assay was developed. In this assay, the depletion of MU to MUS with PAPS as the sulfuryl group donor was catalyzed by PAP-free PST in physiological reaction (Figure 1, step B). The reactant, MU, served as fluorometric indicator to monitor hPAPSS activity.
Experimental Procedures
Materials. MUS, MU, DHEA, PAP, PAPS, tris[hydroxymethyl]aminomethane
(Tris), 2-[N-morpholino]ethanesulfonic acid (MES), phenylmethylsulfonyl fluoride (PMSF), [ethylenedinitrilo] tetracetic acid (EDTA), glutathione (reduced form) and dithiothreitol (DTT) were purchased from Sigma (St. Louis, MO). Potassium phosphate (dibasic), glycine, and sodium dodecyl sulfate (SDS) were obtained from J. T. Baker (Phillipsburg, NJ 08865 U.S.A.). PCR and gel band purification kit, Hitrap chelating column, Hitrap Q column, and glutathione S-transferase Sepharose fast flow was obtained from Amersham Pharmacia Biotech Asia Pacific (Hong Kong). Oligonucleotides were obtained from Mission Biotech (Taipei, ROC). Taq polymerase, T4 ligase, and reagents for PCR were obtained from New England Biolabs (Taiwan). Plasmid DNA extraction Kit was purchased from VIOGENE (Illkirch Cedex, France) and Agarose was purchased from Ultra Violent (Taipei, ROC). All other chemicals were of the highest purity commercially available.
Construction of Full-length of hPAPSS for Escherichia coli. The experimental
method was modified from Satishchandran and Markham (1998). Bacterial clone containing the huamn ATP sulfurylase/ APS kinase coding sequence cloned into the vector pCMV-SPORT6 was purchased from OPEN Biosystems. The plasmid was isolated and verified for the presence of the hPAPSS insert and the CMV promoter in the proper orientation by DNA sequencing using T7 and pCMV-SPORT6 reverse
5'-CCGGAATTCCATGCAGAGAGCAACCAATGT-3’ and reverse primer, 5'-GCCAAGCTTCTAAGCTTTCTCCAAGGATTT-3’. All PCR amplifications were performed in a Perkin-Elmer thermal cycler using Taq polymerase from New England Biolabs (Taiwan). Standard cycling parameters included a 2 min preincubation at 94 °C followed by 35 cycles of 1 min at 94 °C, 1 min at 60 °C, and 2 min at 72 °C. Following the cycling phase, there was a final extension for 7 min at 72 °C. The PCR product was analyzed on a 1% low melting agarose gel; the expected product (1.9 kilobase pairs) was sliced out of the gel and purified with a spin cartridge (Pharmacia) according to the manufacturer’s instructions. The Novagen pET-21b system was chosen for bacterial expression of the cloned human bifunctional enzyme. All DNA fragments to be expressed were inserted into the EcoRI / HindIII doubly- digested plasmid, and transformed into DH5α competent cell. Positive clones were identified by both restriction mapping and DNA sequencing of the entire insert.
Preparation of hPAPSS. The experimental method was modified from
Satishchandran and Markham (1998). The positive clones were sequenced in their entirety before transformation into BL21 (DE3) cells by the CaCl2 method. A single
colony was used to inoculate an LB/ampicillin liquid culture which was then placed on a shaker at 37 °C. Growth was continued to an A600 of 0.4–0.6 and then the culture
was centrifuged, and the cells were resuspended in LB/ampicillin and stored overnight at 4 °C. This suspension culture was subsequently used to inoculate a second, larger LB/ampicillin liquid culture which was grown with shaking at 37 °C for approximately 4 h; then cDNA expression was induced with 1 mM isopropyl-thio-β-D-galactoside (IPTG) during additional 12 hr incubation. The cultures were centrifuged at 8000 rpm for 20 min, and the pellet was sonicated in
removal of cellular debris by ultracentrifugation at 15,000 rpm for 30 min, the supernatant was diluted 1:2 in IMAC 5 sonication buffer. To purify the expressed protein, the chelating column from Pharmacia was used following the supplier’s protocol. Briefly, the resin was washed with double distilled H2O to remove ethanol
from the storage solution, charged with 100 mM NiSO4, and then equilibrated in
sonication buffer. And then crude supernatant was loaded onto the 5-ml column in a 1:1 dilution with sonication buffer and incubated at 4 °C for 20 min with intermittent mixing. Following incubation, the flow-through was collected, and the column was washed with 30 mM imidazole to remove the majority of nonspecifically bound bacterial proteins, after which the expressed protein was eluted with 400 mM imidazole. The purified protein was dialyzed against Q column buffer (50 mM Tris, pH 8.0, 1 mM dithiothreitol, 1 mM EDTA, 10% glycerol) overnight for purification with Hitrap Q. Then the Q column was eluted with 0.5 M NaCl gradient (total volume 500 mL with flow rate at 1 mL/min).
Preparation of PAP-free PST. The β-form of recombinant PST (Yang et al., 1996)
was used as the PAP-free enzyme. Recombinant mutant PST, K65ER68G, was cloned into an expression vector, pET3c, and transformed into Escherichia coli BL21 (DE3) (Chen et al., 1992). The enzyme isolation procedure was the same as described earlier (Yang et al., 1996), which resulted in a homogeneous protein as determined by SDS-polyacrylamide gel electrophoresis (Laemmli, 1970).
PST assay. The activity of PAP-free PST, K65ER68G, was determined based on
the change of fluorescence due to the depletion of MU as measured using a spectrofluorometer (Hitachi F-4500, Japan). The excitation and emission wavelengths were 360 nm and 450 nm, respectively. The reaction mixture included 5 mM 2-mercaptoethanol, 20 µM MU, 20 µM PAPS, 100 mM potassium phosphate buffer (pH 7.0), and 15 µg K65ER68G. This assay was also referred to as a physiological reaction catalyzed by K65ER68G. One unit was defined as 1 µmol of PAPS converted to PAP per minute with 4-methylumbelliferone under the reaction conditions described above.
Coupled-enzyme assay for PAPSS. Reaction mixture (1ml) containing 100 mM
potassium phosphate buffer (pH 7.0), 5 mM 2-mercaptoethanol, 1 mM ATP, 4 mM Na2SO4, 1 mM MgCl2, 20 µM MU,3 mU (5 µg) K65ER68G, and 1-2 µg hPAPSS.
ATP or Na2SO4 was added last so as to start the reaction at 25°C.
Preparation of APS and PAPS. This method was modified from Satishchandran
and Marjham (1989). In brief, the reaction mixture for the preparation of APS and PAPS contained 1 mM MgCl2, 1 mM ATP, 4 mM carrier free Na2SO4, 100 mM
Tris-HCl (pH 7.0), 5.0 units of inorganic pyrophosphatase, and 2.0 unit of purified ATP surturylase/APS kinase (PAPSS) in a total volume of 50 µl. The reaction after 30 min was stopped by placing the reaction vessel in a boiling water bath for 2 min. The precipitate formed was removed by centrifugation (stage I). HPLC analysis showed that the SO42- was completely converted to PAPS. In order to facilitate purification of
reaction was stopped by boiling, and the precipitate was removed by centrifugation (stage II). For the synthesis of APS, 25 units of either 3’-nucleotidase or P1-nuclease were added to stage I material, and the mixture incubated for 30 min in order to convert PAPS to APS. The reaction was terminated by placing the reaction vessel in a boiling water bath, and the precipitate was once again removed by centrifugation (stage III). Pure PAPS and APS could be obtained by HPLC with RP-18 column with
pump A (0.1 M KH2PO4 and 10 mM TBHS at pH 5.8, 0.9 ml/min) and pump B