Pergamon
hf. J. Heat Maw Transfer. Vol. 41, Nos 4-5, pp. 719-733, 1998 0 1997 Elsevier Science Ltd. All rights reserved
Printed in Great Britain OOl7-9310198 Sl9.00+0.00 PI1 : 0017-9310(97)00165-8
Experimental study of aspect ratio effects on
longitudinal vortex flow in mixed convection of air
in a horizontal rectangular duct
M. Y. CHANG and T. F, LINTDepartment of Mechanical Engineering, National Chiao Tung University, Hsinchu, Taiwan (Received 22 January 1997 and in final form 28 May 1997)
Abstract-Combined flow visualization and temperature measurement were carried out to investigate the effects of the aspect ratio on the spatial and temporal characteristics of the longitudinal vortex air flow in a bottom heSIted horizontal rectangular duct. In the experiment, the Reynolds number was varied from 2.5 to 50, the Rayleigh number from 3000 to 20,000 and the aspect ratio from 2 to 12, covering the steady and unsteady longitudinal vortex flows. The results indicated that the spatial vortex flow structure in a low aspect ratio duct is similar to that in a high aspect ratio duct with the central portion of the wider duct around x = A/2 removed, but the unstable vortex flow at high Re and Ra can be stabilized when the aspect ratio is reduced. Besides, in a high aspect ratio duct (A > 8) a reduction in the Reynolds number causes the flow to change from steady to unsteady state with more frequent roll splitting and merging. While in a low aspect ratio duct (A < 6) at decreasing Re the roll cross-section exhibits cyclic expansion and con- traction in time and the longitudinal rolls become snaking and time periodic in the downstream portion of the duct. At a higher buoyancy-to-inertia ratio the snaking motion of the rolls gets more intensive and is initiated at a shorter distance from the duct inlet. When the value of the aspect ratio is an odd number, it was found that there are still an even number of rolls induced in the duct. The transition from steady to time-dependent state at increasing buoyancy-to-inertia ratio is subcritical in a high aspect ratio duct (A > 8). However, in a low aspect ratio duct (A < 6) there exists a finite range of the buoyancy-to-inertia ratio for the appearance of the time-periodic snaking vortex flow. Finally, the measured oscillation
frequencies of the time periodic snaking vortex flow were correlated. 0 1997 Elsevier Science Ltd.
1. INTRODUCTION
The buoyancy driven secondary flow structure and the associated thermal characteristics in a mixed con- vective flow through a bottom heated horizontal rec- tangular duct can be significantly affected by the duct aspect ratio A (dust width/duct height), in addition to the Prandtl, Reynolds and Rayleigh numbers. In a low aspect ratio duct (A < 4) the viscous damping effects of the side walls are expected to play an impor- tant role in determining the vortex flow characteristics under certain situations specified by the Prandtl, Rey- nolds and Rayleigh numbers. While in a high aspect ratio duct (A > 10) the vortex flow has more space to move in the spanwise direction and can be rather complex. However, the details on how the aspect ratio affects the vortex flow remain largely unexplored. The understanding of this aspect ratio effect is relatively important in improving the growth of the single crys- tal film from the chemical vapor deposition processes. In the present study combined flow visualization and temperature measurement were carried out to inves- tigate the effects of the aspect ratio on the spatial and temporal structures of the vortex flow induced in a
t Author to whom correspondence should be addressed.
mixed convection of air in a bottom heated rec- tangular duct, Attention was focused on the change of the longitudinal vortex flow structure with the aspect ratio for various Reynolds and Rayleigh numbers.
Considerable research has been carried out to explore various characteristics of the buoyancy induced longitudinal vortex rolls in the mixed con- vective flow through a bottom heated rectangular duct from the stability analysis [14], experimental measurement [5-91 and numerical simulation [l&l 31 over wide ranges of the Reynolds and Rayleigh num- bers covering the steady and time-dependent mixed convection for high and low aspect ratios. Never- theless, very few results were obtained for the duct with an intermediate aspect ratio for A = 5-7. More- over, no result was reported in the literature when A is an odd number. A detailed review of the literature on the longitudinal vortex flow was given in our pre- vious study [ 131.
Much less works were conducted for the transverse vortex flow at an extremely low Reynolds number. The existence of the transverse thermoconvective rolls was experimentally proved by Luijkx and Platten [14] in a mixed convection of silicone oil (Pr GZ 450) in a high aspect ratio rectangular duct. The critical Ray- leigh number for the onset of the transverse rolls was found to be a function of the aspect ratio, Reynolds 719
720 M. Y. CHANG and T. F. LIN A b d Gr f g Nr Ra Re T Tc, T,, t NOMENCLATURE aspect ratio, b/d channel width channel height Grashof number, g/?d3(Th- T,)/v* dimensionless frequency, fl(a/d*) frequency [Hz]
gravitational acceleration number of the longitudinal rolls Rayleigh number g/ld3(Th - T,)/va Reynolds number W,d/v
t P oscillation period [s]
W axial velocity
x, y, z dimensionless Cartesian coordinates, scaled with d.
Greek symbols
T;
thermal diffusivity
thermal expansion coefficient
V kinematic viscosity. temperature
top and bottom plate temperatures dimensional time
Subscript
m average value.
1
and Prandtl numbers. A flow regime map for nitrogen gas was proposed by Chiu et al. [15, 161 to locate the boundaries among the flow with no rolls, steady and unsteady vortex rolls. Ouazzani et al. [ 17,181 provided a relation between the wave speed, mean velocity and Rayleigh number for air flow with 1 < Re < 9 and 12,000 < Ra < 20,000. They also refined the flow regime map to include the transverse rolls. The effects of the inlet and exit boundary conditions on the characteristics of the transverse vortex flow at a slightly supercritical Rayleigh number were explored through solving the one-dimensional amplitude equa- tions and two-dimensional Navier-Stokes equations by Mtiller et al. [19].
The above literature review reveals that no syste- matic study on how the vortex flow characteristics in a bottom heated rectangular duct are influenced by the duct aspect ratio was conducted in the past. An experiment including flow visualization and tem- perature measurement was carried out in this study to unravel the relation between the vortex flow structure and aspect ratio in mixed convection of air in a bottom heated rectangular duct. In the experiment the aspect ratio was varied from 2 to 12, the Reynolds number from 2.5 to 50 and the Rayleigh number from 3000 to 20,000, covering the steady and time-dependent flow. Both the changes in the spatial and temporal struc- tures will be examined in detail.
2. EXPERIMENTAL APPARATUS AND PROCEDURES
2.1. Experimental apparatus
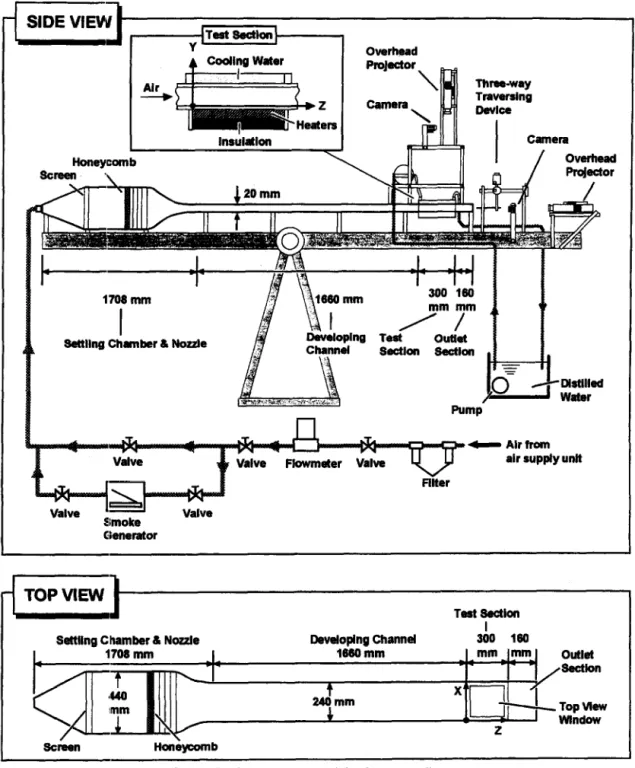
A sketch of the established test apparatus for the mixed convection of air in a bottom heated horizontal plane channel and the adopted coordinate system are shown in Fig. 1. The test section is a rectangular duct of 240 mm wide and 300 mm long with the gap width of 20 mm between the hot and cold walls. Thus the aspect ratio of the duct is 12. Adjustment of the aspect
ratio will be discussed later. The lower plate of the test section is made of a 15 mm thick, high purity copper plate and is electrically heated by d.c. power supplies. The heaters glued onto the outside surface of the bottom wall were divided into 10 segments in the flow direction and each heater was independently controlled by a GW GPC 3030D laboratory power supply. The width of the lower plate is 40 mm larger than that of the test section in order to reduce the edge effect of the test section. The upper plate of the test section is made of 3 mm thick glass plate. The plate is reinforced by a copper alloy frame to keep it flat. The upper plate is cooled by distilled water flow- ing above it. The distilled water is maintained at a constant temperature by a constant temperature cir- culator which consists of a heater, a cooler and a 90,000 gallon underground water reservoir. This cir- culator can control the temperature of the distilled water within + 0.1 “C. The volume flow rate of the distilled cooling water is adjusted carefully so that the temperature difference in the cooling water over the glass plate is within f 0.1 “C. The water head is also suitably adjusted to minimize any possible defor- mation in the glass. The side walls of the test section are made of 5 mm thick plexiglass.
The temperature of the lower plate is measured by 13 calibrated and electrically insulated T-type ther- mocouples embedded in the plate. The temperature of the upper plate is measured by six T-type thermo- couples stuck to the inside surface of the plate. The temperatures of both plates could be maintained at nearly uniform and constant values with the devi- ations ranging from kO.05 to f0.12”C. For each experiment the top plate temperature is kept at the same value as that of the inlet air flow for the purpose of eliminating the formation of a thermal boundary layer on the top wall.
The open loop mixed convection apparatus begins with the air regulated from a 600 psi and 50,000 cubic feet high pressure air tank which is passed through a
Aspect ratio effects on longitudinal vortex flow Overhead Pm@ctor \ Camera lnsulatlon I Honeycomb \ /-J-II II 1706 mm
Seltllng Chamber & Nozzle
ThW-W8Y Traversing DWlCe I Camera / overhead -Airfrom
air supply unn
GMerator
Settling Chamber & Nozzle Developing Channel
Test Section 3:g 180
Semen Honeycomb
Fig. 1. Schematic of test apparatus and the chosen coordinate system.
settling chamber, a contraction nozzle and a develop- ing channel before entering into the test section. In the settling chamber turbulence is suppressed by first passing the air through two fine mesh screens, then a honeycomb section and finally four fine mesh screens. The nozzle with a conctraction ratio of 20 : 1 has been designed to eliminate flow separation, minimize tur- bulence and provide a nearly uniform velocity at the inlet of the developing section. The developing section is 1660 mm in length, approximately 83 times the
channel height. This insures the flow being fully developed at the inlet of the test section for Re < 50. After the test section, a 160 mm outlet section is added to reduce the disturbance resulting from discharging the flow to the ambient. The settling chamber and the contraction nozzle are made of stainless steel, whereas the developing channel and the outlet section are made of 5 mm thick plexiglass. The whole test apparatus is placed in a quiescent house to eliminate any possible disturbance from the ambient outside the house. The
722 M. Y. CHANG and T. F. LIN
entire loop is insulated with the superlon insulator of 20 mm thick and is mounted on a rigid supporting frame.
The volume flow rate of air is controlled and mea- sured by a Hasting HFC flow controller with an accu- racy better than 1%. The flow measuring system is calibrated periodically by a Brooks bell prover with an accuracy of 0.2%. The operating condition of the flowmeter in actual measurement is adjusted to a con- dition similar to that of the calibration stand. The mean air speed in the test section is calculated from the total flow rate.
To measure the velocity and temperature dis- tributions in the flow, probes are inserted from the downstream end of the test section. The probes are supported by a three-way traversing device. Velocity is measured by a hot-wire probe. For calibrating the hot-wire, the pipe flow method that the probe is placed in the center of a fully-developed laminar pipe flow is used. The total flow rate is measured and the pipe center velocity is calculated from the parabolic dis- tribution. The temperature is measured by a ther-
mocouple probe which is an OMEGA (model
HYPO) mini hypodermic extremely small T-type ther- mocouple (33 gauge) implanted in a 1 in long stainless steel hypodermic needle.
2.2. Data uncertainty
The data acquisition and control system and vari- ous instruments, including a PC 486-66, multiplexers (Computer Products RTP 743 series), a digital bar- ometer (Setra Systems 361B), reference junctions (Celesco Transducer Products BRJ 14), laboratory power supplies (GW GPC 3030D), OMEGA type T thermocouples, a Hasting HFC flow controller and a data reduction software are calibrated and adjusted end to end on site by Instrument Calibration Section, Q.A. Center, Chung Shan Institute of Science and Technology (CSIST), Taiwan with the transfer stan- dards that the calibration hierarchy can trace back to the standards of the National Institute of Standard and Technology (NIST), U.S.A. Before performing the end to end calibration all the sensors and trans- ducers used were transported to CSIST for calibration or adjustment with the inter-lab standards based on the test point that will be encountered in the present test to get best calibration curve fit data. The main purpose of this calibration is to reduce any possible bias between the true physical value and the readout of the sensors and transducers. The data reduction error is reduced further by using the best nonlinear least-square calibration curve fits and by selecting a suitable gain code of the multiplexers. The system is well grounded and the electric noises are suitably fil- tered out. Fixed physical or simulated signals are then applied in the data uncertainty test. Samples higher than 32 are measured at each test point during the data uncertainty test. Uncertainties in the Rayleigh number, Reynolds number and other independent parameters were calculated according to the standard
procedures established by Kline and McClintock [20] and Abernethy and Thompson [21]. The uncertainties due to the control unsteadiness and temperature non- uniformity are also accounted for in the data uncer- tainty evaluation. In addition, the uncertainties of the thermal physical properties of the air were also included in the analysis. The fundamental ther- mophysical properties of the working fluids are c( = 0.220 (cm’ s-l), p = 0.00335 (K-l), Pr = 0.737
and v = 0.162 (cm’ s-‘) at 30°C and 0.997 bar. The fluid properties are real time corrected based on the temperature and pressure detected in the test section inlet.
The detailed uncertainty analysis indicated that the uncertainties of temperature, volume flowrate, dimen- sion, Reynolds number and Rayleigh number measurements are estimated to be +O.l5”C, + 5%,
f0.05 mm, f6% and +6%, respectively. 2.3. Adjustment of the side walls
The aspect ratio of the test section can be reduced by inserting two additional, extended side walls of 12.5 mm thick into the duct. The additional side walls extend from the exit of the settling chamber through the developing and test sections and end at the duct exit. Besides, the additional side walls have sharp lead- ing and trailing edges to minimize their disturbances to the how. Moreover, four scaled ,windows were, respectively, located at the exit of the settling chamber, inlet of the test section, outlet of the test section and exit of the loop to monitor the proper position of the side walls during the test.
2.4. Preliminary investigation ofjowjield
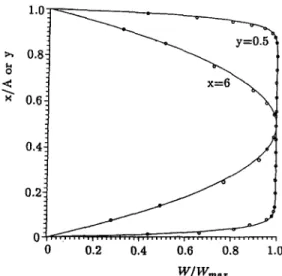
At first, the main forced flow is investigated to check its fully developed condition at the entrance of the test section with no heat input to the bottom plate. Figure 2 shows the sampled data from the hot wire measure-
ofi
0 0.2 0.4 0.6 0.8 1.0W/~VSn.,
Fig. 2. Comparison of the measured axial velocity profiles
+%ax
at the-inlet with the analytical solution from Shah and London [22] ; circles : experimental data and solid curves :Aspect ratio effects on longitudinal vortex flow 723
ment for a typical case with Re = 50 and A = 12. The results clearly indicate that at the test section inlet the velocity profile is fully developed and is in good agreement with the analytical results given by Shah and London [22]. ,$dditionally, the turbulence inten- sity is found to be less than 0.7%.
Flow visualization was conducted to observe the secondary flow patterns from the top, side and end views by injecting smoke at some distance ahead of the settling chamber. They were carried out by using a 1.5-2.5 mm plane light beam to shine through the flow field containing tiny incense particles as the light scattering centers and a sharp contrast could be achieved between the duct walls and the smoke.
In all the experiments to be reported below, we first adjust the additional side walls to the required aspect ratio. Next, we imposed a fully developed flow in the entire test section and then turned on the power supply to the bottom plate and in the mean time circulated the chilled water over the top plate. It took about 3 h for the Rayleigh nnmber Ra to raise to the test point and required about another 2 h for Ra to stabilize. After this we began various measurements and flow visualization.
3. RESULTS AND DISCUSSION
In the ranges of the parameters covered in this study the buoyancy induced vortex flow is mainly in the form of regular and deformed longitudinal rolls. Thus in the following selected results from the top and end views of the vortex flow and the time histories of the air temperature are to be presented to illustrate the spatial structures of the flow and the associated tem- poral structures in ducts of various aspect ratios for different Reynolds and Rayleigh numbers.
3.1. Spatial structme of vortex$ow
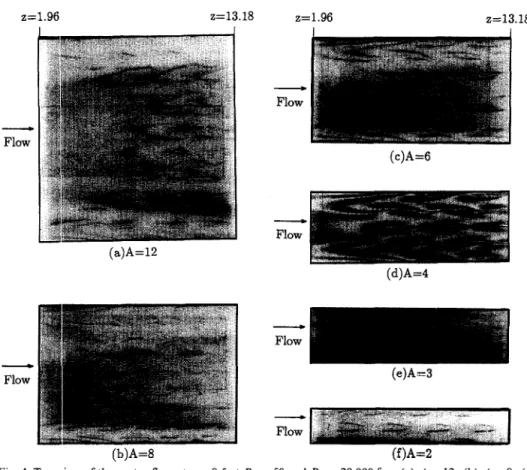
Results are first presented in Fig. 3 to demonstrate the effects of the aspect ratio on the steady longi- tudinal vortex flow at a low buoyancy-to-inertia ratio for typical cases with Re = 40 and Ra = 6000. The top view flow photos at steady-state indicate that in a duct with a large aspect ratio for A = 12 three rolls are successively induced near each side wall [Fig. 3(a)]. The onset point of the roll is closer to the duct inlet when the roll is closer to the side wall. The cross- section of each roll gradually grows with the down- stream distance. At the duct exit the roll size is approximately equal to the duct height. Outside the rolls the flow is unidirectional and is forced convection dominated. Besides, the flow is in spanwise symmetry. It is noted that at a lower aspect ratio for A = 8 the induced longitudinal rolls near the duct sides [Fig. 3(b)] resemble those: for A = 12 given in Fig. 3(a), but the spanwise extent of the forced convection domi- nated region is substantially reduced at A = 8. Detailed comparison reveals that at this low buoy- ancy-to-inertia ratio a reduction of the aspect ratio from 12 to 8 is equivalent to take the central portion
of the wide duct around the vertical central plane at x = A/2 away, so that A is reduced to 8 as far as the induced vortex flow is concerned. A similar effect is noted when A is further reduced to 6. At A = 6 the roll number is equal to the aspect ratio and the rolls in the exit region of the duct are in close contact with each other and no forced convection dominated region exists in the duct exit [Fig. 3(c)]. Note that at a still lower aspect ratio of A = 4 the induced vortex rolls [Fig. 3(d)] are equivalent to take the two rolls near the central vertical plane at x = A/2 away from the duct with A = 6. For an even smaller aspect ratio of A = 3 only two rolls are induced near the duct sides [Fig. 3(e)]. At A = 2 we also have two rolls in the duct [Fig. 3(f)]. For these cases the resulting flow is steady and spanwisely symmetric. A close inspection of these results, however, indicates that the onset points of the corresponding rolls for various A are slightly different.
Next, how the unsteady asymmetric longitudinal vortex flow for a higher Gr/R$ is affected by the aspect ratio is examined. Snapshots of the flows from the top view for typical cases at a high buoyancy-to-inertia ratio with Re = 50 and Ra = 20,000 are shown in Fig. 4 for various aspect ratios. For A = 12 the flow is in a large amplitude irregular oscillation and is asymmetric [9]. These flow photos also suggest that at a reducing aspect ratio the resulting vortex flow is approximately the same as that in a wider duct with the vortex flow in the duct core taken away. Inspecting the detailed vortex flow characteristics, however, discloses that when the aspect ratio is decreased from 12 to 8 the unsteady flow becomes less irregular and asymmetric. For A ,< 6 the induced flow evolves to a steady and symmetric state. Additionally, it is noted that at
A = 3, four vortex rolls prevail in the duct with the
two rolls in the duct core being much smaller than those near the side walls. This decrease of the roll size toward the duct core is often seen when A is an odd number.
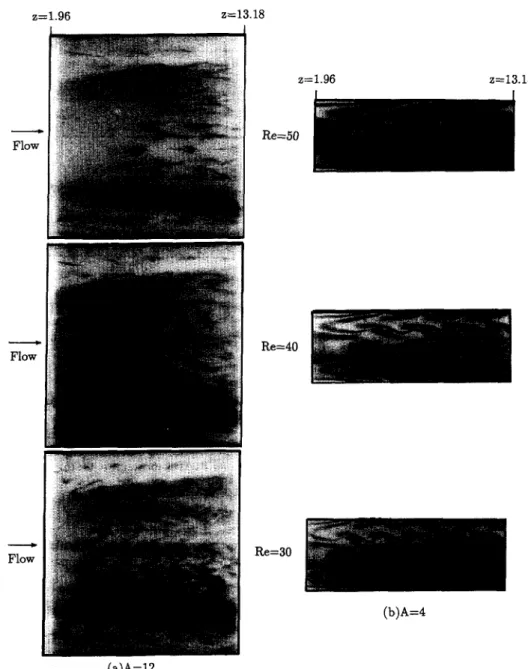
Effects of the Reynolds number on the vortex flow in ducts of different aspect ratios are then investigated. Figure 5 shows the instantaneous top view flow photos for Re = 30-50 at A = 4 and 12 for Ra = 20,000. The results manifest that in the high aspect ratio duct
(A = 12) a lowering of the Reynolds number causes
the unsteady flow to become more irregular with more frequent splitting and merging of the longitudinal rolls, in addition to the movement of the onset point to the more upstream region [9], but in the low aspect ratio duct (A = 4) the flow remains steady for the Reynolds number reduced from 50 to 40 and then to 30, although the onset of the rolls still moves upstream. Nevertheless, significant change in the cross-section of the longitudinal rolls with the Rey- nolds number is noted. At Re = 40 and 30 the roll cross-sections deviate substantially from the circular shape, which is normally observed in the steady longi- tudinal vortex flows as in Fig. 3. To further illustrate the vortex flow change with the Reynolds number in a low aspect ratio duct, Fig. 6 presents a series of the
124 M. Y. CHANG and T. F. LIN z=1.96 z=13.18 z=1.96 z=13.18 Fig. 3 - Flow (a)A=12 (d)A=4 (e)A=3 (b)A=8 (f)A=2
Top view of the vortex flow at y = 0.5 at Re = 40 and Ra = 6000 for : (a) A = 12 ; (b) A = 8 ; (c) A=6;(d)A=4;(e)A=3;and(f)A=2.
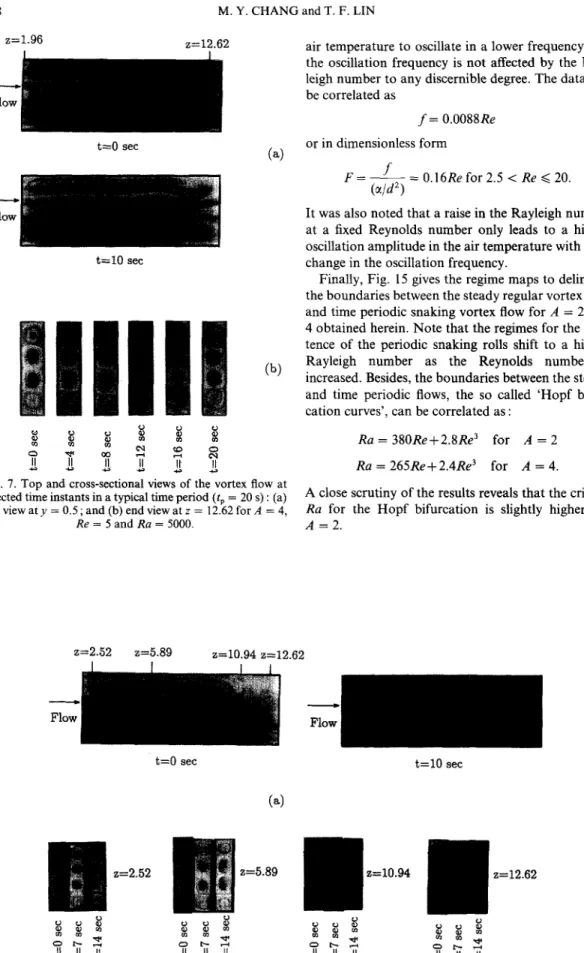
instantaneous top view flow photos for Re reduced The detailed structural change in a snaking vortex from 50 to 5 for A = 4 and Ra = 6000. The results how induced at a high buoyancy-to-inertia ratio for suggest that for 15 < Re < 50 reducing the Reynolds Re = 5 and Ra = 5000 with A = 4 is illustrated in Fig. number simply causes the four steady longitudinal 7 for a typical periodic cycle (tP = 20 s). It is noted rolls to be induced at a shorter distance from the duct from the top view photos that near the duct exit the inlet and the vortex flow to become stronger [Figs vortex rolls significantly swing with time in the span- 6(a)-(c)]. When Re is further lowered to 10, the buoy- wise direction. In this snaking flow the rolls in the ancy-to-inertia ratio (Gr/Re’) is so high that the result- duct core near the duct exit grow in the first half of ing flow [Fig. 6(d)] evolves to a time periodic state the period and decay in the other half of the period in the downstream portion of the duct. This will be with the accompanied decay and growth of the other discussed later. The two rolls in the duct core exhibit rolls near the duct sides, as evident from the end view some deformation in the roll cross-section, but the flow photos [Fig. 7(b)]. To further investigate the axial rolls near the duct sides are still in a regular shape. development of the complex vortex flow containing This interesting flow pattern is also observed for a the roll snaking, merging and splitting, Fig. 8 gives slightly lower Re of 7.5. Figures 6(e) and (f) show the snapshots of the flow from the top and end views that at Re = 7.5 there are cyclic expansion and con- at selected time instants in a periodic cycle at selected traction of the roll cross-sections with time for the cross-sections for an even higher buoyancy-to-inertia downstream portion of the two rolls in the duct core. ratio with Re = 5 and Ra = 6000 for A = 4. The It is worth mentioning that the time periodic flows results suggest that in the entry region of the duct driven at Re = 10 and 7.5 are still in spanwise the vortex flow is steady and consists of four regular symmetry. At an even lower Reynolds number of 5, longitudinal rolls of nearly equal size. Slightly down- snaking vortex rolls with significant variations in the stream the rolls become snaking with the cyclic expan- roll cross-section in the entry half of the duct are noted sion and contraction of the roll cross-sections in time. [Figs 6(g) and (h)]. Slightly downstream roll merging The roll expansion and contraction get increasingly takes place. Near the duct exit the flow becomes rather significant as the flow moves downstream. Beyond irregular and is somewhat asymmetric. Moreover, a certain axial stations the four rolls in a period are large change in the flow pattern with time appears in found to merge into two rolls at first, split into four the exit portion of the duct. rolls later, and then further split into six rolls, as
Aspect ratio effects on longitudinal vortex flow z=1.96 2=13.18 z=1.96 2=13.18 725 - Flow - Flow (a)A=E (d)A=4 - Flow (b)A=8 (e)A=3 - Flow (f)A=2
Fig. 4. Top view of the vortex flow at y = 0.5 at Re = 50 and Ra = 20,000 for: (a) A = 12 ; (b) A = 8 ; (c) A=6;(d)A=4;(e)A=3;and(f)A=2.
indicated by the results for z = 10.94 in Fig. 8(b). This roll merging and splitting processes repeat periodically in time with t, = 20 s. In the exit portion of the duct the vortex flow is mainly dominated by the two large longitudinal rolls in addition to the frequent appear- ance of a small, wmeak roll near each side wall. The flow is no longer in spanwise symmetry in this portion of the duct. Note that the space prevailed by the snaking rolls changes significantly with time.
Some interesting vortex flow patterns induced in a duct with its aspect ratio being an odd number are shown in Fig. 9 fol- A = 3 and 5. Depending on the particular set of the governing parameters inves- tigated, the vortex flow for A = 3 can be in the form of two steady symmetric longitudinal rolls with Re = 30 and Ra = 5000, four steady symmetric rolls of unequal size at Rle = 40 and Ra = 8000, or two unsteady, deformed, but spanwisely symmetric rolls in the duct core with no rolls induced near the duct sides at Re = 7.5 and Ra = 4000. While for A = 5 the duct can be filled with six steady symmetric rolls of unequal size for Re = 30 and Ra = 5000, and Re = 40 and Ra = 8000, or two unsteady symmetric rolls in the region between the duct sides and axis for Re = 5 and Ra = 3000.
It is of interest to point out that for the steady longitudinal vortex Row the maximum number of rolls
Nr induced in the duct is always even for both odd
and even aspect ratios. A simple rule for Nr deduced from the present data can be summarized as
Nr = A for even A (1)
Nr=A+lforoddAwithA>5 (2)
Nr = A - 1 for A = 3 with low Re and GrlRe2 (3)
Nr = A + 1 for A = 3 with high Re and Gr/Re’. (4) Thus, the roll size can be less than, equal to or greater than the channel height.
3.2. Temporal structure of vortexjow
In our previous experimental investigation [9] of the buoyancy driven vortex air flow in a high aspect ratio rectangular duct (A = 12) the transition from steady to time-dependent states was found to be sub- critical at increasing Rayleigh or decreasing Reynolds number. This subcritical transition is characterized by a sudden change from steady to chaotic states and no time periodic state was detected in the experiment. In a lower aspect ratio duct the present data clearly show the presence of time periodic states during the flow transition over certain ranges of Re and Ra. In the following the temporal characteristics of the flow are illustrated by showing the time variations of the instantaneous air temperature at statistical state at selected locations for various cases.
126 M. Y. CHANG and T. F. LIN z=1.96 z=13.18 Flow - Flow - Flow Re = ,50 .18 Re=30 (a)A=12
Fig. 5. Top view of the vortex flow at y = 0.5 for various Reynolds numbers at Ra = 20,000 for: (a) A = 12 (unsteady flow) ; and (b) A = 4 (steady flow).
First, the time records of the air temperature associ- ated with the cyclic expansion and contraction of the roll cross-section in the downstream portion of a low aspect ratio duct at various axial stations are given in Fig. 10 for an exemplified case with Re = 10, Ra = 7000 and A = 4 along with the corresponding spatial structures. The results indicate that in the entry half of the duct the flow is steady and the rolls do not change their sizes with time. Slightly downstream the flow starts to exhibit a small amplitude intermittent oscillation, as evident from the results for z = 9.26 in Fig. 10(b). In the exit portion of the duct the flow evolves to a time periodic state except in the narrow region near the central vertical plane at x = A/2 where
the flow is still intermittent. The period of the oscil- lation is 11.9 s. Note that the amplitude of the oscil- lation grows gradually with the downstream distance.
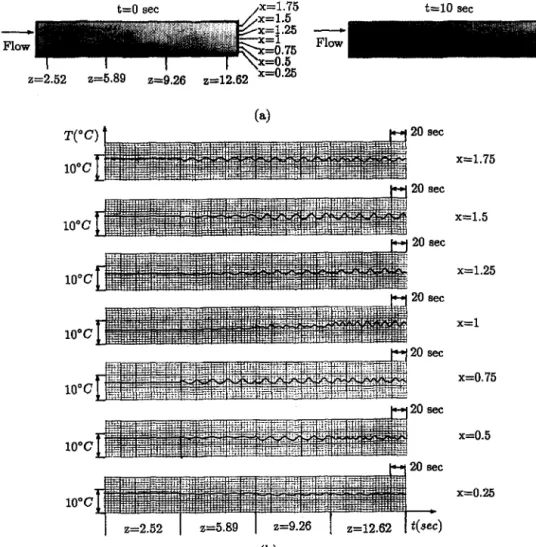
In the snaking longitudinal vortex rolls induced at a higher buoyancy-to-inertia ratio (Fig. 7), the ampli- tude of the flow oscillation shown in Fig. 11 for Re = 5 and Ra = 5000 is larger especially in the downstream region between the duct core and side walls where the roll snaking is intense. At this low Re the period of the oscillation is longer with tP = 20 s.
At an even higher buoyancy-to-inertia ratio the vor- tex flow contains significant roll snaking in the entry half of the duct, roll merging and splitting slightly downstream, and irregular asymmetric rolls near the
Aspect ratio effects on longitudinal vortex flow 721 2=1.96 ~13.18 2=1.96 z=13.18 - - Flow Flow (a)Re=50 (b)Re=JO Fl& (e)Re=7.5 at t
(g)Re=5.0 at t (h)Re=5.0 at t+lO s
Fig. 6. Effect of reducing Reynolds number on the vortex flow patterns for A = 4, Ra = 6000 and (a)
Re = 50 ; (b) Re = 30 ; (c) Re = 15 ; (d) Re = 10 ; (e)-(f) Re = 7.5 ; and (g)-(h) Re = 5.0 (t denotes a
certain time instant in a statistical state).
duct exit, as discussed above in Fig. 8. The cor- responding temporal flow characteristics given in Fig. 12 for a typical case with Re = 5, Ra = 6000 and
A = 4 suggest that .the flow is time periodic in the region dominated by the snaking rolls (tP = 20 s) in the duct entry. As the roll merging and splitting prevail, the flow shows some irregular oscillation and there is a significant axial increase in the oscillation amplitude in the duct core. The flow oscillation is relatively irregular in the asymmetric rolls near the duct exit.
The vortex flow oscillates at a much higher fre- quency when the Reynolds number is much higher, as evident from the data in Fig. 13 for Re = 20, Ra = 20,000 and A == 4. The oscillation period is 5.6 sin the middle portion of the duct. In this case the flow in the downstream half of the duct is characterized by the time oscillatory, twisted longitudinal rolls with significant roll expansion and contraction [Fig. 13(a)]. Note that in the entry half of the duct the flow is nearly steady. Downstream the flow becomes time periodic and there is a large increase in the oscillation amplitude with the downstream distance in the region close to the central vizrtical plane x = A/2 and in the
region between the duct core and side walls. In this time periodic flow the spanwise symmetry is also pre- served.
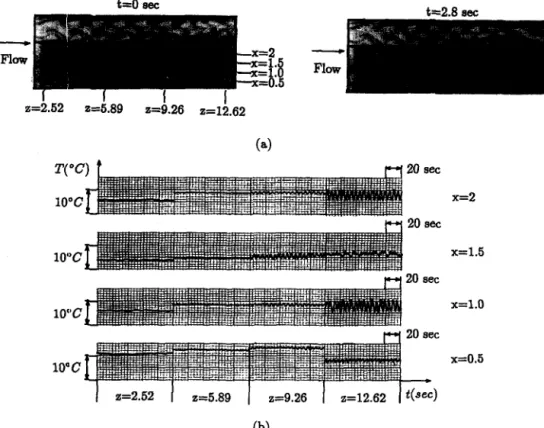
At an even lower aspect ratio (A = 2) more sig- nificant roll snaking with a larger change in the roll cross sections with the space and time is induced, as evident by comparing the results in Fig. 14(a) with those in Fig. 11 for A = 4 at the same Reynolds and Rayleigh numbers, Re = 5 and Ra = 5000. Besides, at A = 2 the snaking rolls are no longer in spanwise symmetry. Near the duct exit the flow is slightly irregu- lar with no discernible spatial structure. The data for the corresponding time histories of the air temperature in Fig. 14(b) suggest that at A = 2 the time periodic flow (tP = 20 s) is initiated at a shorter distance from the duct inlet and the oscillation amplitude is some- what larger, when contrasted with those for A = 4 in Fig. 11. Moreover, the temperature oscillation is not completely time periodic in the exit portion of the duct.
An examination of the data for the oscillation fre- quencies of the air temperature for a number of time periodic cases studied for various Re and Ra indicated that a reduction in the Reynolds number causes the
728 M. Y. CHANG and T. F. LIN z=1.96 z=12.62 - Flow t=O set t=lO set
air temperature to oscillate in a lower frequency and the oscillation frequency is not affected by the Ray- leigh number to any discernible degree. The data can be correlated as f= 0.0088Re (5) (a) or in dimensionless form
(b)
f F=-2 W2) 0.16Re for 2.5 < Re < 20. (6)It was also noted that a raise in the Rayleigh number at a fixed Reynolds number only leads to a higher oscillation amplitude in the air temperature with little change in the oscillation frequency.
Finally, Fig. 15 gives the regime maps to delineate the boundaries between the steady regular vortex flow and time periodic snaking vortex flow for A = 2 and 4 obtained herein. Note that the regimes for the exis- tence of the periodic snaking rolls shift to a higher Rayleigh number as the Reynolds number is increased. Besides, the boundaries between the steady and time periodic flows, the so called ‘Hopf bifur- cation curves’, can be correlated as :
Ra = 380Ref2.8Re’ for A = 2 Ra = 265Re+2.4Re3 for A = 4.
(7) (8) Fig. 7. Top and cross-sectional views of the vortex flow at
selected time instants in a typical time period (tp = 20 s) : (a) A close scrutiny of the results reveals that the critical top view at y = 0.5 ; and (b) end view at z = 12.62 for A = 4, Ra for the Hopf bifurcation is slightly higher for
Re = 5 and Ra = 5000. A = 2. z=2.52 z=5.89 z=10.94 z=12.62 - Flow t=O set z=2.52 z=5.89
Fig. 8. Top and cross-sectional views of the vortex flow at selected time instants in a typical time period (tp = 20 s) : (a) top view at y = 0.5 ; and (b) end view at z = 2.52, 5.89, 10.94 and 12.62 for A = 4, Re = 5
z=1.96 2=13.18
- Flow
Re=30 and Ra=5,000
F&=30 and Ra=5.000
Aspect ratio effects on longitudinal vortex flow 729
Re=40 and Ra=8,000
Re=40 and Ra=8,000
Flow
Re=7.5 and Ra=4,000
Re=5 and Ra=3,000
(4
(b)Fig. 9. Top view of the vortex flow at y = 0.5 for various cases for : (a) A = 3 ; and (b) A = 5.
4. CONCLUDING REMARKS
In the present flow visualization and temperature measurement the e:Kects of the aspect ratio on the steady and time-dependent longitudinal vortex flow in mixed convection of air in a bottom heated horizontal rectangular duct were investigated in detail. Major results obtained in this study can be summarized as follows :
(1) The main efIect of reducing the aspect ratio on the spatial strut tures of the steady and unsteady longitudinal vortex flows is equivalent to remove the central portion of th.e duct. Besides, the unstable vor- tex flow at high Re and Ra can be stabilized when the aspect ratio is reduced.
(2) Reducing the Reynolds number in a high aspect ratio duct can cause the vortex flow to change from steady to unsteady state with more frequent roll split- ting and merging. While in a low aspect ratio duct a reduction in the Reynolds number results in the distortion of the roll cross-section and can cause the vortex rolls to become snaking, accompanied with the cyclic roll expansion and contraction with time.
(3) When the value of the aspect ratio is an odd
number the number of the rolls induced in the duct is still even.
(4) At increasing buoyancy-to-inertia ratio the transition from a steady to a time-dependent state is subcritical when A is large, but in a lower aspect ratio duct there exists a finite range of the buoyancy-to- inertia ratio for the appearance of the time periodic snaking vortex flow with a spanwise symmetry. The corresponding oscillation frequency of the air tem- perature can be correlated as
f
F=---= @l0
0.16 Re. (9
It is important to emphasize that rich phenomena exist near the onset of convection which deserve spe- cial attention. Besides, the effects of aspect ratio on the transverse and mixed rolls and the effects of duct inclination are also important in various technological applications.
Acknowledgement--The financial support of this study by the engineering division of the National Science Council of Taiwan, Republic of China, through the contract NSC83- 0404-E-009-054, is greatly appreciated.
M. Y. CHANG and T. F. LIN z&.52 z=b.89 z4.26 z&62
(4
50 zec x=2 50 eec x=1.5 z=2.52 I z=5.89 I z=9.26 z=12.62 I(b)
Fig. 10. Spatial-temporal structure of vortex flow : (a) top view photos at y = 0.5 ; and (b) time records of air temperature at selected locations on lines y = 0.5 and K = 2, 1.5, 1.0 and 0.5 for A = 4, Re = 10 and
Ra = 7000 (tp = 11.9 s).
Flow
z&i.52 z=i.89 z=i26 z=1&32
50 set x=2 50 aec x=1.5 50 set x=1.0 l-7 50 set 2=2.52 1 z=5.89 I z=9.26 z=12.62
Fig. 11. Spatial-temporal structure of vortex flow : (a) top view photos at y = 0.5 ; and (b) time records of air temperature at selected locations on lines y = 0.5 and x = 2, 1.5, 1.0 and 0.5 for A = 4, Re = 5 and
Aspect ratio effects on longitudinal vortex flow 731
t=o
see - - Flow Flow z=2.52 e=5.89 z=9.26 z&.62 (a) 50 zee x=2 50 set x=1.5Fig. 12. Spaiial-temporal structure of vortex flow : (a) top view photos at y = 0.5 ; and (b) time records of air temperature at selected locations on lines y = 0.5 and x = 2, 1.5, 1.0 and 0.5 for A = 4, Re = 5 and
Ra = 6000 (tP = 20 s based on the data at x = 0.5 and z = 5.89).
I I I
z=2.52 z=5.89 z=9.26 z=12.62
I
(b)
Fig. 13. Spatial-temporal structure of vortex flow : (a) top view photos at y = 0.5 ; and (b) time records of air temperature at selected locations on lines y = 0.5 and x = 2, 1.5, 1 .O and 0.5 for A = 4, Re = 20 and
132 M. Y. CHANG and T. F. LIN t=lO set - Flow z=2.52 2=5.89 wi.26 zd2.62 ‘x=0.25 20 set x=1.75 20 8ec x=1.5 b-4 20 set 10°C x=1.25 20 set x=1 10°C W 20 set @I
Fig. 14. Spatial-temporal structure of vortex flow : (a) top view photos at y = 0.5 ; and (b) time records of air temperature at selected locations on lines y = 0.5 and x = 1.75, 1.5,1.25, 1,0.75,0.5 and 0.25 for A = 2,
Aspect ratio effects on longitudinal vortex flow 733
fm - o Steady longitudinal rolls
. Time periodic snaking longitudinal rolls - R.a = :180Re + 2.8Rea
mm Ra
ID3c-3
(a)A=2
o Steady longitudinal rolls
. Time periodic snaking longitudinal rolls - Ra = :165Re + 2.4Re3
(b)A=4
Fig. 15. Flow regime maps delineating the steady and time periodic flows for : (a) A = 2 ; and (b) A = 4.
REFERENCES
1, Mori, Y. and Uchida, Y., Forced convective heat trans- fer between horizontal flat plates. International Journal of Heat and Mass Transfer, 1966,9,803-817.
2. Nakayama, W., Hwang, G. J. and Cheng, K. C., Ther- mal instability in plane poiseuille flow. Journal of Heat Transfer, 1970, 92, 61-68.
3. Hwang, G. J. and Cheng, K. C., Convective instability in the thermal entrance region of a horizontal parallel- plate channel heated from below. Journal of Heat Trans- fer, 1973, 95,72-‘77.
Lee. F. S. and Hwang, G. J., Transient analysis on the onset of thermal instability in the thermal entrance region of a horizontal parallel plate channel. Journal of Heat Transfer, 1991, 113, 363-370.
Ostrach, S. and Kamotani, Y., Heat transfer aug- mentation in laminar fully developed channel flow by means of heating from below. Journal of Heat Transfer, 1975,97,220-225.
Kamotani, Y. and Ostrach, S., Effect of thermal insta- 7. 8. 9. 10. 11. 12. 13. 14. 15. 16 17 18 19. 20. 21. 22.
bility on thermally developing laminar channel flow. Journal of Heat Transfer, 1976,98,62-66.
Osborne, D. G. and Incropera, F. P., Experimental study of mixed convection heat transfer for transitional and turbulent flow between horizontal, parallel plates. Znter- national Journal of Heat and Mass Transfer, 1985, 28, 1337-1344.
Maughan, J. R. and Incropera, F. P., Regions of heat transfer enhancement for laminar mixed convection in a parallel plate channel. International Journal of Heat and Mass Transfer, 1990,33, 550-570.
Chang, M. Y., Yu, C. H. and Lin, T. F., Changes of longitudinal vortex roll structure in a mixed convective air flow through a horizontal plane channel : an exper- imental study. International Journal of Heat and Mass Transfer, 1997,40, 347-363.
Incropera, F. P. and Schutt, J. A., Numerical simulation of laminar mixed convection in the entrance region of horizontal rectangular duct. Numerical Heat Transfer, 1985,8,707-729.
Mahaney, H. V., Incropera, F. P. and Ramadhyni, S., Developing of laminar mixed convection flow in a hori- zontal rectangular duct with uniform bottom heating. Numerical Heat Transfer, 1987,12, 137-155.
Mahaney, H. V., Incropera, F. P. and Ramadhyni, S., Effect of wall heat flux distribution on laminar mixed convection in the entrance region of a horizontal rec- tangular duct. Numerical Heat Transfer, 1988, 13, 427- 450.
Hwang, C. C. and Lin, T. F., Buoyancy induced flow transition in mixed convective flow of air through a bottom heated horizontal rectangular duct. International Journalof Heat and Mass Transfer, 1994,37, 1235-1255. Luijkx, J. M. and Platten, J. K., On the existence of thermoconvective rolls transverse to a superimposed mean Poiseuille flow. International Journal of Heat and Mass Transfer, 1981,24, 1287-1291.
Chiu, K. C., Ouazzani, J. and Rosenberger, R., Mixed convection between horizontal plates-II. Fully developed flow. International Journal of Heat and Mass Transfer, 1987, 30, 1655-1662.
Chiu, K. C. and Rosenberger, F., Mixed convection between horizontal plates-I. Entrance effects. Inter- national Journal of Heat and Mass Transfer, 1987, 30, 1645-1654.
Ouazzani, M. T., Caltagirone, J. P., Meyer, G. and Mojtabi, A., Etude numtrique et experimentale de la convection mixte entre deux plans horizontaux a tem- peratures differences. International Journal of Heat and Mass Transfer, 1989,32,261-269.
Ouazzani, M. T., Platten, J. K. and Mojtabi, A., Etude experimentale de la convection mixte entre deux plans horizontaus a temperatures difference--II. International Journal of Heat and Mass Transfer, 1990,33,1417-1427. Miiller, H. W., Lticke, M. and Kamps, M., Transversal convection patterns in horizontal shear flow. Physics Review A, 1992,45,3714-3726.
Kline, S. J. and McClintock, F. A., Describing uncer- tainties in single-sample experiments. Mechanical Engin- eering, 1953, 75, 3-12.
Abernethy, R. B. and Thompson, J. W., Jr, Handbook- uncertainty in gas turbine measurements. Technical Report no. AEDC-TR-73-5 (AD-755356), March 1973. Shah, R. K. and London, A. L., Laminar Flow Forced Convective in Ducts. Academic Press, New York, 1987, pp. 196-198.