國 立 交 通 大 學
材 料 科 學 與 工 程 研 究 所
博 士 論 文
奈米碳管於直接甲醇燃料電池電極上之應用與
特性分析
Applications and Characterizations of carbon nanotubes as
electrodes for direct methanol fuel cells
研 究 生: 陳 建 仲
指 導 教 授: 陳 家 富 博 士
奈米碳管於直接甲醇燃料電池電極上之應用與
特性分析
Applications and Characterizations of carbon nanotubes as
electrodes for direct methanol fuel cells
研 究 生: 陳 建 仲
Student:Chien-Chung Chen
指導教授: 陳 家 富 博 士
Advisor:Dr. Chia-Fu Chen
國 立 交 通 大 學
材 料 科 學 與 工 程 研 究 所
博 士 論 文
A Thesis
Submitted to Department of material Science and Engineering
College of Engineering
National Chiao Tung University
In partial Fulfillment of the Requirements
For the Degree of Doctor of Philosophy
In Material Science and Engineering
August 2006
Hsinchu, Taiwan, Republic of China
誌 謝
細數讀博士班的這四年來,要感謝的人實在太多了,多虧有你們我才能完成我的研 究;寫這篇致謝的順序並不代表大家對我的重要性,因為對我來說,你們都很重要,沒 有你們大家的幫助,也沒有這份論文的誕生。首先要感謝的是我的指導教授-陳家富老 師,謝謝陳老師在論文研究上的指導與鼓勵,使得這篇論文能順利完成。更重要的是陳 老師對學生的照顧與愛護。再來特別感謝我的博士論文審查委員汪大永校長、施漢章老 師、薛富盛老師、陳密老師及張立老師的指導及寶貴意見,在此亦由衷的表示感謝。 接著感謝學弟劉家駿、莊方慈,學妹李依璇幫忙實驗的分析及討論。也感謝蔡佳倫 學長、林琨程學長、施士塵學長、羅宏鈞學長/弟、顏志坤同學、伍泰霖學弟、詹適宇學 弟、陳瑤真學妹、陳宜輝學弟、劉厥揚學弟、施騰凱學弟、王瑞豪學弟、洪淙琦學弟、 陳建銘學弟、徐振航學弟等在實驗上提供意見及生活上的幫助。另外也感謝國科會貴儀 中心的操作員吳美玲同學的幫忙。誠如我一開始所說的,這篇致謝的順序並不代表大家 對我的重要性,你們都很重要,非常感謝你們。 當然我也要感謝我的家人及女友,這些年來對我全力的支持,讓我能無後顧之憂的 完成我的博士學業。 最後,我也要感謝那些曾經批評過我及傷害過我的人,由於你們,讓我更充滿了鬥 智,也讓我能不斷的檢視我自已。 僅以此論文獻給所有幫助過我的人。奈米碳管於直接甲醇燃料電池電極上之應用與特性分析
研究生:陳建仲 指導教授:陳家富 博士
國立交通大學材料工程研究所
摘 要
燃料電池由於具有無污染、高效率、低噪音等優點,被視為下一個世紀最具淺力 的替代能源,其中以可微小化的直接甲醇燃料電池最受青睞。本研究主要乃是將具有 高表面積、高導電性之奈米碳管作為直接甲醇燃料電池之電極材料,藉以改善直接甲 醇燃料電池中觸媒用量過大、利用率不佳及反應速率過低等缺點。 本研究分兩個階段實驗,第一是將奈米碳管直接成長於碳布上作為直接甲醇燃料 電池電極之觸媒載體,嘗試分別以濺鍍法及濕式沉浸法(wet impregnation)來披覆鉑(Pt) 金屬觸媒,針對所製作之膜電極組(membrane electrode assembly)進行電化學分析及單 電池效能測試。實驗結果發現,以濺鍍法雖可合成較小粒徑之鉑觸媒,但礙於載體的 遮蔽效應(shield effect),鉑觸媒的質量效能(mass efficiency),濺鍍時間超過 15 分鐘以 上時有漸減的趨勢,造成燃料電池的效能提升幅度有限。然而利用濕式沉浸法雖無遮 蔽效應的影響,但由於碳管表面為化學惰性,導致觸媒的群聚現象,造成直接甲醇燃 料電池的能量密度(power density),在鉑的披覆量為 0.4 mg/cm2時,70oC的操作溫度之 下,甲醇燃料電池的能量密度只有4.6 mW/cm2。而在2.0 mg/cm2的高鉑披覆量之下, 亦只達到27.4mW/cm2。 因此,為了解決觸媒群聚的現象及有效提升電池效能,第二階段我們嘗試對奈米 碳管表面進行改質處理,首先我們利用硝酸溶液來進行奈米碳管的表面改質,結果顯 示改質後的奈米碳管有效解決了觸媒的群聚效應,且電池效能在0.4 mg/cm2鉑批覆 量,70oC的操作溫度下的能量密度可達到 15.8 mW/cm2;於30oC的室溫下,亦可有 8.6 mW/cm2的效能表現。接著我們利用微波消化 (microwave digestion) 法對奈米碳管做 快速及有效率的表面改質;我們從FTIR, Raman光譜和XPS的結果發現,藉由微波消化法進行奈米碳管的表面改質,可以在較短時間內(1 小時) 比硝酸處理 18 小時後的碳 管,能接上較多的官能基及有較高的觸媒質量效能,有效率且大幅度地縮短了奈米碳 管表面改質的時間。 除此之外,我們更嘗試比較使用硫酸、氫氧化鉀與2-硫醇乙醇作為蝕刻溶劑,針 對不同溶液的改質後所形成的官能基與觸媒間的影響進行分析及探討,實驗結果發現 以2-硫醇乙醇硫化後的奈米碳管,有較小的觸媒粒徑及其質量效能(mass efficiency)可 達到304.2 mA/mg,電池效能在 0.5 mg/cm2鉑批覆量,70oC的操作溫度下的能量密度 可達到20.6 mW/cm2,高於一般以硝酸溶液酸化後的奈米碳管。
Applications and Characterizations of carbon nanotubes as electrodes for
direct methanol fuel cells
Student:Chien-Chung Chen
Advisor : Dr. Chia-Fu Chen
Institute of Material Science and Engineering
National Chiao Tung University
Abstract
Fuel cells are regarded as the most potential power source to replace fossil oil due to their low pollution, high efficiency and low noise. Among all, direct methanol fuel cell (DMFC) which can be minified catches everyone eyes. However, high catalysts loading, low utility of catalysts and low reaction rates are advantages of DMFC. In this thesis, high surface area and high conductivity carbon nanotubes (CNTs) were used as the electrodes to improve the utility of catalysts of the direct methanol fuel cell. This research was divided into two parts. The first part includes directly synthesizes CNTs on carbon cloth as the catalyst supports and disperses metallic catalysts on CNTs by sputtering and wet impregnation. After that, we fabricate and characterize the membrane electrode assembly of a DMFC. We found that although dispersing catalysts by sputtering method can form Pt catalysts with small size (about 3nm), the mass efficiency will decrease with long sputtering time due to the shield effect of CNTs. This will result in the degradation of cell performance. On the other hand, the shield effect can be solved by wet impregnation method, but the agglomeration of catalysts occurred and strongly decreases the performance of DMFC.
The second part of this thesis focuses on the surface modification/ functionalization of CNTs for solving the agglomeration of catalysts and improving the cell performance. The surface modifications of CNTs were carried out by refluxing pristine CNTs in HNO3 for
attaching the functional groups. From the results of cyclic voltammograms (CVs) and single cell test of Pt/MWCNTs electrodes, we can found the significant improvement of cell performance of DMFC after modifying MWCNTs. The power density of Pt dispersed on HNO3 treated MWCNTs is 15.8, 12.6 and 8.6 mW/cm2 at 70oC, 50oC and 30oC with 0.4
mg/cm2 Pt loading ,respectively. This is much higher than the DMFCs with Pt/pristine-MWCNTs and sputter deposited Pt/MWCNTs based cells. Furthermore, we introduce a fast and effective method for modifying CNTs by microwave digestion method. The functionalization of CNTs for increasing more anchoring sites can be achieved in a short time by this approach. The CVs results show that the microwave digestion modified Pt/MWCNTs electrode exhibits the larger electrochemical Pt surface area and higher current density of methanol oxidation than pristine and HNO3 treated Pt/MWCNTs electrodes. This
technique can be widely used for effective modifying CNTs and shorting the process time. Finally, the effects of functionalization of CNTs with different functional groups, such H2SO4, KOH and 2-mercaptoethanol were discussed in this part. The
Pt/sulfonated-MWCNTs has the maximum methanol oxidation current density about 152.1 mA/cm2 and mass efficiency about 304mA/g. The power density of Pt dispersed on thiolated MWCNTs is 20.6 mW/cm2 at 70oC, with 0.5 mg/cm2 Pt loading, which is much higher than the Pt/HNO3 treated-MWCNTs.
Contents
ACKNOWLEDGEMENT ··· I ABSTRACT (in Chinese) ··· II ABSTRACT (in English)··· IV CONTENTS ··· VI LIST OF TABLES ··· VIII LIST OF FIGURES ··· IX
1 INTRODUCTION ··· 1
1.1 Preface ··· 1
1.2 Types of fuel cells ··· 1
1.3 Direct methanol fuel cell··· 9
1.4 Problem of DMFC ··· 11
1.5 Catalyst support for fuel cells··· 12
1.6 Motivation of this thesis··· 13
2 LITERATURE REVIEW ··· 15
2.1 History of fuel cell ··· 15
2.2 Principles and structure of DMFC··· 15
2.3 Introduction of carbon nanotube ··· 23
3 EXPERIMENTAL DETAILS ··· 28
3.1 MPCVD ··· 28
3.2 Analytical instruments ··· 29
3.2.1 Scanning Electron Microscopy (SEM) ··· 29
3.2.2 Transmission Electron Microscopy (TEM) ··· 29
3.2.4 EDX ··· 31
3.2.5 Cyclic voltammetry··· 32
3.2.6 Single cell testing ··· 33
4 DISPERSION OF PT NANOPARTICLES ON MWCNTS BY DIFFERENT ROUTES ··· 35
4.1 Dispersion of Pt nanoparticles on CNTs by sputtering ··· 35
4.2 Dispersion of Pt nanoparticles on CNTs by wet impregnation ··· 47
5 SURFACE MODIFICATIONS OF CNTS ··· 57
5.1 Surface modifications of CNTs by nitric acid-treatment ··· 57
5.2 Surface modifications of CNTs by microwave digestion method··· 69
5.3 Effect of functional groups··· 80
6 CONCLUSIONS ··· 93
List of Tables
Tab.1-1 Comparisons of various fuel cells ··· 9
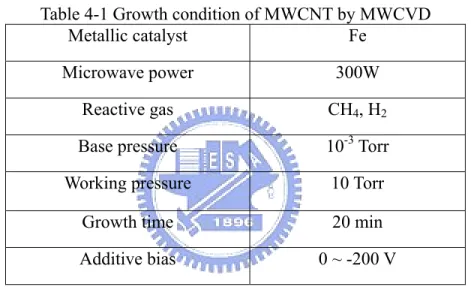
Tab.4-1 Growth condition of MWCNT by MWCVD··· 36
Tab.4-2 Experimental conditions of deposition of Pt ··· 37
Tab.4-3 Operation condition of single cell test··· 38
Tab.4-4 Electrochemical properties of sputtered Pt/CNTs··· 48
Tab.5-1 Various electrochemical properties of samples ··· 79
Tab.5-2 Experimental conditions··· 81
Tab.5-3 ID / IG ratios of MWCNTs modified by different solutions··· 82
Tab.5-4 Diffraction angle, half-width, and calculated mean particle size ··· 88
Tab.5-5 Electrochemical properties of Pt nanoparticles dispersed on MWCNTs modified by HNO3, H2SO4, KOH and C2H6SO··· 90
List of Figures
Fig.1-1 Schematic diagram of a PEMFC ··· 3
Fig.1-2 Schematic diagram of a PAFC ··· 4
Fig.1-3 Schematic diagram of an AFC··· 5
Fig.1-4 Schematic diagram of an MCFC ··· 7
Fig.1-5 Schematic diagram of a SOFC ··· 9
Fig.1-6 Schematic diagram of a DMFC··· 11
Fig.1-7 Poor utility of Pt catalysts by using carbon black as catalyst supports ··· 13
Fig.1-8 Schematic diagram of a direct methanol fuel cell and MWNT-based electrode··· 14
Fig.2-1 The structure of Nafion ··· 16
Fig.2-2 Yeager's three-phase model of Nafion; a fluorocarbon region (A), an interfacial zone (B) and an ionic cluster region (C)··· 17
Fig.2-3 Membrane and electrode assembly (MEA) ··· 19
Fig.2-4 Exploded view of a DMFC ··· 19
Fig.2-5 The bridge model of oxygen reduction on Pt ··· 20
Fig.2-6 CV of a platinum electrode in 0.5M H2SO4(aq)··· 21
Fig.2-7 Structure of a carbon nanotube··· 25
Fig.3-1 Schematic diagram of MWPECVD··· 29
Fig.3-2 Schematic diagram of a TEM··· 30
Fig.3-3 Schematic diagram of Bragg’s law··· 31
Fig.3-4 Schematic diagram of a cyclic voltammetry experiment··· 33
Fig.4-1 Schematic diagram of a rf-magnetron sputtering system··· 37
Fig.4-3 SEM images of different negative bias for synthesizing carbon nanotubes
on carbon cloth: (a) 0V, (b)-100V, (c)-150V, and (d)-200V··· 39
Fig.4-4 TEM images of carbon nanotubes growth with applied -100V ··· 40
Fig.4-5 SEM images of platinum catalysts deposited on carbon nanotubes by sputtering for (a) 5min, (b) 10 min, (c)15 min and (d) 20 min ··· 41
Fig.4-6 Histogram of Pt nanoparticle diatribution of sputter deposited Pt/MWCNTs ··· 41
Fig.4-7 Cyclic votammograms of Pt/CNTs electrode with different sputtering times in 1.0 M H2SO4 aqueous solution ··· 43
Fig.4-8 Cyclic votammograms of Pt/CNTs electrode with different sputtering times (a)5 min, (b)10 min, (c)15 min and (d)20 min in 1.0 M H2SO4 + 1.0 M CH3OH aqueous solution··· 48
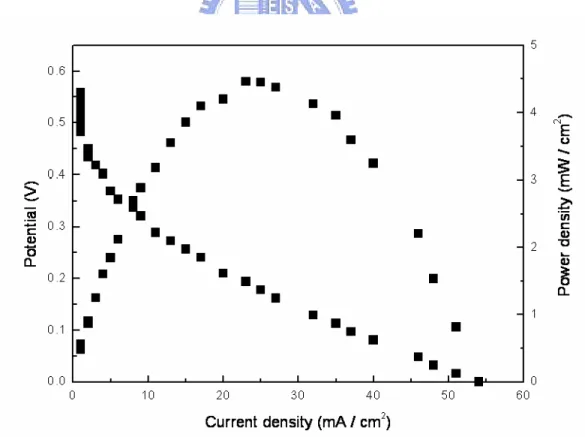
Fig.4-9 Polarization curves of the Pt/CNTs in 1cm2 single cell with CH3OH/O2 at flow rates of 50/500 sccm and 70oC··· 45
Fig.4-10 Power density curves of the Pt/CNTs in 1cm2 single cell with CH3OH/O2 at flow rates of 50/500 sccm and 70oC ··· 45
Fig.4-10 Experimental flow charts for synthesis of Pt nanoparticles ··· 49
Fig.4-11 TEM image of Pt nanoparticles synthesized by polyol process··· 50
Fig.4-12 Histogram of polyol synthesized Pt nanoparticle distribution ··· 50
Fig.4-13 SEM images of Pt nanoparticles dispersed on MWCNTs by wet impregnation ··· 52
Fig.4-14 Cyclic votammograms of Pt/CNTs electrode in 1.0 M H2SO4 aqueous solution ··· 53
Fig.4-15 Cyclic votammograms of Pt/CNTs electrode in 1.0 M H2SO4 + 1.0 M CH3OH aqueous solution ··· 53
Fig.4-16 Polarization curves of the Pt/CNTs in 1cm2 single cell with CH3OH/O2 at
flow rates of 50/500 sccm and 70oC. The Pt loading is 0.4 mg/cm2 .··· 54
Fig.4-17 TEM images of Pt nanoparticles dispersion on pristine MWCNTs. (b) is an image with high magnification··· 55
Fig.4-18 Polarization curves of the Pt/CNTs in 1cm2 single cell with CH3OH/O2 at flow rates of 50/500 sccm and 70oC. The Pt loading is 2.0 mg/cm2 .··· 56
Fig.5-1 Schematic diagram of the modification of MWCNTs ··· 58
Fig.5-2 Schematic diagram of the experimental setup ··· 58
Fig.5-3 TEM images of Pt dispersed on MWCNTs modified by (a) 2M HNO3 and (b) 14M HNO3 solutions ··· 59
Fig.5-4 Raman spectra of various nitric acid-treatment times··· 61
Fig.5-5 Relationship between ID to IG ratio and acid-treatment time ··· 61
Fig.5-6 FT-IR spectrum of MWCNTs without and with nitric acid treatment··· 62
Fig.5-7 TEM images of Pt/MWCNTs (a) without and (b) with nitric acid treatment··· 64
Fig.5-8 XRD patterns of Pt/MWCNTs without and with nitric acid treatment ··· 65
Fig.5-9 Cyclic votammograms of different Pt/CNTs electrodes in 1.0 M H2SO4 aqueous solution··· 65
Fig.5-10 Cyclic votammograms of different Pt/CNTs electrodes in 1.0 M H2SO4 + 1.0 M CH3OH aqueous solution··· 66
Fig.5-11 (a) polarization and (b) powder density curves of the Pt/CNTs in 1cm2 single cell with CH3OH/O2 at flow rates of 50/500 sccm at different temperature ··· 67
Fig.5-12 FT-IR spectrum of MWCNT with and without functionalization··· 71
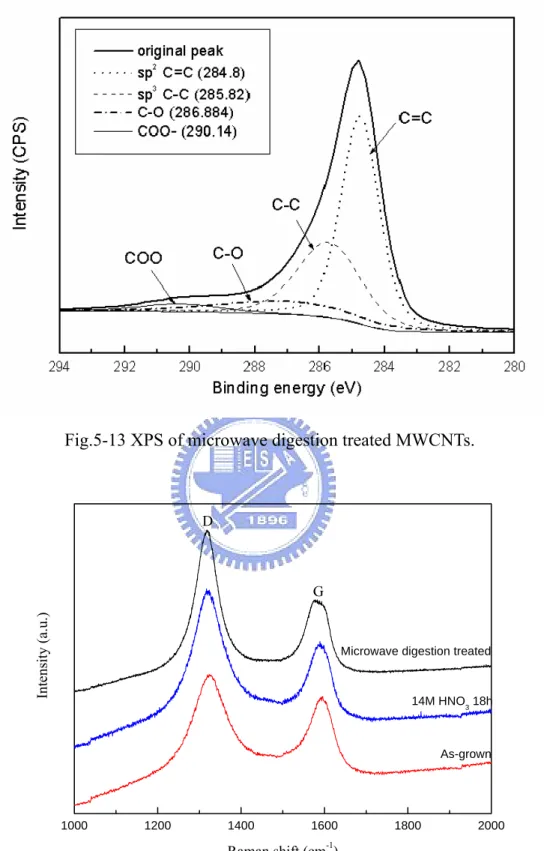
Fig.5-13 XPS of microwave digestion treated MWCNTs··· 72
Fig.5-14 Raman spectroscopy of nitric acid treated MWCNTs by different approaches ··· 72
Fig.5-15 The photographs of contact angle test (a) before and (b) after modification
in 5M HNO3 by microwave digestion method ··· 74
Fig.5-16 HRTEM images of open-end MWCNTs which were synthesized (a) by refluxing in 14M HNO3 for 18 h and (b) by microwave digestion method in 5M HNO3 solution ··· 75
Fig.5-17 TEM images of Pt nanoparticles disperse on (a) pristine MWCNTs and (b) microwave digestion treated MWCNTs··· 76
Fig.5-18 Cyclic votammograms of Pt/CNTs electrode in 1.0 M H2SO4 aqueous solution with a scan rate of 50 mVs-1··· 78
Fig.5-19 Cyclic votammograms of Pt/CNTs electrode in 1.0 M H2SO4 + 1.0 M CH3OH aqueous solution with a scan rate of 50 mVs-1··· 78
Fig.5-20 Experimental flow charts of thiolation of MWCNTs··· 82
Fig.5-21 Raman spectra of MWCNTs modified by different solutions··· 83
Fig.5-22 FTIR spectra of (a) pristine, (b) oxidized and (c) thiolated MWCNTs ··· 85
Fig.5-23 FTIR spectra of MWNTs modified with different solutions··· 85
Fig.5-24 XPS surveys of Pt/MWCNTs modified by various solutions ··· 86
Fig.5-25 The S2p spectra of XPS of MWCNTs modified in C2H6SO··· 86
Fig.5-26 The C1s spectra of XPS of MWCNTs modified in different solutions ··· 87
Fig.5-27 SEM images of Pt nanoparticles dispersed on MWCNTs modified by (a)HNO3 (b)H2SO4 (c)KOH and (d)C2H6SO··· 88
Fig.5-28 The XRD patterns for Pt/MWCNTs with different treatments ··· 89
Fig.5-29 Cyclic votammograms of different Pt/CNTs electrodes in 1.0 M H2SO4 aqueous solution··· 90
Fig.5-30 Cyclic votammograms of different Pt/CNTs electrodes in 1.0 M H2SO4 aqueous solution··· 91
Fig.5-31 Polarization curves of the Pt/ thiolated-CNTs in 1cm2 single cell with CH3OH/O2 at flow rates of 50/500 sccm and 70oC. The Pt loading is 0.5
Chapter 1
Introduction
1.1 Preface
Nowadays, to discovery a new power source with less pollution and lower price in replace of fossil oil is a noteworthy topic among resource industry. With its high efficiency and less pollution, fuel cells have become the most possible and popular power source to the next generation. Actually, Fuel cells are an aged technology. Retrospect to 1839, W. R. Grove discovered that the fuel cells and used hydrogen and oxygen as fuels. Fuel cells generate electricity from a simple electrochemical reaction in which oxygen and hydrogen combine to form water and generate electrons. The reactions are shown below:
Anode: 2H2 → 4H+ + 4e
-Cathode: O2 + 4H+ + 4e- → 2H2O
Overall: 2H2 + O2 → 2H2O
In 1960s, fuel cell was initially applied as an auxiliary power source in the Gemini space flights. Subsequently, advances in this technology were stagnant until the late 1980s when the fundamental design underwent significant reconfiguration. Even though, there are challenges and obstacles with developing fuel cells, scientists never cease devoting their energy and effort on fuel cell territory.
1.2 Types of fuel cells
Fuel cells are classified primarily by the kind of electrolyte they employ. This determines the kind of chemical reactions that take place in the cell, the kind of catalysts required, the temperature range in which the cell operates, the fuel required, and other factors. These characteristics, in turn, affect the applications for which these cells are most suitable. There are several types of fuel cells currently under development, each with its own advantages, limitations, and potential applications. A few of the most promising types include proton exchange membrane fuel cell (PEMFC), alkaline fuel cell (AFC), phosphoric acid fuel cell (PAFC), molten carbonate fuel cell (MCFC), and solid oxide fuel cell (SOFC), which are on the basis of the type of electrolyte. Details of these fuel cells are describes as follow.
1.2.1 Polymer Electrolyte Membrane Fuel Cell
fuel cells, deliver high power density and offer the advantages of low weight and volume, compared to other fuel cells. PEM fuel cells use a solid polymer as an electrolyte and porous carbon electrodes containing a platinum catalyst. They need only hydrogen, oxygen from the air, and water to operate and do not require corrosive fluids like some fuel cells. They are typically fueled with pure hydrogen supplied from storage tanks or onboard reformers. Polymer electrolyte membrane fuel cells operate at relatively low temperatures, around 80°C. Low temperature operation allows them to start quickly and results in less wear on system components, resulting in better durability. However, it requires that a noble-metal catalyst be used to separate the electrons and protons of hydrogen, resulting high cost of system. The platinum catalyst is also extremely sensitive to CO poisoning, making it necessary to employ an additional reactor to reduce CO in the fuel gas if the hydrogen is derived from an alcohol or hydrocarbon fuel. This also increases the cost. Developers are currently exploring Pt-Ru catalysts that are more resistant to CO. PEM fuel cells are used primarily for transportation applications and some stationary applications. Due to their fast startup time, low sensitivity to orientation, and favorable power-to-weight ratio, PEM fuel cells are particularly suitable for use in passenger vehicles, such as cars and buses. A significant barrier to using these fuel cells in vehicles is hydrogen storage. Most fuel cell vehicles powered by pure hydrogen must store the hydrogen onboard as a compressed gas in pressurized tanks. Due to the low energy density of hydrogen, it is difficult to store enough hydrogen onboard to allow vehicles to travel the same distance as gasoline-powered vehicles before refueling, typically 300-400 miles. Higher-density liquid fuels such as methanol, ethanol, natural gas, liquefied petroleum gas, and gasoline can be used for fuel, but the vehicles must have an onboard fuel processor to reform the methanol to hydrogen. This increases costs and maintenance requirements. The reformer also releases carbon dioxide, though less than that emitted from current gasoline-powered engines.
Fig.1-1 Schematic diagram of a PEMFC.
1.2.2 Phosphoric Acid Fuel Cell
Phosphoric acid fuel cells use liquid phosphoric acid as an electrolyte—the acid is contained in a Teflon-bonded silicon carbide matrix—and porous carbon electrodes containing a platinum catalyst. The chemical reactions that take place in the cell are shown in the diagram to the right. The phosphoric acid fuel cell (PAFC) is considered the "first generation" of modern fuel cells. It is one of the most mature cell types and the first to be used commercially, with over 200 units currently in use. This type of fuel cell is typically used for stationary power generation, but some PAFCs have been used to power large vehicles such as city buses. PAFCs are more tolerant of impurities in the reformate than PEM cells, which are easily poisoned by CO2—CO2 binds to the platinum catalyst at the anode, decreasing the fuel cell's efficiency. They are 85 percent efficient when used for the co-generation of electricity and heat, but less efficient at generating electricity alone. This is only slightly more efficient than combustion-based power plants, which typically operate at 33 to 35 percent efficiency. PAFCs are also less powerful than other fuel cells, given the
same weight and volume. As a result, these fuel cells are typically large and heavy. PAFCs are also expensive. Like PEM fuel cells, PAFCs require an expensive platinum catalyst, which raises the cost of the fuel cell.
Fig.1-2 Schematic diagram of a PAFC.
1.2.3 Alkaline Fuel Cell
Alkaline fuel cells (AFCs) were one of the first fuel cell technologies developed, and they were the first type widely used in the U.S. space program to produce electrical energy and water onboard spacecraft. These fuel cells use a solution of potassium hydroxide in water as the electrolyte and can use a variety of non-precious metals as a catalyst at the anode and cathode. High-temperature AFCs operate at temperatures between 100ºC and 250ºC. However, more-recent AFC designs operate at lower temperatures of roughly 23ºC to 70ºC. AFCs are high-performance fuel cells due to the rate at which chemical reactions take place in the cell. They are also very efficient, reaching efficiencies of 60 percent in space applications. The disadvantage of this fuel cell type is that it is easily poisoned by carbon
CO2. In fact, even the small amount of CO2 in the air can affect the cell's operation, making it
necessary to purify both the hydrogen and oxygen used in the cell. This purification process is costly. Susceptibility to poisoning also affects the cell's lifetime, further adding to cost. Cost is less of a factor for remote locations such as space or under the sea. However, to effectively compete in most mainstream commercial markets, these fuel cells will have to become more cost effective. AFC stacks have been shown to maintain sufficiently stable operation for more than 8,000 operating hours. To be economically viable in large-scale utility applications, these fuel cells need to reach operating times exceeding 40,000 hours. This is possibly the most significant obstacle in commercializing this fuel cell technology.
Fig.1-3 Schematic diagram of an AFC.
1.2.4 Molten Carbonate Fuel Cell
Molten carbonate fuel cells (MCFCs) are currently being developed for natural gas and coal-based power plants for electrical utility, industrial, and military applications. MCFCs are high-temperature fuel cells that use an electrolyte composed of a molten carbonate salt mixture suspended in a porous, chemically inert ceramic lithium aluminum oxide (LiAlO2)
matrix. Since they operate at extremely high temperatures of 650ºC and above, non-precious metals can be used as catalysts at the anode and cathode, reducing costs. Improved efficiency is another reason MCFCs offer significant cost reductions over phosphoric acid fuel cells (PAFCs). Molten carbonate fuel cells can reach efficiencies approaching 60 percent, considerably higher than the 37-42 percent efficiencies of a phosphoric acid fuel cell plant. When the waste heat is captured and used, overall fuel efficiencies can be as high as 85 percent. Unlike alkaline, phosphoric acid, and polymer electrolyte membrane fuel cells, MCFCs don't require an external reformer to convert more energy-dense fuels to hydrogen. Due to the high temperatures at which they operate, these fuels are converted to hydrogen within the fuel cell itself by a process called internal reforming, which also reduces cost. Molten carbonate fuel cells are not prone to CO or CO2 poisoning, making them more
attractive for fueling with gases made from coal. Although they are more resistant to impurities than other fuel cell types, scientists are looking for ways to make MCFCs resistant enough to impurities from coal, such as sulfur and particulates. The primary disadvantage of current MCFC technology is durability. The high temperatures at which these cells operate and the corrosive electrolyte used accelerate component breakdown and corrosion, decreasing cell life. Scientists are currently exploring corrosion-resistant materials for components as well as fuel cell designs that increase cell life without decreasing performance.
Fig.1-4 Schematic diagram of an MCFC.
1.2.5 Solid Oxide Fuel Cell
Solid oxide fuel cells (SOFCs) use a hard, non-porous ceramic compound as the electrolyte. Since the electrolyte is a solid, the cells do not have to be constructed in the plate-like configuration typical of other fuel cell types. SOFCs are expected to be around 50-60 percent efficient at converting fuel to electricity. In applications designed to capture and utilize the system's waste heat, overall fuel use efficiencies could top 80-85 percent. Solid oxide fuel cells operate at very high temperatures. High temperature operation removes the need for precious-metal catalyst, thereby reducing cost. It also allows SOFCs to reform fuels internally, which enables the use of a variety of fuels and reduces the cost associated with adding a reformer to the system. SOFCs are also the most sulfur-resistant fuel cell type; they can tolerate several orders of magnitude more sulfur than other cell types. In addition, they are not poisoned by CO, which can even be used as fuel. This allows SOFCs to use gases made from coal. High-temperature operation has disadvantages. It results in a slow startup and requires significant thermal shielding to retain heat and protect personnel, which may be acceptable for utility applications but not for transportation and small portable
applications. The high operating temperatures also place stringent durability requirements on materials. The development of low-cost materials with high durability at cell operating temperatures is the key technical challenge facing this technology. Scientists are currently exploring the potential for developing lower-temperature SOFCs operating at or below 800ºC that have fewer durability problems and cost less. Lower-temperature SOFCs produce less electrical power, however, and stack materials that will function in this lower temperature range have not been identified.
The differences and features of these fuel cells are summarized in Tab.1-1.
Tab.1-1 Comparisons of various fuel cells
MCFC PAFC PEMFC SOFC
Electrolyte Molten carbonate salt Liquid phosphoric acid Ion exchange membrane Solid metal oxide Operating tempt. 600~1000oC 150~200oC 60~100oC 600~1000oC
Reforming External/Internal External External External/Internal Oxidant CO2/O2/Air O2/Air O2/Air O2/Air
Efficiency 45~60% 35~50% 35~50% 45~60%
Max. Efficiency 85% 80% 60% 85%
Max. power output
2MW 1MW 250kW 220kW
Waste heat uses High pressure stream Space heating or water heating Space heating or water heating Heating water or stream
1.3 Direct methanol fuel cell
Direct methanol fuel cell (DMFC) is a kind of PEMFCs; we separate it from PEMFC and discuss in detail. Most fuel cells are powered by hydrogen, which can be fed to the fuel cell system directly or can be generated within the fuel cell system by reforming hydrogen-rich fuels such as methanol, ethanol, and hydrocarbon fuels. Direct methanol fuel cell, however, is powered by pure methanol, which is mixed with steam and fed directly to the fuel cell anode. Direct methanol fuel cells do not have many of the fuel storage problems typical of some fuel cells since methanol has a higher energy density than hydrogen. Methanol is also easier to transport and supply to the public using our current infrastructure since it is a liquid, like gasoline. Fig.1-5 shows the schematic diagram of a DMFC. The anode, the negative post of the fuel cell, has several jobs. It conducts the electrons that are freed from the hydrogen molecules so that they can be used in an external circuit. It has channels etched into it that disperse the hydrogen gas equally over the surface of the catalyst. The cathode, the positive post of the fuel cell, has channels etched into it that distribute the oxygen to the surface of the catalyst. It also conducts the electrons back from the external
circuit to the catalyst, where they can recombine with the hydrogen ions and oxygen to form water. The electrolyte is the proton exchange membrane. This specially treated material only conducts positively charged ions and blocks electrons. The catalyst is a special material that facilitates the reaction of oxygen and hydrogen. It is usually made of platinum powder very thinly coated onto carbon paper or cloth. The catalyst is rough and porous so that the maximum surface area of the platinum can be exposed to the hydrogen or oxygen. The platinum-coated side of the catalyst faces the proton exchange membrane.
Because methanol is fed directly into the fuel cell, complicated catalytic reforming is unneeded, and storage of methanol is much easier than that of hydrogen because it does not need to be done at high pressures, as methanol is a liquid. The energy density of methanol is orders of magnitude greater than even highly compressed hydrogen. However, efficiency is low, due to the high permeation of methanol through the membrane, and the dynamic behavior is sluggish. Methanol is also poisonous. As a result of these strengths and problems, DMFCs are limited in the power they can produce, but can still store much energy in a small space. This means they can produce a small amount of power over a long period of time which makes them well suited to power consumer electronics such as cell phones and laptops but rules them out of automotive applications. The DMFC relies upon the oxidation of methanol on a catalyst layer to form carbon dioxide. Water is consumed at the anode and is produced at the cathode. Protons (H+) are transported across the proton exchange membrane to the cathode where they react with dioxygen to produce water. Electrons are transported via an external circuit from anode to cathode providing power to external devices.
The half reactions are:
Anode: CH3OH + H2O → CO2 + 6H+ + 6e-
Cathode: 1.5O2 + 6H+ + 6e- → 3H2O
Net reaction: CH3OH + 1.5O2 → CO2 + 2H2O
Because water is consumed at the anode in the reaction, pure methanol cannot be used without provision of water via either passive transport such as back diffusion, or active transport such as pumping. The need for water limits the energy density of the fuel.
Fig.1-6 Schematic diagram of a DMFC.
1.4 Problems of DMFC
The problems of DMFC restrict the commercialization of DMFC at present, which include:
1. Low temperature- poor kinetics at anode and cathode 2. Needs Ru co-catalyst- Pt poisons otherwise
3. Methanol cross-over through membrane to cathode
One of the most important limitations of direct methanol fuel cell is low catalytic activity of the electrodes, especially the anodes and at present, there is no practical alternative to Pt based catalysts. High noble metal loadings on the electrode [2, 3] and the use of perfluorosulfonic acid membranes significantly contribute to the cost of the devices. An efficient way to decrease the loadings of precious platinum metal catalysts and higher utilization of Pt particles is by better dispersion of the desired metal on the suitable support [4]. In general, small particle size and high dispersion of platinum on the support will result in high electrocatalytic activity. Carbon materials possess suitable properties for the design of electrodes in electrochemical devices. Carbon is an ideal material for supporting nano-sized
metallic particles in the electrode for fuel cell applications. No other material except carbon material has the essential properties of electronic conductivity, corrosion resistance, surface properties, and the low cost required for the commercialization of fuel cells. In general, the conventional supports namely carbon black is used for the dispersion of Pt particles
1.5 Catalyst support for fuel cells
For improving the utility of catalysts, the material with high surface area, high electron conductivity is required as the catalyst support. However, the high chemical resistance to acid or alkaline media and the possibility to control, up to certain limits, the porosity and the surface chemistry made carbon based materials a preferred choice for catalyst supports. Carbon possesses unique electrical and structural properties that make it a suitable material for use in fuel cells. Various forms of carbon, such as graphite, carbon black and other composite materials have been chosen for catalyst supports. Among them, carbon nanotubes represent a distinctive class of catalyst supports, exhibiting a high surface area and many available adsorption sites. Typically, the total surface area of as-grown single-walled carbon nanotubes ranges between 400 and 900 m2/g, whereas for as-produced multi-walled carbon nanotubes values are ranging between 200 and 400 m2/g. In a single-walled carbon nanotube, bundle adsorption sites are represented either by the interior of a nanotube, the interstitial channels between tubes, the outer surface of the bundle or the grooves formed at the contact between adjacent tubes. For multi-walled carbon nanotubes, adsorption can occur in the aggregated pores, inside the tube or on the external walls. Besides these catalyst-related structural properties, carbon nanotubes are more stable to oxidation, feature an increased wear-resistance and possess a good thermal stability. Their metallic character promotes them as good support candidates for metal particles, but chemically functionalized nanotubes can support other catalysts as well, such as bimetallic nanoparticles and organo-metallic complexes. There are three other advantages presented by carbon nanotubes as catalyst supports. First, the high purity of the material prevents self-poisoning, a common problem of conventional catalysts, which gradually wear out. Secondly, the mere nature of these supports can be of interest for liquid-phase reactions, thus limiting the mass transfer. Finally, the catalytic activity and its selectivity can directly benefit from the existence of specific metal–support interactions. As an overall result of all of the above features, the catalytic studies conducted on carbon nanotube-based systems have confirmed an increased loading
and a good dispersion of the catalyst particles with respect to values available on other supports, which naturally translates into better performance of the catalysts. For instance, platinum support for proton exchange membrane fuel cells, carbon nanotubes with 12 wt% platinum deposition give 10% higher voltage than carbon black with 29 wt% platinum deposition. When used as a catalyst support, carbon nanotubes lead to atypical activity and selectivity in several catalytic reactions such as hydrogenation of olefins and nitrobenzene into aniline, or selective hydrogenation of the double carbon bond in an unsaturated aldehyde. Also of interest are hydroformylation of olefins to aldehydes, and partial dehydrogenation reactions. Another range of applications targets catalysts for redox reactions and catalytic decompositions.
1.6 Motivation of this thesis
Carbon black (Vulcan XC-72R) which has high surface area (about 240 m2g-1) is commonly used as the catalyst supports for increase the uniformity of platinum catalysts. However, the platinum particles are covered by carbon blacks easily result in the low oxidation reduction rate of methanol [5] (see Fig.1-7).
In this thesis, we would like to combine the novel and amazing materials --- carbon nanotubes with the direct methanol fuel cell technologies to overcome the drawbacks of catalyst layers in a DMFC. The schematic diagram of DMFC with carbon nanotubes based electrodes was shown in Fig 1-8. Therefore, the motivations of this thesis are:
1. We want to enhance the utility of catalysts by introducing CNTs to replace the carbon black as the catalyst supports.
2. We want to simplify the fabricating processes of MEA by directly synthesizing CNTs on GDL.
3. We want to find out the better way to disperse catalysts on CNTs for improving the performance of a DMFC.
4. We want to realize the influence of surface modifications of CNTs for further applications.
Chapter 2
Literature review
2.1 History of fuel cell
The fuel cell can trace back to the 1800's discovered by Sir William Robert Grove, a Welsh born, Oxford educated barrister. Grove realized that if electrolysis, using electricity, could split water into hydrogen and oxygen then the opposite would also be true. Combining hydrogen and oxygen, with the correct method, would produce electricity. The overall reaction is:
H2O → 2H2 + O2 E0 = 1.23V
For improving his hypothesis, Sir William Robert Grove built a device that would combine hydrogen and oxygen to produce electricity, the world's first fuel cell. His invention was a success, and Grove's work advanced the understanding of the idea of conservation of energy and reversibility. In 1899, a fuel cell with power density of 104 km h-1 was held by an electric vehicle, the “Jamais Contente”. In 1900 in the USA, there were 1681 steam-driven vehicles, 1575 electric vehicles and only 936 driven by petrol engines. All electric vehicles were powered by lead-acid batteries. A fuel tank is lighter than a lead-acid battery and can be recharged more rapidly. A tank of fuel gives a much longer range than a fully charged battery- current target of 300 km still remains elusive. The advent of the self-starter, which powered by a lead-acid battery finally, clinched the relegation of electric vehicles to milk floats and fork-lift trucks. In the late 19th and early 20th centuries, coal was the major power source. But all attempts to make coal fuel cells failed, and fuel cells fell out of favour until the 1960’s, due to interest from an out of this world source.
2.2 Principle and structure of DMFC
2.2.1 The Proton Exchange Membrane (PEM)Direct methanol fuel cell is a kind of Proton Exchange Membrane fuel cells. As the name implies, a PEMFC employs a proton exchange membrane (PEM). The PEM serves as a physical barrier between the anode and cathode gases and also as the electrolyte (hence it is also known as a solid polymer electrolyte). Today, the most common PEM is Nafion, a perfluorosulfonic acid membrane developed by E.I. DuPont de Nemours & Co. The structure of Nafion is shown in Fig.2-1. The values of x and y can be varied to create materials with
different equivalent weights and the most common equivalent weight is 1100. Although Nafion is similar in structure to polytetrafluoroethylene (PTFE or Teflon), it has excellent mechanical strength, water insolubility, and chemical and thermal stability. The sulfonated side chains endow Nafion with high proton conductivity and cation exchange capacity. Nafion has found numerous applications, such as liquid and gas separations, fuel cells, and the chloro-alkali industry.
Fig.2-1 The structure of Nafion.
Structurally, Nafion is a fascinating polymeric material. The exact structure of Nafion is not known but there have been several models proposed to describe the way in which ionic groups aggregate within Nafion membranes. These models include the
Mauritz-Hopfinger Model [6], the Yeager Three-Phase Model [7], the Eisenberg-Hird-More Model of Hydrocarbon Ionomers [8], and the Gierke Cluster Network Model [9]. Each of these models attempts to predict the fundamental features of equilibrium ionic selectivities and ionic transport. Electrostatic interactions cause the ionic groups to aggregate and form tightly packed regions referred to as clusters [10]. These electrostatic interactions enhance the intermolecular forces and considerably influence the properties of the parent polymer. Small angle X-ray scattering (SAXS) and neutron scattering experiments clearly indicate that ionic clustering is present in Nafion [11]. Although no one model has been found to provide a complete explanation of the properties and selectivities found, several models base these properties and selectivities on an extensive micro-phase separated morphology [12, 13]. Yeager’s model describes Nafion as consisting of three regions: a fluorocarbon region (A), an interfacial zone (B) and an ionic cluster region (C). These regions are depicted in Fig.2-2.
Region A consists of the fluorocarbon backbone and is quite hydrophobic. Region C consists of clusters of pendant sulfonate groups. This region is quite hydrophilic, most absorbed water and counterions exist in this region. Gierke has proposed that these ionic clusters are spherical and exist as a network interconnected by smaller channels [14]. Region B is an interfacial region containing the pendant side chain material and sulfonate groups that are not clustered. Hence, only part of the absorbed water and counterions exist in this region.
Fig.2-2 Yeager's three-phase model of Nafion; a fluorocarbon region (A), an interfacial zone (B) and an ionic cluster region (C).
The proton conductivity of Nafion is dependant on its hydration state. In the dry state, Nafion is a poor ion conductor, but ionic conductivity increases sharply with water content [15]. Because of this, reactant gases are often humidified before they enter a PEMFC. However, this can induce water management issues at the cathode. This also limits the operational temperature of Nafion based PEMFCs to under around 100oC since sufficient
liquid water must be present for good conductivity. However, if too much water is present, electrode pores and flow fields are filled by water, leading to mass transport issues. This is often referred to as flooding. Therefore, water management is often a delicate balance that is critical to good performance. Companies such as Dow, Aciplex, Gore and Ballard have developed other membranes. The scientific community has studied these membranes in less detail since they are proprietary to the companies that developed them. Generally, they have similar sulfonated perfluorocarbon structures.
2.2.2 DMFC Electrodes
DMFC electrodes are complex three-dimensional structures consisting of a number of different materials in a heterogeneous mix. Much skill and art have been developed to produce structures with improved performances. Usually a 10-50 m thick layer, consisting of carbon-supported Pt catalyst bonded with recast Nafion and/or PTFE is applied onto a gas diffusion backing. The backing is typically carbon fiber paper or carbon cloth that serves as a current collector and gas conduit. The backing is often treated to aid water management within the cell. The recast Nafion in the catalyst layer originates from a Nafion solution that can be mixed with the catalyst before electrode preparation or added once the catalyst layer has been formed. Its primary purpose is to provide a medium for proton conduction within the catalyst layer, because only those Pt sites that are in ionic contact with the membrane can be active for oxidation or reduction of the fuel or oxidant. The purpose of PTFE is to bind together the electrode particles and to aid in water management. The catalyst, Nafion and PTFE are typically mixed together with water and alcohol(s) to form an ink. This ink is then spray-applied, brush-applied or even screen printed onto the backing [16]. Several proprietary methods have been reported where the catalyst mixture is applied directly onto the membrane [17, 18]. Typically, electrodes are hot-bonded to each side of the membrane to form the membrane and electrode assembly (MEA). An MEA is shown in Fig.2-3. The thin size and low mass of the MEA is the main advantage of a DMFC. This allows for the formation of compact lightweight stacks. A fuel cell stack consists of several MEAs electrically connected in series by bipolar plates. The bipolar plate serves as an electrical connection between the MEAs and also physically separates the reactant gases. A schematic diagram of a single cell DMFC is shown in Fig. 2-4. Bipolar plates have flow fields machined onto each side to distribute the reactant gases throughout the entire area of the
electrode. The most common flow field shapes are serpentine and interdigitated.
Fig.2-3 Membrane and electrode assembly (MEA).
Fig.2-4 Exploded view of a DMFC.
2.2.1 DMFC Anodes
DMFC anodes typically consist of a Pt catalyst, either Pt black or Pt on a carbon support. These anodes perform very well when pure hydrogen is used, but storage and infrastructure issues make hydrogen an inconvenient fuel to supply. To circumvent these issues, hydrogen can be replaced by methanol. However, DMFC has a major drawback, that is, CO poison.
CO poisons a Pt catalyst by adsorbing strongly onto its surface, blocking active sites for hydrogen electro-oxidation, resulting in losses of electrical current. There is an unacceptable performance loss when as little as 10 ppm of CO is present in the fuel mixture. Obviously, a CO tolerant catalyst is desired. Pt is easily poisoned but bi-metallic Pt/X co-catalysts (X = Ru, Mo, Sn) have been shown to be more tolerant to CO. The second metal is deposited with Pt and will either reduce poisoning or decrease the potential at which CO is removed. Ru has been shown to be the most effective.However, adding Ru further increases the cost of the anode. Operating at higher temperatures can also decrease the effect of CO poisoning.
2.2.2 DMFC Cathodes
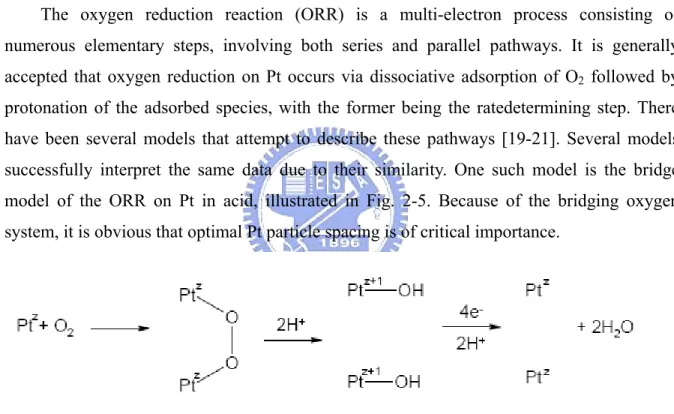
The oxygen reduction reaction (ORR) is a multi-electron process consisting of numerous elementary steps, involving both series and parallel pathways. It is generally accepted that oxygen reduction on Pt occurs via dissociative adsorption of O2 followed by
protonation of the adsorbed species, with the former being the ratedetermining step. There have been several models that attempt to describe these pathways [19-21]. Several models successfully interpret the same data due to their similarity. One such model is the bridge model of the ORR on Pt in acid, illustrated in Fig. 2-5. Because of the bridging oxygen system, it is obvious that optimal Pt particle spacing is of critical importance.
Fig. 2-5 The bridge model of oxygen reduction on Pt (z represents the oxidation state).
The complicated pathway of the ORR results in slow electrochemical kinetics.
One measure of the rate of an electrochemical reaction is its exchange current density, jo. jo
for the ORR on Pt is 105 less than jo for hydrogen oxidation at Pt. It is because of this huge
difference that the activity at the cathode most influences hydrogen/air cell fuel cell performance. Therefore, enhancing the cathode activity has been a major focus for PEMFC electrode development. In order to increase cathode activity, one must increase catalyst utilization. This will not only increase performance but can also lead to a lowering of the
required Pt loading. In order for a catalyst site to be electrochemically active, a pathway for electron, proton and gas transport must all be present. The active area of Pt is typically measured using cyclic voltammetry (CV) in acid electrolyte. Specifically, the area under the hydrogen adsorption/desorption peaks is determined as shown in Fig.2-6. Regions of oxide formation (QA) and reduction (QC) as well as formation of hydrogen (HA) and its reduction
(HC) are indicated. A larger area per mass of Pt indicates a larger active area. One very
successful method to increase catalyst utilization is to employ a carbon supported Pt catalyst. Typically, Pt particles (3-10 nm) are dispersed onto the electronically conducting carbon particles, about 30-50 nm. The ideal carbon support should possess high chemical stability, good electronic conductivity, high surface area and suitably pore size distribution. The type of carbon that appears to be best suited to be a fuel cell catalyst support is carbon black. There are several types of commercial carbon blacks that are have been studied for use with fuel cells, Vulcan XC72 is the most common. Although carbon is an excellent electronic conductor, it is a very poor proton conductor. This is mainly because carbon is hydrophobic. However, the carbon surface does consist of some hydrophilic moieties. Carbon-oxygen complexes, such as phenol, carbonyl, carboxyl, quinone and lactone groups can all be found on the carbon surface. Typically, exposing the carbon to an oxidizing agent forms these complexes.
One serious issue with Pt/carbon catalysts is the sintering of the Pt particles [22]. Sintering occurs when Pt particles become larger over their lifetime. This decreases the Pt surface area, and ultimately leads to a decline in performance throughout the lifetime of operation. Ideally, a catalyst support material that is both electronically and ionically conductive is desired. Pickup et al. have studied such a material, a conducting polymer composite [23]. The composite consists of polyprrole and polystyrenesulfonate, which are electronically conductive and proton conductor, respectively. This material was tested as a replacement for carbon and reasonable performance was achieved. However, low Pt utilization and polymer stability are still issues [24]. Another method to increase catalyst utilization is to add a proton-conducting polymer (such as Nafion) into the catalyst layer. Pt catalyst near or directly in contact with the Nafion membrane is utilized most efficiently. However, utilization drops off deeper into the catalyst layer, largely due to the limited proton conductivity of the catalyst layer. Nafion solution can be applied onto preformed electrodes or directly mixed with the catalyst during ink preparation. This increases the proton conductivity of the catalyst layer. In 1986, Raistrick was able to demonstrate that carbon-supported Pt catalyst mixed with Nafion could outperform conventional Pt black electrodes that had ten times the Pt loading [25]. This was a major breakthrough in fuel cell development in that it made the cost of Pt required much more feasible. When designing an electrode using carbon-supported catalyst and Nafion, they must be mixed in proper proportions to form a stable three-phase boundary where the gas, ion conductor and catalytically active electronically conducting phase are all present. This requirement limits the amount of Nafion that can be added since the morphology, low gas permeability, and poor electronic conductivity of Nafion disrupts this boundary and adversely affects cell performance. Because of this, and the high cost of Nafion, alternative methods for providing proton conductivity in the catalyst layer are of interest. Another approach to increase Pt utilization is to simply deposit Pt only in the areas of the electrode where it would be electroactive. This can be done by sputter deposition where layers as thin as 2 nm can be deposited. There have been many studies that use sputter deposition to localize Pt catalyst at the front surface of the electrode or even directly onto the membrane surface. Srinivsan et al. applied a 50 nm thick layer of Pt onto an uncatalyzed gas diffusion layer (GDL) by sputter deposition and achieved a 10-fold reduction in Pt loading (from 4 mg/cm2 to 0.4 mg/cm2)
without a loss in performance [26]. Hirano et al. later showed that electrodes prepared by sputter deposition with a Pt loading of 0.1 mg/cm2 could perform the same as those prepared using standard materials (Pt/C) at a 0.4 mg/cm2 Pt loading [27]. Cha and Lee have further reduced the Pt loading to 0.04 mg/cm2 by alternating sputter deposited Pt layers and painted Nafion/Carbon ink layers, with successively lower amounts of Pt in each layer [28]. This leads to very efficient utilization of Pt. sputter deposition is promising for fuel cells since a larger percentage of Pt is electrochemically active. Also, it allows for the fabrication of very thin active layers, which decrease ohmic and mass transport overpotentials in the catalysts layer. Also, sputter deposition is a well established industrial technique in areas such as thin films and integrated circuits and it is anticipated that this technique could be readily applied to micro-fuel cell applications.
2.3 Introduction of carbon nanotubes
Carbon nanotubes, long, thin cylinders of carbon, were discovered in 1991 by S. Iijima [29]. These are large macromolecules that are unique for their size, shape, and remarkable physical properties. They can be thought of as a sheet of graphite rolled into a cylinder. These intriguing structures have sparked much excitement in the recent years and a large amount of research has been dedicated to their understanding. Currently, the physical properties are still being discovered and disputed. What makes it so difficult is that nanotubes have a very broad range of electonic, thermal, and structural properties that change depending on the different kinds of nanotube. To make things more interesting, besides having a single cylindrical wall (SWNTs), nanotubes can have multiple walls (MWNTs)--cylinders inside the other cylinders. Much research has been devoted to the study of the equilibrium structure of carbon nanotubes. Currently, some information is still begin disputed, but I have compiled recent data on the most basic and neccessary aspects of single-walled carbon nanotubes (SWNT).
2.3.1 Basic structure of carbon nanotubes
Carbon nanotubes exist as a macro-molecule of carbon, analagous to a sheet of graphite rolled into a cylinder. Graphite is a tessellation of hexagonal rings of carbon. When graphite coiled, the carbon arrangement becomes very strong. Carbon nanotubes have been known to be up to one hundred times as strong as steel and almost two millimeters long. [30] These nanotubes have a hemispherical cap at each end of the cylinder. They are light, flexible, thermally stabile, and are chemically inert. They have the ability to be either metallic or
semi-conducting depending on the twist of the nanotube. Carbon nanotubes are classified as single-walled and multi-walled carbon nanotubes according to the numbers of graphite layers. The formation of CNTs over one graphite layer we called it multi-walled carbon nanotube.
2.3.2 Types of SWCNTs
SWCNTs form different types, which can be described by the chiral vector (n, m), where n and m are integers of the vector equation R = na1 + ma2. The chiral vector is
determined by the diagram at the left. Imagine that the nanotube is unraveled into a planar sheet. Draw two lines along the tube axis where the separation takes place. In other words, if you cut along the two blue lines and then match their ends together in a cylinder, you get the nanotube that you started with. Now, find any point on one of the blue lines that intersects one of the carbon atoms (point A). Next, draw the armchair line, which travels across each hexagon, separating them into two equal halves. Now that you have the armchair line drawn, find a point along the other tube axis that intersects a carbon atom nearest to the Armchair line (point B). Now connect A and B with our chiral vector, R. The wrapping angle is formed between R and the Armchair line. If R lies along the Armchair line (θ=0°), then it is called an "Armchair" nanotube. If θ=30°, then the tube is of the zigzag type. Otherwise, if 0°<θ<30° then it is a "chiral" tube. The vector a1 lies along the zigzag line. The other vector a2 has a different magnitude than a1, but its direction is a reflection of a1 over the Armchair line. When added together, they equal the chiral vector R. [31] The values of n and m determine the chirality, or twist of the nanotube. The chirality in turn affects the conductance of the nanotube, it's density, it's lattice structure, and other properties. A SWNT is considered metallic if the value n - m is divisible by three. Otherwise, the nanotube is semiconducting. Consequently, when tubes are formed with random values of n and m, we would expect that two-thirds of nanotubes would be semi-conducting, while the other third would be metallic, which happens to be the case [32]. Given the chiral vector (n,m), the diameter of a carbon nanotube can be determined using the relationship
Fig.2-7 Structure of a carbon nanotube
2.3.3 Detailed Structure
The average diameter of a SWNT is 1.2 nm [32]. However, nanotubes can vary in size, and they aren't always perfectly cylindrical. The larger nanotubes, such as a (20, 20) tube, tend to bend under their own weight [33]. The diagram at right shows the average bond length and carbon separation values for the hexagonal lattice. The carbon bond length of 1.42 Å was measured by Spires and Brown in 1996 [32] and later confirmed by Wilder et al. in 1998 [31]. The C-C tight bonding overlap energy is in the order of 2.5 eV. Wilder et al. estimated it to be between 2.6 eV - 2.8 eV while at the same time, Odom et al. estimated it to be 2.45 eV [34]. A (10, 10) Armchair tube was found to have C5V symmetry [35] which has
the following character table:
2.3.4 Ropes of Carbon Nanotubes
In 1996, Thess et al. measured the properties of ropes of carbon nanotubes [35]. As shown in the diagram at right, ropes are bundles of tubes packed together in an orderly manner. They found that the individual SWNTs packed into a close-packed triangular lattice with a lattice constant of about 17 Å. This was later confirmed by Gao, Cagin, and Goddard in 1997 [36]. In addition, they concluded that the density, lattice parameter, and interlayer
spacing of the ropes was dependent on the chirality of the tubes in the mat. (10, 10) Armchair tubes had a lattice parameter of 16.78 Å and had a density of 1.33 g/cm3. Zigzag tubes of the chirality (17, 0) had a lattice parameter of 16.52 Å and a density of 1.34 g/cm3. Mats made of (12, 6) chiral SWNT's had a lattice parameter of 16.52 Å and a density of 1.40 g/cm3. The space between the tubes was also dependent on chirality. Armchair tubes had a spacing of 3.38 Å, zizzag tubes had a spacing of 3.41 Å, and (2n, n) chiral tubes had a interlayer spacing value of 3.39 Å. Compare these values to the spacing between the layers of graphite sheets, and the spacing between the variant walls of a MWNT, both about 3.4 Å[37]. As a good estimate, the lattice parameter in CNT ropes is d + 0.34 nm, where d is the tube diameter given above. The eletrical transport properties of SWNTs has been recently studied has raised some controversy. The conductance of a tube is quantized, and a nanotube acts as a ballistic conductor. Nanotubes also have a constant resistivity, and a tolerance for very high current density.
2.3.5 Ballistic Conductance
In 1998, Stephan Frank et al. experimented on the conductance of nanotubes [38]. Using a SPM, he carefully contacted nanotube fibers with a mercury surface. His results revealed that the nanotube behaved as a ballistic conductor with quantum behavior. The MWNT conductance jumped by increments of 1 G0 as additional nanotubes were touched to the
mercury surface. The value of G0 was found to be 1/12.9 kΩ-1, where G0= 2e2/h . The
coefficent of the conductance quantum was found to have some suprising integer and non-integer values, such as 0.5 G0. Later, in 1999, Sanvito, Kwon, Tománek, and Lambert,
used a scattering technique to calculate the ballistic quantum conductance of MWTNs [39]. They found that their results explained these unexpected conductance values found by Frank in 1998. Sanvito et al. stated that some of the quantum conductance channels were blocked by interwall reactions. Also, the interwall reactions of MWNTs were found to redistribute the current over individual tubes across the structure nonuniformly.
2.3.6 Resistivity and Maximum Current Density
Relatively early in the research of nanotubes, Thess et al. calculated the resistivity of ropes of metallic SWNTs to be in the order of 10-4 Ω-cm at 300 K [35]. They did this by measuring the resistivity directly with a four-point technique. One of their values they measured was 0.34 x 10⁻⁴, which they noted would indicate that the ropes were the most
highly conductive carbon fibers known, even factoring in their error in measurement. In the same study his measurements of the conductivity, Frank et al. was able to have reach a current denisty in the tube greater than 107 A/cm2 [38].
2.3.7 Thermal Conductivity
There seems to be some disagreement into the exact nature of the thermal conductivity of carbon nanotubes, although most agree that thermal conductivity seems to change depending on temperature, and possible also on current and vacancy concentration. In 1999, J. Hone, M. Whitney, and A. Zettle found that the thermal conductivity was temperature dependent, and was almost a linear relationship [40]. They suggested that the conductivity was linear in temperature from 7 K to 25 K. From 25 K to 40 K, the line increases in slope, and it arises monotonically with temperature to above room temperature. They proposed a model to explain the low temperature behavior, which is:
kzz = ΣCνz2τ (2-1)
Where kzz is the slope of the line on the graph, C is the heat capacity, ν is the sound velocity,
and τ is the relaxation time, which is approximately 10-11 s. They also found that the thermal conductivity for a single rope at room temperature could vary between 1800 - 6000 W/m-K. Also that year, Che, Cagin, and Goddard numerically calculated the thermal conductivity of a (10, 10) nanotube to approach 2980 W/m-K as the current applied to it is increased [41]. In 2000, Berber, Kwon, and Tomànek determined the thermal conductivity of carbon nanotubes and its dependence on temperature [42]. They confirmed the suggestion of Hone et al. in 1999 by suggesting an unusually high value of 6,600 W/m-k for the thermal conductivity at room temperature. They theorized that these high values would be due to the large phonon mean free paths, which would concur with Hone's model suggested above. Both groups stated that these values for thermal conductivity are comparable to diamond or a layer of graphite. However, Berber et al. suggested that the graphs of the temperature dependence of thermal conductivity looked much less linear than previously proposed by Hone et al. Instead of a near-linear graph with a positive slope, their graph showed a positive slope from low temperatures up to 100K, where it peaks around 37,000 W/m-K. Then, the thermal conductivity drops dramatically down to around 3000 W/m-k when the temperature approaches 400 K.
Chapter 3
Experimental setups
3.1 Bias-assisted microwave plasma chemical vapor deposition system
Fig.3-1 schematically depicts the layout of the MPECVD system. A quartz tube is vertically attached to a rectangular waveguide used as deposition chamber. The microwave from a magnetron source (model IMG 2502-S, IDX Tokyo, Japan) is supplied to the quartz tube through an isolator, and a power meter. Then the microwave power is coupled to the quartz tube through an aluminum waveguide with a hole drilled through from top to bottom face. Aluminum tubes extend out from both holes; the tube extensions are water-cooled as well. A sliding short circuit is then attached at the end of the waveguide. The lower position of the quartz tube is connected a stainless steel multi-port chamber equipped with a rotary pump. The substrates are positioned in the middle of the quartz tube waveguide intersection and held vertically by a substrate holder which is 20mm in diameter, made of molybdenum. Under the holder, attached a tantalum wire which is connected to the bias system; it was used as the lower electrode in the bias treatment stage. A quartz protector under the holder to protect the plasma not attracted to the tantalum wire attached to the molybdenum. The upper electrode, a molybdenum plate of 20mm in diameter which is placed 35 mm above the substrate, also attached to a tantalum wire. The controlled amount of the source gases was introduced into the chamber by mass flow controllers (model 647B, MKS instrument, Inc., USA) from the upper end of the quartz tube. A small window was cut in the waveguide at the center of the plasma cavity, allowing direct observation of the plasma.
Fig.3-1 Schematic diagram of MWPECVD
3.2 Analysis Instruments
3.2.1 Scanning Electron Microscopy (SEM)
Scanning electron microscopy is used to observe the surface morphology of wide range kinds of objects. It has the advantage of rather easy sample preparation, high image resolution, large depth of field, and high magnification. A common SEM contains an electron gun to generate electron beams, which will be accelerated under 0.4-40kV voltage. By deflecting the incident beams with the focusing coils, a two dimensional image can be obtained by detect the reflected secondary electrons and the backscatter electrons. The model we use here is JEOL 6500, with field emission electron source and 15kV accelerate voltage.
3.2.2 Transmission Electron Microscopy (TEM)
Transmission electron microscopy (TEM) is by far the most important technique for studying defects in great detail. Much of what was stated before about defects would be speculative theory, or would never have been conceived without TEM. In a typical TEM a static beam of electrons at 100-400kV accelerating voltage illuminate a region of an electron
transparent specimen which is immersed in the objective lens of the microscope. The transmitted and diffracted electrons are recombined by the objective lens to form a diffraction patter in the back focal plane of that lens and a magnified image of the sample in its image plane. A number of intermediate lenses are used to project either the image or the diffraction patter onto a fluorescent screen for observation. The screen is usually lifted and the image formed on photographic film for recording purposes. A simple diagram of typical TEM instrument is shown in Fig. 3-2.
Fig.3-2 Schematic diagram of a TEM.
3.2.3 Raman Spectroscopy
A powerful and nondestructive method to determine nanotube structure is Raman spectroscopy, which is widely used to study the vibrational modes of carbon-based graphitic nanostructures. While photons illuminate a molecule or a crystal, they react with the atoms accompany with momentum change or energy exchange. By collecting the scatter photons,
we can obtain a sequence of spectrum, including Raman scattering (inelastic scattering) and Reyleigh scattering (elastic scattering). The photon of Raman scattering can be classified into two kinds, Stoke side which photons loss energy or the molecules gains energy, and anti-Stoke side, which photons gains energy or molecules loss energy. Generally, Stoke side is used to characterize the material. As Raman spectrum provides information of crystallinity and bonding, it has become the most direct and convenient way to identify carbon related materials. The instrument we use is HORIBA Jobin Yvon, HR800. The source we use is He-Ne laser with wavelength of 632.82nm and power of 12mW. The spectral slit width is 0.4cm-1.
3.3.4 Energy Dispersive X-ray Analysis (EDX)
EDX is a microanalytical technique that uses the characteristic spectrum of x-rays emitted by the specimen after excitation by high-energy electrons to obtain information about its elemental composition. The ranges of elements detectable by EDX and electron energy loss spectroscopy (EELS) are somewhat complementary; EDX is generally better suited to detecting elements of high atomic number (Z) whereas EELS can readily detect low-Z elements. Unlike EELS, EDX does not provide chemical information (except through quantitative analysis in some cases). Compared to EELS, EDX is a relatively simple technique and provides rapid qualitative microanalysis of the specimen. The spatial resolution is determined by the probe size, beam broadening within the specimen, and the effect of backscattered electrons on the specimen around the point of analysis.
3.3.5 X-ray Diffraction (XRD)
XRD is a useful tool to analyze the crystallography of specimen. Also, we could determine the mean particle size of particles by XRD. When X-ray radiation passes through matter, the radiation interacts with the electrons in the atoms, resulting in scattering of the radiation. If the atoms are organized in planes and the distances between the atoms are of the same magnitude as the wavelength of the X-rays, constructive and destructive interference will occur. This results in diffraction where X-rays are emitted at characteristic angles based on the spaces between the atoms organized in crystalline structures called planes. Most crystals can have many sets of planes passed through their atoms. Each set of planes has a