1
行政院國家科學委員會補助專題研究計畫
□期中進度報告
■期末報告
(計畫名稱)
鐵系超導體之核磁共振研究
計畫類別:■個別型計畫 □整合型計畫
計畫編號:NSC 98-2112-M-009 -016 -MY3
執行期間: 2009 年 8 月 1 日至 2013 年 1 月 31 日
執行機構及系所:交通大學電子物理系
計畫主持人:
楊 本 立
共同主持人:
計畫參與人員:
本計畫除繳交成果報告外,另含下列出國報告,共 2 份:
□移地研究心得報告
■出席國際學術會議心得報告
□國際合作研究計畫國外研究報告
處理方式:除列管計畫及下列情形者外,得立即公開查詢
□涉及專利或其他智慧財產權,□一年□二年後可公開查詢
中 華 民 國 103 年 4 月 30 日
附件一國科會補助專題研究計畫成果報告自評表
請就研究內容與原計畫相符程度、達成預期目標情況、研究成果之學術或應用價
值(簡要敘述成果所代表之意義、價值、影響或進一步發展之可能性)
、是否適
合在學術期刊發表或申請專利、主要發現或其他有關價值等,作一綜合評估。
1. 請就研究內容與原計畫相符程度、達成預期目標情況作一綜合評估
□ 達成目標
□ 未達成目標(請說明,以
100 字為限)
□ 實驗失敗
□ 因故實驗中斷
□ 其他原因
說明:
The original proposal was to study iron-based superconductors by using NMR
techniques. However, the samples that we could get have already been studied by
other NMR groups. In the meantime, a new field, called topological insulator, was
growing rapidly and has not been studied by NMR. Therefore, we decided to switch
from the iron-based superconductor to the topological insulator, and other systems.
2. 研究成果在學術期刊發表或申請專利等情形:
論文:■已發表 □未發表之文稿 ■撰寫中 □無
專利:□已獲得 □申請中 □無
技轉:□已技轉 □洽談中 □無
其他:(以
100 字為限)
附件二3. 請依學術成就、技術創新、社會影響等方面,評估研究成果之學術或應用價
值(簡要敘述成果所代表之意義、價值、影響或進一步發展之可能性)(以
500 字為限)
We investigated the magnetic and superlattice structures of the battery material
NaxCoO2, the electronic structure in the topological insulator Bi2Se3, and the
superconductivity in micro-sized Pt powder.
1. We refined the superstructure in Na0.825CoO2, which is crucial for theorists to
understand the metallic antiferromagnetism in this material. We also found a
magnetic field-induced spin glass state near a FM and AFM phase boundary,
which has never been reported in literature.
2. We showed that conventional NMR techniques are not able to probe the
topological surface states of Bi2Se3, because the NMR signals are overwhelmed
by the bulk states. We think that a novel NMR technique, such as the resistive
NMR would be promising for probing the surface states, which is our future
plan. On the other hand, the bulk electron states in Bi2Se3 have been probed in
details by our NMR. The results will be useful for the future NMR study on the
Cu-doped Bi2Se3, which is believed to be a topological superconductor.
3. We tried to answer the question why the superconductivity appears in the micro
Pt powder, but not in the bulk Pt. We found that the superconductivity arises
from the surface of the micro powder instead of the bulk. The spin fluctuation,
which is believed to be the mechanism for some unconventional
superconductors, is not enhanced in the micro powder. The surface phonon
effect is probably the key to the Cooper pairing in the micro Pt powder.
中文摘要:
我們利用核磁共振技術,分別探討了 NaxCoO2中的磁性與超晶格結構、拓樸絕緣體Bi2Se3的電子
結構、及Pt 微米粉末中所出現的超導機制。我們分析 Na0.825CoO2的NMR 光譜,找到了唯一可以符合
實驗結果的三維超晶格模型,並且首次發現了因磁場所誘發的spin glass 態。分析 NMR 的頻譜偏移,
我們解釋了 Na0.825CoO2的磁化率在溫度 60K 附近所出現的異常轉折點,是因電子之間出現 coherence
的行為,而非磁性的short-ranged correlation 或 ordering。我們也量測了 Na2/3CoO2、 Na2/3CoO1.98、與
Na0.71CoO2的單晶樣品,發現只有Na2/3CoO2沒有出現有序的超晶格的結構,此與X-ray 量測結果一致,
並證實除了 Na 缺陷外,氧原子的缺陷對超晶格結構的形成亦不可忽視。我們量測數個不同方法製備 的 Bi2Se3樣品,發現它們的頻譜皆不盡相同,瞭解微小的缺陷就會造成內部載子濃度很大的變化,而 反映在NMR 的頻譜偏移與鬆弛時間 T1。另外,我們也發現NMR 只能量到 bulk 內部的電子態,並無 法量到拓樸的表面電子態。Pt 的超導相變已知只出現在微米顆粒的粉末,且它們的超導相變溫度會因 體積的壓縮而下降,我們量測不同體積壓縮的樣品,發現它們皆有相同的頻譜及原子核自旋鬆弛時間, 且未觀察到明顯的spin fluctuation,我們因此推論得知它們的超導機制應是由表面的聲子效應所引起的, 微米顆粒內部的電子並不會形成超導電子對。 中文關鍵詞: 超導、磁性、結構、拓樸絕緣體。 Abstract:
We conducted NMR studies on the magnetism and superlattice structure of NaxCoO2, the electronic structure in a topological insulator Bi2Se3, and the superconducting mechanism in Pt micro powder. We refined the superlattice structure that can best describe our NMR spectra for Na0.825CoO2. We discovered a magnetic field –induced spin glass state near the metamagnetic transition in Na0.825CoO2. Analyzing the NMR frequency shifts, we interpreted the susceptibility anomaly at 60 K as the onset of electron coherence instead of short-ranged magnetic correlation or ordering. We also measured Na2/3CoO2, Na2/3CoO1.98, and Na0.71CoO2, and found that only Na2/3CoO2 does not have superlattice peaks. This suggests that not only Na vacancy but also oxygen deficiency determine the superlattice formation in NaxCoO2. The topological insulator Bi2Se3 is a semiconductor, where small defects such as Se deficiency can alter the charge carriers or Fermi surface significantly. We measured several single crystals of Bi2Se3 grown by different methods and found that their NMR spectra do not look the same, which reflects the different levels of defects in these crystals. As a result, the electron density of states in these crystals are also different, as evidenced by the NMR frequency shift and nuclear spin-lattice relaxation rate 1/T1. However, we found that conventional NMR technique can probe only the bulk states and the signals from the topological surface states are too weak to be detected. The Pt superconductivity occurs only in micro powder but not in bulk, and its superconducting critical temperature is suppressed in highly packed powder. We studied Pt micro powders of different packing ratios, and found no differences in their NMR spectra and 1/T1 data. These infer that the superconductivity arises from the surface of the micro powder instead of the bulk. The spin fluctuation, which is believed to be the mechanism for some unconventional superconductors, is not enhanced in the micro powder. The surface phonon effect is probably the key to the Cooper pairing in the micro Pt powder.
Keywords:
Superconductivity, magnetism, structure, topological insulator.
Contents
I. Introduction ... 6
II. Magnetism and Superstructure in NaxCoO2 ... 6
A. Superstructure in a metallic antiferromagnet Na0.825CoO2 ... 6
B. Superstructure in Na2/3CoO2, Na2/3CoO1.98, and Na0.71CoO2 ... 12
III. Electronic structure in Bi2Se3 ... 15
I. Introduction
The search of the new iron-based superconductors was launched in the year of 2008. Within less than a year, several iron-based superconductors of different types have been synthesized, as well as a rapid growing number of papers have been produced. For example, we published a paper on the NMR study of the FeSe superconductor in 2010, but there were already two NMR papers on the same material reported earlier than ours.1 This proposal was original to study the iron-based superconductors by using NMR techniques. However, the samples that we could get have already been studied by other NMR groups. In the meantime, a new field, called topological insulator, was also growing rapidly and had not been studied by NMR. Therefore, we decided to switch from the iron-based superconductor to the topological insulator, and other strong-correlated systems.
We have conducted NMR studies on the two correlated-electron systems, NaxCoO2 and Bi2Se3, and also
the pure element Pt in the form of micro powder. The magnetism and superlattice structure in NaxCoO2, the electronic structure in a topological insulator Bi2Se3, and the superconducting mechanism in Pt micro powder were investigated. The result for Bi2Se3 has been published, and the others are in preparation. The details are described as follows.
II. Magnetism and Superstructure in Na
xCoO
2A. Superstructure in a metallic antiferromagnet Na0.825CoO2
Sodium cobaltate, NaxCoO2, which was originally known as a battery material, has been extensive studied for its other prominent features such as thermoelectricity, superconductivity, and magnetism.2-4 The crystal consists of alternating layers of triangular Co lattice and Na. Varying Na content changes the charge configuration (Co3+, Co4+) in the Co layers. Interestingly, the Na atoms form structural ordering patterns at certain sodium concentrations.5 Due to the subtle interplay of the Na ordering with the charges and spins of the Co ions, a unique and rich phase diagram has been found.6 Recently, the phase diagram has been refined, where only three distinct antiferromagnetic (AF) transitions were found. Structural phase separation was reported in the two regions of 0.76 < x < 0.82 and 0.83 < x < 0.86.7 In particular, the x = 0.82 sample has the most stable AF phase and a well-defined superlattice structure. The local electronic properties and the Co magnetism, in connection with the Na ordering, has been investigated for the concentrations of x = 1/2 (metal-insulator),8 x = 2/3 (Curie-Weiss metal),9 and x = 1 (band insulator).10 To have a complete picture of this atypical magnetic phase diagram, we conduct a nuclear magnetic resonance (NMR) study on the antiferromagnetic phase of a NaxCoO2 single crystal with the particular stable concentration x = 0.825.
We use a high-quality Na0.825CoO2 single crystal, obtained from Prof. F.-C. Chou at National Taiwan University, for our NMR experiments. Na0.825CoO2 has a long-range A-type AF order with the Néel temperature TN = 22 K,4 as shown in Fig. 1 of the magnetic susceptibility.
Figure 1 Magnetic susceptibility of Na0.825CoO2 for magnetic field applied along the crystalline c axis. Antiferromagnetic transition occurs at 22 K. The arrow at ∼ 60 K denotes the deviation from Curie-Weiss behavior.
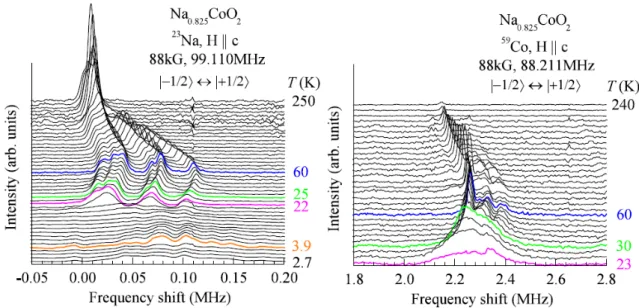
Standard Hahn-echo pulse sequences were employed throughout our 23Na and 59Co NMR experiments. Figure 2 shows the temperature-swept spectra for their central (|−1/2 ↔ |+1/2 ) transitions with the magnetic field 88 kG applied parallel to the crystalline c axis. Multiple peaks are observed and these peaks are separated around 60 K. There are total 6 well-resolved peaks of 23Na and 4 peaks of 59Co for the central transition (Fig. 3).
Figure 2 Temperature-swept 23Na and 59Co NMR spectra of Na
0.825CoO2 for magnetic field applied along
the crystalline c axis.
These sharp peaks suggest that Na vacancies are not randomly distributed in this crystal, but are to form particular pattern, otherwise, the spectra would have been broadened. From the peak numbers, we find that there are 6 and 4 different crystallographic sites for the Na and Co atoms, respectively, which is also confirmed by analyzing their quadrupolar satellite peaks and the spectra with the magnetic field perpendicular to the c axis.
Figure 3 (a) 23Na and (b) 59Co NMR spectra of Na
0.825CoO2 for magnetic field applied along the crystalline
c axis. There are 6 well-resolved peaks for the central transition (|−1/2 ↔ |+1/2 ) in (a) and 4 peaks in (b).
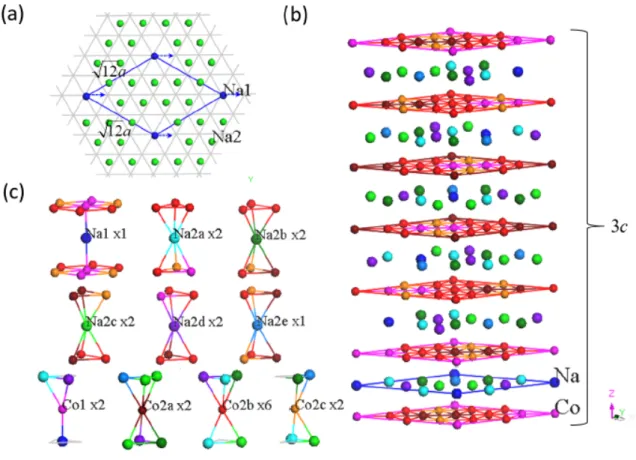
Vacancies in the Na layers produce two distinguished crystallographic Na sites, called Na1 and Na2.11 Na1 is located directly between the two cobalt atoms from its neighboring Co layers, whereas Na2 is sandwiched by the triangular Co sub-lattices [Fig. 4(a)]. The Co atoms which are right on top and below the Na1 atom are called Co1, and the rest of Co atoms are called Co2, by convention. Depending on the Na contents, the Na vacancy can form different clusters. Several models for the Na ordering patterns in NaxCoO2
have been proposed experimentally and theoretically, but discrepancy exists among the models.5,12-15 For Na0.825CoO2, the tri-vacancy and quadri-vacancy clusters are inferred, according to the vacancy clustering model proposed by Roger et al.13 A di-vacancy cluster model with the superlattice unit cell size
13a 13a , however, was suggested based on the x-ray diffraction experiments.3c 7 With these pieces of
information, we were motivated to examine all the pro posed vacancy cluster models and to search for the one that could give the 6 Na and 4 Co sites as derived from our NMR experiments. However, we did not find any at all. Since the 3c periodicity of the supercell along the c axis was affirmed,7 we then tried again by keeping the 3c periodicity but with tuning the supercell size a little bit. Eventually, we found that only the Na di-vacancy clusters with the supercell size 12a 12a [Fig. 4(a)] could give the correct numbers of Na 3c
and Co sites suggested by our NMR. This superlattice is formed by stacking the six 12a 12a Na
di-vacancy layers along the c axis as illustrated in Fig. 4(b), where the Na vacancy layers are offset each other by a lattice vector. Six different Na sites and four Co sites are identified as shown in Fig. 4(c), where the numbers next to the site labels denote the occupancies of these sites in a unit supercell. For this superstructure, the Na content is x = 0.833(= 10/12) which is very close to our nominal content x = 0.825. To further examine this superlattice model, we can compare the relative NMR peak intensity with the site occupancy for these different Na and Co sites. Note that a square of frequency correction and the spin-spin relax ation (T2) effect are needed to be considered in order to obtain the true spectrum intensity.9 We found that all the 6 Na sites have a very similar T2 relaxation time at 30 K, so that the Na peak intensities in Fig. 3(a) reflect the true site occupancies by chance. We found that the 4th and 6th peaks have a roughly half intensity compared to that for the rest 4 peaks. This is in consistent with the relative site occupancies of Na as shown in Fig. 4(c). However, we are unable to assign the peaks to which Na site, because of equal occupancy 0.2 for the 4 sites (Na2a, Na2b, Na2c, Na2d) and 0.1 for the rest 2 sites. As for the Co sites, we found that the T2 effect is significant in correcting the intensities in Fig. 3(b), where the peak at a higher frequency has a faster relaxation rate 1/T2 as seen in Na2/3CoO2.9 The corrected relative intensity ratio that we obtained for the peaks 1 to 4 is 1 : 0.7 : 1 :
2.3. We consider this ratio is compatible with the occupancy ratio 1:1:1:3 in Fig. 4(c), and the 4th peak could be assigned to the Co2b site. The poor accuracy of the intensity comparison could be due to the experimental error, where the NMR pulse parameters were optimized only for the 1st Co peak and the same pulse parameters were used for obtaining the rest peaks.
Figure 4 The superlattice model derived from our NMR data. (a) A Na di-vacancy layer with the supercell size 12a 12a. (b) The superlattice formed by stacking the 6 Na di-vacancy layers which are offset each other by one lattice vector. The supercell size is 3c along the c axis. (c) The 6 different Na sites and 4 Co sites, extracted from (b).
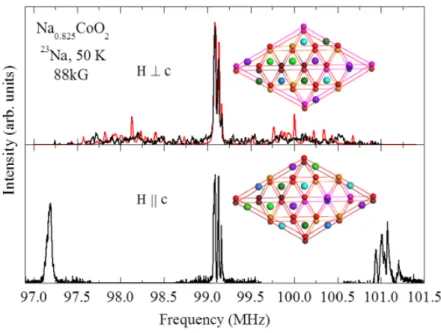
Figure 5 shows the 23Na NMR spectrum for magnetic field B⊥c and B∥c. The quadrupolar satellites for
B⊥c are barely seen and are scattered on both sides of the central peaks, unlike those for B∥c. The NMR
resonance frequency for the transition |m ↔ |m − 1 is determined by the equation,
/ 2
1
1/ 2 3cos
2 1 sin2 cos 2 / 2
Q
f K B f m ,
where γ is nuclear gyromagnetic ratio, K is the frequency shift, B is the applied magnetic field, fQ is the nuclear quadrupolar frequency, and θ and ϕ are the polar and azimuthal angles of the magnetic field relative to the principle axes of the electric field gradient.16 η is an asymmetry parameter that characterizes the axial symmetry of the electric field gradients. η = 0 is for the nuclear site to have a uniaxial symmetry. According to Fig. 4(c), all the Na sites do not posses uniaxial symmetry so that η ≠ 0 and their quadrupolar satellite peak position depends on ϕ, when magnetic field perpendicular to the c axis. For spectrum in this field direction, we notice that all the Na2a sites in a unit supercell do not have the same ϕ, due to their EFG principle axes oriented differently with respect to the magnetic field in the three-dimensional stacking of the Na layers, as illustrated in Fig. 5. Four different ϕs are found for the Na2a sites, as well as for the Na2b, Na2c, and Na2d sites, but only one ϕ is found for the Na1 and Na2e sites. Each ϕ gives a set of the quadrupolar satellite peaks.
Therefore, there would be 18 (= 4 × 4 + 2) sets of the quadrupolar peaks that are scattered on both sides of the central peaks. According to this superstructure model, the simulated spectrum is shown in Fig. 5(a), which qualitatively captures the feature of the experimental curve. Overall, we have tried numerous superstructures, and this proposed superlattice model is the only structure that we could found to best describe our NMR data and to give the correct Na content x for our sample.
Figure 5 23Na NMR spectra of Na
0.825CoO2 for magnetic field applied (a)
perpendicular (b) parallel to the crystalline c axis. The red curve in (a) is a simulated spectrum. The top two Na layers in Fig. 4(b) are illustrated here to show that the azimuthal angle ϕ of the magnetic field relative to the electric field gradient principle axes of the 4 Na2a (cyan) sites are different.
Cobalt atoms situated in such a superstructure could produce non-trivial electron correlation and collective magnetic behavior. We notice that the magnetic susceptibility curve in Fig. 1 deviates from the Curie-Weiss behavior at ∼ 60 K before entering the AFM phase. This is often attributed to the onset of short-range magnetic correlation or ordering. However, we found that the 23Na and 59Co NMR spectra do not have apparent line broadening, as anticipated for any short-range magnetic ordering at 60 K, until the temperature is close to 30 K, before the AFM transition at 22 K. The crystal field effect is ruled out here because the splitting between the lower-lying t2g and higher-lying eg bands is ∼ 2.5 eV, much higher than this temperature range.17 Since the NMR frequency shift is a measure of the local magnetic susceptibility, we then compare the frequency shifts of all the Na and Co peaks with the bulk susceptibility as shown in Fig. 6 (a) and (b). Interestingly, the local susceptibility deviates from the bulk susceptibility, usually called shift anomaly,18 at the same temperature where the Curie-Weiss behavior breaks down. This indicates that an additional local susceptibility component might arise due to the coherence of the delocalized Co 3d electrons, as seen in the Kondo lattices.18 According to Ref. 18, the bulk susceptibility may be modeled as
T 1 f T
d
T f T
0 T , where the χd and χ0 are the susceptibilities of the localized and the coherent d electrons, respectively. The ratio of these two components is a function of temperature characterized by f(T). The frequency shift is given by, K(T) = Adχd + A0χ0, where Ad and A0 are the nuclear hyperfine coupling constants. The shift anomaly is then obtained if it is written as an explicit function of the
bulk susceptibility. Since there are several Na and Co sites, we could further express the shift of the j-th Na (or Co) site in terms of the shift of the i-th Na (or Co) site, such as, Kj = (Ad,j/Ad,i)Ki + [A0,j − (Ad,j/Ad,i)A0,i]χ0. Figures 6(c) and (d) are the plots of the Na and Co shifts with respect to the Na#1 and Co#1 shifts, respectively. The linear relation between the individual shifts is interrupted at ∼ 60 K and then is restored around 30 K. This suggests that χ0 emerges at 60 K and then saturates, and all the Na and Co sites see χ0. If the shift anomaly is caused by the short-range ordering, the breakdown of the linear relation in Figs. 6(c) and (d) should persist into the long-range order regime.
Figure 6 (a) and (b) are the comparisons of 23Na and 59Co NMR frequency shifts, respectively, with the bulk magnetic susceptibility. The curve labels denote the peak indices as assigned in Fig. 3. Figures (c) and (d) are plots of the 23Na and 59Co shifts versus the Na#1 and Co#1 shifts, respectively.
Na0.825CoO2 has an A-type AFM order. When applying magnetic field, it can undergo a metamagnetic transition, where the AFM state is spin-flopped into a ferromagnetic (FM) state.6 Our NMR spectra were taken at 88 kG, which happens to make the sample to be in a state near the metamagnetic phase boundary. According to Fig. 2, the sample first enters a FM state at 22 K, and returns to an AFM phase at 3.9 K. At 4.2 K, we accidentally observed that the 23Na spectrum shows time dependence after the sample was warmed up from 2.7 K to 4.2 K. It took about 120 min. for the sample to recover from the AFM to FM state. This slow spin dynamic indicates that spin glass might occur near the metamagnetic boundary. According to Ref. 19, the interlayer AFM exchange coupling is not too different from the intralayer FM exchange coupling, so that a little non-uniform magnetic field in the sample could cause a mixture of the two phases. The spin frustration, due to the competing AFM and FM interactions, then could occur for the Co spins in a triangular lattice as illustrated in Fig. 7(b). In principle, the conditions required for a spin glass, such as lattice disorder and spin frustration, are fulfilled in Na0.825CoO2. It would be interesting to further investigate this magnetic field-induced glassy behavior to see if it has similar properties as ordinary spin glasses.
Figure 7 (a) Time-dependent 23Na NMR spectra of Na
0.825CoO2 at 88 kG and 4.2 K, near the AFM and FM
phase boundary. (b) The magnetic structures of the AFM and FM phases in Na0.825CoO2. The Co spins in the triangular lattice are frustrated near the AFM-FM phase boundary (see text).
In summary, we refine the 3-dimensional superstructure in a Na0.825CoO2 single crystal by NMR experiments. We found that additional susceptibility component emerging at ∼ 60 K, due to the onset of electron coherence. A magnetic field-induced glassy behavior is observed near a FM-AFM metamagnetic phase boundary. With Our superlattice model, theorists may be able to solve the localized and itinerant issues of the Co 3d electrons that produce the metallic antiferromagnetism in Na0.825CoO2. The manuscript for this work will be submitted to Phys. Rev. Lett. soon.
B. Superstructure in Na2/3CoO2, Na2/3CoO1.98, and Na0.71CoO2
The Na vacancy in NaxCoO2 is not randomly distributed at certain Na content x. There has been a debate on whether there is superlattice pattern or not for x = 2/3.9,20 According to Ref. 20, the Na vacancy does not order in Na2/3CoO2, but does order in the oxygen deficient Na2/3CoO1.98 instead. In addition, its superstructure is very similar to that in Na0.71CoO2. However, Platova et al. claimed that the Na ordering is observed in Na2/3CoO2 by their NMR study and they even proposed a superlattice model. In order to solve this controversy, we measured the NMR spectra for the three samples Na2/3CoO2, Na2/3CoO1.98, and Na0.71CoO2, provided by Prof. F. -C. Chou at National Taiwan University.
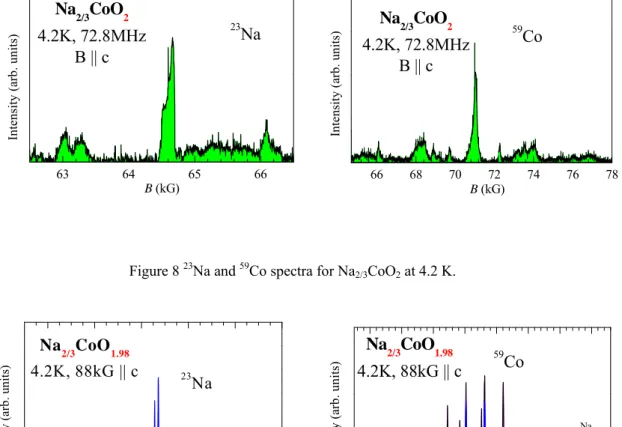
The spectra for the three samples are shown in Figures 8 - 10. Judging by the resolution of the peaks, we can easily tell that Na vacancy is disordered in Na2/3CoO2, and the superstructure indeed occurs in Na2/3CoO1.98, and Na0.71CoO2. Our results are indeed in consistent with those in Ref. 20. Comparing Figs. 9 and 10, we found that Na2/3CoO1.98, and Na0.71CoO2 have a very similar superstructure, but Na2/3CoO1.98 is a little disordered than Na0.71CoO2, due to the broader 59Co spectrum of Na2/3CoO1.98.
Though our results support the conclusion in Ref. 20, we still do not know why Platova et al. had different NMR results on Na2/3CoO2, where their spectra of Na2/3CoO2 are similar to those of our Na0.71CoO2. The key to solve this puzzle is to find out the superstructure of our Na0.71CoO2. We are still working on it. Once we find it, we can wrap up this research and write a paper.
63 64 65 66 23 Na In te ns it y ( ar b. uni ts ) B (kG) Na2/3CoO2 4.2K, 72.8MHz B || c 66 68 70 72 74 76 78 In te nsit y (arb. un its) B (kG) Na2/3CoO2 4.2K, 72.8MHz B || c 59Co
Figure 8 23Na and 59Co spectra for Na
2/3CoO2 at 4.2 K. 97 98 99 100 101 102 23 Na Na2/3CoO1.98 4.2K, 88kG || c f (MHz) In te ns it y (a rb . un it s) 84 86 88 90 92 94 96 98 Na 2/3CoO1.98 4.2K, 88kG || c Na In tensit y ( ar b. units) f (MHz) 59 Co
Figure 9 23Na and 59Co spectra for Na
2/3CoO1.98 at 4.2 K. 97 98 99 100 101 23 Na Na 2/3CoO1.98 4.2K, 88kG || c In tensit y ( ar b. units) f (MHz) 84 86 88 90 92 94 96 98 59 Co Na0.71CoO2 4.2K, 88kG || c In te ns it y (a rb . u ni ts ) f (MHz) 23Na
Figure 10 23Na and 59Co spectra for Na
0.71CoO2 at 4.2 K.
References
1. Ben-Li Young et al., Phys. Rev. B 81, 144513 (2010). 2. I. Terasaki et al., Phys. Rev. B 56, R12685 (1997). 3. K. Takada et al., Nature 422, 53 (2003).
4. S. P. Bayrakci et al., Phys. Rev. B 69, 100410 (2004). 5. H. W. Zandbergen et al., Phys. Rev. B 70, 024101 (2004).
6. M. L. Foo et al., Phys. Rev. Lett. 92, 247001 (2004). 7. G. J. Shu et al., Phys. Rev. B 80, 014117 (2009). 8. J. Bobroff et al., Phys. Rev. Lett. 96, 107201 (2006). 9. T. A. Platova et al., Phys. Rev. B 80, 224106 (2009). 10. G. Lang et al., Phys. Rev. B 72, 094404 (2005). 11. Q. Huang et al., Phys. Rev. B 70, 184110 (2004). 12. P. Zhang et al., Phys. Rev. B 71, 153102 (2005). 13. M. Roger et al, Nature 445, 631 (2007).
14. Y. Hinuma et al., Phys. Rev. B 77, 224111 (2008). 15. Y. S. Meng et al, J. Chem. Phys. 128, 104708 (2008).
16. A. Abragam, The Principles of Nuclear Magnetism (Oxford University Press Inc., 1996). 17. D. J. Singh, Phys. Rev. B 61, 13397 (2000).
18. N. J. Curro et al., Phys. Rev. B 70, 235117 (2004). 19. S. P. Bayrakci et al., Phys. Rev. Lett. 94, 157205 (2005). 20. G. J. Shu et al., Phys. Rev. B 82, 054106 (2010).
III. Electronic structure in Bi
2Se
3Bi2Se3 is a semiconductor that belongs to the class of thermoelectric materials, Bi2X3 (X = Se, Te), which has been extensively studied due to its huge technological potential.1 Recently, these Bi-based compounds drew a tremendous attention when their topological-insulator character was revealed by angle-resolved photoemission spectroscopy (ARPES).2,3 Surfaces of these materials are characterized by the existence of gapless surface states while the bulk shows semiconductor-like energy gap in the bulk. Due to the strong spin-orbit interaction, spins of the surface electrons are locked perpendicularly to their momenta, forming a single Dirac-like cone with a chiral spin structure.4 These states provide a playground for many striking quantum phenomena, such as the image magnetic monopole induced by a point charge,5 Majorana fermions,6 and axions inside a topological magnetic insulator.7 Bi2Se3 has been studied by various techniques, but to the best of our knowledge, nuclear magnetic resonance (NMR) has not been attempted so far. Therefore we were motivated to apply NMR to microscopically probe the electronic structure and to study structural defects in Bi2Se3.
Our Bi2Se3 single crystals were obtained from Prof. F. C. Chou at National Taiwan University and Dr. G. D. Gu at Brookhaven National Laboratory. They were prepared by using the three different methods: chemical vapor transport (CVT), traveling solvent zone, and Se self-flux growth. In the following discussion, the crystals grown by these three methods are labeled as samples Nos. 1, 2, and 3, respectively.
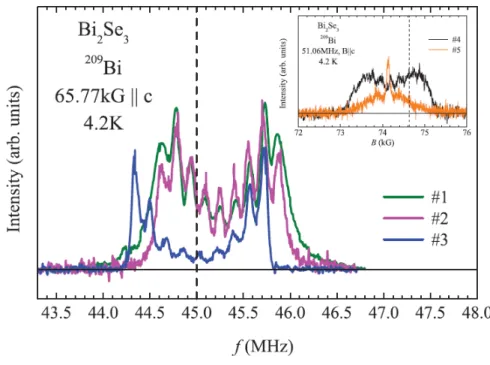
Figure 1 shows the 209Bi NMR frequency-swept spectra of three Bi2Se3 samples, for a magnetic field (65.77 kG) applied along the crystalline c axis at a temperature of 4.2 K. The line profiles for samples Nos. 1 and 2 are similar, but different for sample No. 3. However, they all have nine well-resolved and evenly-spaced peaks with lower intensities near the center, confirming the high quality of our crystals. For comparison, the spectra (shown in the inset) of our early low-quality crystals, by the Bridgeman and CVT methods, are relatively broad.
Figure 1 209Bi NMR frequency-swept spectra in three Bi
2Se3 single crystals Nos. 1–3 at 4.2 K for a magnetic field of 65.77 kG applied along the c axis. The dashed line denotes
the position of the unshifted Larmor frequency f0(MHz)= (γ/2π)65.77, where γ/2π = 0.684 MHz/kG is the 209Bi nuclear gyromagnetic ratio. (Inset) 209Bi field-swept spectra of our early Bi2Se3 crystals Nos. 4 and 5 (by the Bridgeman and CVT methods, respectively), where the broad linewidth suggests their low quality.
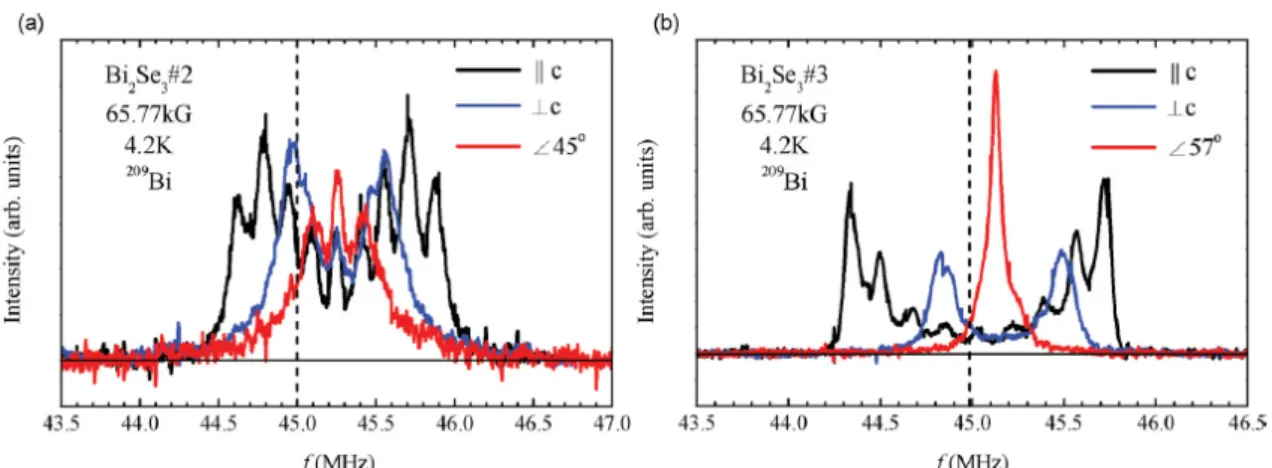
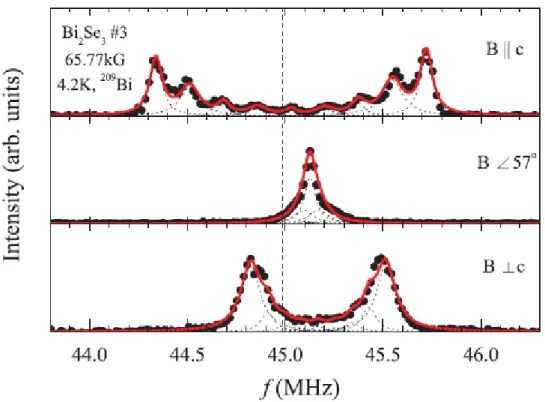
At a first glance, these nine sharp peaks appear to depict a nuclear quadrupolar multiplet of the 209Bi sites with a nonzero electric field gradient (EFG), since the nuclear spin of 209Bi is 9/2. However, the peak intensity profile does not resemble the typical nuclear quadrupolar spectrum with the highest intensity central peak and weaker satellites. The intensity profile could be distorted due to additional peaks hiding beneath the quadrupolar satellites. However, according to the Bi2Se3 crystal structure, all the bismuth sites are equivalent and it is unlikely for 209Bi to experience different bulk environments.8 We have ruled out a possibility of hidden peaks, including the contribution from the surface, by measuring the spectra in magnetic field applied along different crystalline directions, as shown in Fig. 2. We find that all the peaks show an angular dependence of the NMR quadrupolar m ↔ (m − 1) level transition, with the resonance frequency fm↔(m−1) = (γ/2π)[1 + K(θ)]B + fQ(m − 1/2)(3cos2θ − 1)/2, where γ is nuclear gyromagnetic ratio of 209Bi, K is the NMR frequency shift, B is the applied magnetic field, fQ is the nuclear quadrupolar frequency, and θ is the angle of the magnetic field relative to the c axis.9 We can see that the side peaks move toward the center as the field angle approaches themagic angle θ=54.7 (i.e., 3cos2θ − 1 = 0) at which the quadrupolar splitting vanishes. If there were any hidden peaks, then they should have been separated from the quadrupolar peaks at different field angles, because of their different angle dependence. By fitting the B||c spectra in Fig. 2 to the above equation, we obtain fQ = 0.15(5) MHz and 0.17(3) MHz for the samples Nos. 2 and 3, respectively. These values are unusually small compared to fQ = 2.1MHz for a pure Bi metal and several MHz for other bismuth compounds.10,11 We then fixed the quadrupolar parameters and let the frequency shift K(θ) as a free fit parameter in the curve fittings for B⊥c and B57 The selected fit results are shown in Fig. 3 for the sample No. 3.
Figure 2 209Bi NMR frequency-swept spectra of Bi
2Se3 for (a) sample No. 2 and (b) sample No. 3, with magnetic fields applied at different angles with respect to the c axis. The dashed line denotes the unshifted Larmor frequency position.
Figure 3 The curve fittings for the 209Bi NMR frequency-swept spectra of Bi
2Se3, sample No. 3, for the magnetic field directions B||c, B 57, and B⊥c. (Circles: spectrum points; red curve: fitting curve; dotted curve: individual quadrupolar peaks.)
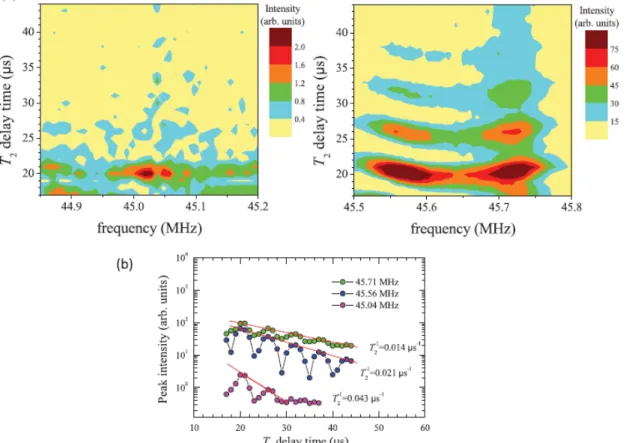
The intensity anomaly in the spectra can be explained as an effect of the nuclear spin-spin relaxation time (T2).We find that the peaks near the center have shorter T2 than the ones further out on both sides, so that the central peaks decay faster than the side peaks. This is demonstrated in Fig. 4, which shows the NMR intensity decay as a function of T2 delay time, τ (τ is the time interval between the NMR π/2 – π echo pulses typically used for T2 relaxation experiments). However, we could not explain the not monotonic decrease in intensity from the outmost satellite to the central peak in samples Nos. 1 and 2 (see Fig. 1). From the relaxation curves at frequencies 45.04, 45.56, and 45.71 MHz, the relaxation rates, 1/T2, are, respectively, estimated to be 0.043, 0.021, and 0.014 μs−1 [see Fig. 4(b)], by fitting the peak points of the curves to the relaxation function M(τ ) = M(τ = 0)e−2τ/T2 . The intensities in Fig. 4 that oscillate with the T2 delay time with the period τ ∼ 6 μs are a common feature of the nuclear quadrupolar effect.12 They satisfy the relation fQτ ∼ 1, where fQ ∼ 0.16 MHz is the separation of the peaks in Fig. 1. Therefore we have confirmed that the 209Bi NMR signal is coming solely from the same site environment in the bulk of Bi2Se3. Given the overwhelming signal from the bulk states within the 200-μm skin depth of the NMR excitation pulses, the 209Bi NMR has insufficient sensitivity for the weak contribution from the topological surface state that is localized to only a few quintuplet layers from the surface. Also, our NMR did not detect the antisite defects for Bi/Se mixing in Bi2Se3. Note that the antisite defects tend to occur in Bi2Te3.13
Figure 4 (a) The decay of 209Bi NMR intensity as a function of T
2 delay time (see text) for the Bi2Se3 sample No. 3 at 65.77 kG and 4.2 K. The left panel is for peaks near the center. Right panel is for the satellite peaks on the high-frequency side. (b) The T2 relaxation curves at frequencies 45.04, 45.56, and 45.71 MHz. The red lines are the curve fittings for the points at the peaks of each curve. The relaxation rates 1/T2 , obtained from the fits, are labeled next to the curves.
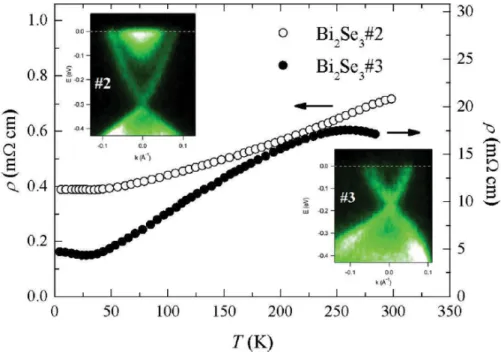
Figure 1 shows that the NMR frequency shift for the central peak in sample No. 3 is different from those in the other two crystals. Also, the spectral linewidth in that sample is different. These suggest that the electronic states and the structural defect level are different in the studied crystals. The linewidth difference could be qualitatively judged by comparing their outermost satellites. Sample No. 3 has the smallest linewidth because it has the shortest tail. We can infer that the defect concentration is lower in sample No. 3 than in samples Nos.1 and 2. These defects are mostly due to the Se vacancies that cause the electron doping and a partial occupation of the conduction band.14 Indeed, the ARPES spectra show a significant difference in the electronic structure between the samples Nos. 2 and 3. Not only is the cone of topological surface state more occupied with electrons, but also, the parabolic bottom of the bulk conduction band is clearly visible in the spectrum of sample No. 2, while it is nearly completely absent from the spectrum of sample No. 3. This indicates that both the bulk and the surface of sample No. 3 have much lower carrier (electron) concentration than the other two samples. This is also reflected in transport, where resistivity of sample No. 3 is an order of magnitude higher than that in sample No.2 (see Fig. 5).
Figure 5 Temperature-dependent resistivity for Bi2Se3 samples No. 2 (open circles) and No. 3 (solid circles). The corresponding ARPES spectra (insets) show a significant shift in the chemical potential between these two samples, indicating higher carrier concentration in sample No. 2. The spectra were recorded along the K line in the surface Brillouin zone.
The NMR frequency shift in Bi2Se3 arises from the spin and orbital moments of electrons that interact with nuclei via the hyperfine interactions, such as Fermi contact and dipolar interactions.15 The Fermi contact interaction gives an isotropic frequency shift due to the s-wave conduction electrons in Bi2Se3. This shift is expected to be proportional to the electronic density of states. In contrast, the dipole interaction usually produces an anisotropic frequency shift. From Fig. 2, we see that the frequency shift is slightly anisotropic in sample No. 3, but is isotropic in sample No. 2. By analyzing the frequency shifts, K(θ) (obtained from the previous curve fittings), using the angle-dependent shift, K(θ) = Kiso + Kax(3cos2 θ − 1), where Kiso and Kax respectively are the isotropic (average) shift and axial shift,16 we obtained Kiso = 0.65% ± 0.05% and Kax = 0 ± 0.05% for sample No. 2, and Kiso = 0.34% ± 0.05% and Kax = −0.10% ± 0.05% for sample No. 3. Positive Kiso suggests that the frequency shift is dominated by the Fermi contact interaction, even though Bi2Se3 is diamagnetic.17 From the magnitude of Kiso, which is related to the electronic density, we infer that the sample No. 3 has fewer conduction electrons than the sample No. 2. The ARPES results in the insets of Fig. 5 fully support this. While the bottom of bulk conduction band is clearly visible in sample No. 2, it is essentially absent from the spectrum of sample No. 3. Therefore the conduction band is shifted above the Fermi level in sample No. 3, at least in the surface region (we note that there might be a slight band bending near the surface). The cone-like state, corresponding to the topological surface state, is also shifted upwards relative to the one in sample No. 2. This indicates that the sample No. 3 has less electrons, both in bulk and at the surface. Since the sample No. 2 has more charge carriers, the anisotropic term is overwhelmed by the isotropic term from conduction electrons. The sample No. 3, which has fewer conduction electrons, shows a weak anisotropic shift, an indicative of the dipole interaction.
Figure 6 shows the temperature dependence of the nuclear spin-lattice relaxation rate (1/T1) in the Bi2Se3 crystals. The similarity of samples Nos. 1 and 2, as compared to the relatively different sample No. 3, is again reflected in the 1/T1 data. The relaxation mechanism for 209Bi 1/T1 in Bi2Se3 includes the magnetic relaxation
(1/T1,m) from the scattering of conduction electrons, and quadrupolar relaxation (1/T1,q) from fluctuations of the electric field gradient, i.e., 1/T1 =1/T1,m + 1/T1,q. The magnetic relaxation by conduction electrons in a semiconductor produces 1/T1,m ∝ NT0.5,which is different from the Korringa relation, 1/T1,m ∝ D2(EF )T, for a metal, where N and D(EF ), respectively, are the charge carrier concentration and density of states at the Fermi level.9 In contrast, the quadrupolar relaxation in a semiconductor is independent of the carrier concentration, and is a property of the lattice, so that 1/T1,q depends on the details of the phonon spectrum. We are not aware of any universal behavior of the temperature-dependent 1/T1,q; it should behave differently for temperatures above and below the Debye temperature.22 Yet, the change in the power law, 1/T1 ∝ T α, in Fig. 6, is not related to the Debye temperature, which is ∼182 K, beyond our temperature range.18 The change in power law is most likely due to the competition between the magnetic and quadrupolar relaxations, where the former dominates at low temperature. Therefore the smaller 1/T1 at low temperature in sample No. 3, as compared to those in samples Nos. 1 and 2, again suggests that sample No. 3 has a smaller charge-carrier density than the others. In addition, we find a Korringa relation of 1/T1 ∝ T, for the more conductive samples Nos. 1 and 2, and a power of 0.7, close to the theoretical value of 0.5 for a semiconductor, for the less conductive sample No. 3. This agrees with the resistivity data in Fig. 5, showing metallic and semiconductor-like behavior in samples Nos. 2 and 3, respectively. The quadrupolar relaxation, which is independent of carrier density, dominates at high temperature, so that the 1/T1 curves of all the samples merge at temperatures above 50 K.
Figure 6 Temperature dependence of nuclear spin-lattice relaxation rate (1/T1) for Bi2Se3 crystals.
Figure 7 shows the magnetization curve for sample No. 3, indicating a diamagnetic material, although with a slight temperature dependence at low temperature. We note that previous studies reported temperature-independent diamagnetism in Bi2Se3.17,20 As the increasing magnetization at low temperature often points to the presence of magnetic impurities, we wanted to identify the cause of the weak temperature dependence and to investigate the local magnetism in our low-defect Bi2Se3 sample No. 3.We performed the 209Bi NMR measurements at three different temperatures, 4.2, 40, and 120 K (see inset of Fig. 7). The spectra shift to the lower field (a higher positive shift) with decreasing temperature. This confirms that the weak
temperature dependence of magnetization is not an impurity effect but is intrinsic. In addition, the change in the NMR shift is due to the Fermi contact of the conduction electrons, which changes gradually with temperature. Therefore, we conclude that the weak temperature-dependent magnetization is caused by the slight change of the Pauli susceptibility at low temperature and that the orbital diamagnetism remains temperature independent. As we do not see any surface effects in our NMR spectra, we stress that the observed magnetization is not related to the spin polarization of the topological surface state.4,21
Figure 7 Temperature-dependent magnetization curves for Bi2Se3 No. 3. (Inset) 209Bi NMR spectra at temperatures of 4.2, 40, and 120 K. The dashed line denotes the reference field for 209Bi at 45.7 MHz.
In summary, three Bi2Se3 single crystals synthesized by three different methods were characterized by 209Bi NMR. The spectra show intensity anomalies due to the short T
2 effect. The 209Bi NMR signal is entirely from the bulk states, with no detectable contribution from the topological surface state. The NMR linewidth suggests that the structural defect level is different in these differently grown crystals. The Se-rich self-flux growth produces the highest quality single crystal, while the chemical vapor transport and traveling solvent zone growth produce samples of similar, but reduced quality. As Se vacancies necessarily introduce n-type charge carries in Bi2Se3, we identify their different concentration as the most probable cause of the observed electronic differences in the 209Bi NMR frequency shift and 1/T1. The magnetism inBi2Se3 is diamagnetic, but with a weak temperature dependence at low temperature, caused by the slight temperature-dependent Pauli paramagnetism. This work is published in Phys. Rev. B 86, 075137 (2012).
References
1. H. Scherrer and S. Scherrer, in Handbook of Thermoelectrics, edited by D.M. Rowe (CRC Press, New York, 1994), pp. 211–237.
2. Y. Xia, D. Qian, D. Hsieh, L. Wray, A. Pal, H. Lin, A. Bansil, D. Grauer, Y. S. Hor, R. J. Cava, and M. Z. Hasan, Nat. Phys. 5, 398 (2009).
3. Y. L. Chen, J. G. Analytis, J.-H. Chu, Z. K. Liu, S.-K. Mo, X. L. Qi, H. J. Zhang, D. H. Lu, X. Dai, Z. Fang, S. C. Zhang, I. R. Fisher, Z. Hussain, and Z.-X. Shen, Science 325, 178 (2009).
4. D. Hsieh, Y. Xia, D. Qian, L. Wray, J. H. Dil, F. Meier, J. Osterwalder, L. Patthey, J. G. Checkelsky, N. P. Ong, A. V. Fedorov, H. Lin, A. Bansil, D. Grauer, Y. S. Hor, R. J. Cava, and M. Z. Hasan, Nature (London) 460, 1101 (2009).
5. X.-L. Qi, R. Li, J. Zang, and S.-C. Zhang, Science 323, 1184 (2009). 6. L. Fu and C. L. Kane, Phys. Rev. Lett. 100, 096407 (2008).
7. X.-L. Qi, T. L. Hughes, and S.-C. Zhang, Phys. Rev. B 78, 195424 (2008). 8. R.W. G.Wyckoff, Crystal Structures (Krieger,Malabar, FL, 1986).
9. A. Abragam, The Principles of Nuclear Magnetism (Oxford University Press, Oxford, 1996). 10. B. F. Williams and R. R. Hewitt, Phys. Rev. 146, 286 (1966).
11. H. Hamaed, M. W. Laschuk, V. V. Terskikh, and R. W. Schurko, J. Am. Chem. Soc. 131, 8271 (2009). 12. H. Abe, H. Yasuoka, and A. Hirai, J. Phys. Soc. Jpn. 21, 77 (1966).
13. G. Miller and C.-Y. Li, J. Phys. Chem. Solids 26, 173 (1965).
14. G. Hyde, H. Beale, I. Spain, and J.Woollam, J. Phys. Chem. Solids 35, 1719 (1974). 15. C. P. Slichter, Principles of Magnetic Resonance (Springer, New York, 1996). 16. G. C. Carter, L. H. Bennett, and D. J. Kahan, Prog. Mater. Sci. 20, 1 (1977). 17. P. Janíček et al., Physica B 403, 3553 (2008).
18. F. Bridges and W. G. Clark, Phys. Rev. 164, 288 (1967).
19. G. E. Shoemake, J. A. Rayne, and R.W. Ure, Phys. Rev. 185, 1046 (1969).
20. V. A. Kul’bachinskii, A. Y. Kaminskii, K. Kindo, Y. Narumi, K. Suga, P. Lostak, and P. Svanda, JETP Lett. 73, 352 (2001).
21. Z.-H. Pan, E. Vescovo, A. V. Fedorov, D. Gardner, Y. S. Lee, S. Chu, G. D. Gu, and T. Valla, Phys. Rev. Lett. 106, 257004 (2011).
IV. Superconductivity in Pt micro powder
Some metallic elements, such as Cu, Ag, Au, and Pt, in the periodic table are not superconducting down to the lowest available temperature. It has been long suspected that magnetic impurities suppress a possible superconducting transition in those metals. Surprisingly, superconductivity was eventually found in Pt micro powder, instead of in bulk Pt.1 Its superconducting transition temperature (Tc) is dependent on the compression of the power, and the highest Tc is 1.38 mK. According to Ref. 1, the lattice softening due to the large of surface to volume ratio of the compact powder is considered to be the mechanism for the superconductivity in the Pt micro powder, as for the granular superconductors.3 Pt is known to have a strong electron-electron exchange interaction, so that it has a Stoner-enhanced Pauli susceptibility, and is close to a ferromagnetic instability. We were motivated to investigate whether the magnetic instability is modified in the micro particles or not, and whether the magnetism of the Pt 3d electrons plays a role in the Cooper pairing.
Figure 1 SEM images for the Pt micro powder with the packing fraction (a) 0.05 and (b) 0.74
-0.06 -0.04 -0.02 0.00 Pt shot 50kG, 4.2K 36 kG, 4.2 K, f = 0.065 50 kG, 4.2 K, f = 0.065 50 kG, 6 K, f = 0.065 50 kG, 4.2 K, f = 0.05 50 kG, 4.2 K, f = 0.166 50 kG, 4.2 K, f = 0.307 50 kG, 4.2 K, f = 0.605 50 kG, 4.2 K, f = 0.56 50 kG, 4.2 K, f = 0.74 Inten sity ( arb. units) Frequency shift (%) 195 Pt
We performed NMR experiments on a Pt shot and Pt micro powder which were purchased from Alfa Aesar. The average particle size is ~ 2um. We prepared several different compact Pt powders for the packing fraction ranging from 0.05 to 0.74. Figure 1 shows the SEM images for the Pt micro powder with the packing fraction 0.05 and 0.74. The Pt micro particles form granular structure at a high packing fraction. Figure 2 shows the NMR spectra for the Pt shot and the different packing fractions of the Pt powder. The Pt shot has a narrow peak, and surprisingly, all the powders have a similar spectrum. The broad line is due to the distribution of the particle size. The packing-fraction independent spectrum suggests that the particle bulk states remain intact, even though the particles are closely contact.
0 5 10 15 20 25 30 0.00 0.02 0.04 0.06 0.08 43 44 45 46 In te ns ity ( ar b. u ni ts ) f (MHz) 43.9 MHz 44.0 MHz 44.2 MHz 44.4 MHz 44.6 MHz 44.8 MHz 45.0 MHz 43.9 MHz, shot 1/ (TT 1 ) (ms 1 ) T (K)
Figure 3 Temperature scans of 1/T1 at different parts (frequencies) of the powder spectrum.
We also measured the nuclear spin-lattice relaxation rate 1/T1 as a function of temperature at the different parts (frequencies) of the broad spectrum, which is shown in Fig. 3. We found that the Korringa relation
1/(T1T) is observed for every part of the spectrum except that the value gradually decreases from the central
peak at 43.9 MHz to the tail at 45 MHz. This suggests that the Pt 3d electrons in the bulk states of the micro powder are in a non-magnetic Fermi liquid state, and the magnetic fluctuation is not enhanced. Since the bulk states are nearly unchanged for the different compact powders of different Tc, we think that the superconductivity should arise from the surface states. The surface phonon effect probably is the key to the Cooper pairing in the micro Pt powder. The manuscript for this work is in preparation.
References
1. R. König et al., Phys. Rev. Lett. 82, 4528 (1999).
2. T. Herrmannsdörfer et al., J. Low Temp. Phys. 104, 49 (1996). 3. B. Abeles, Appl. Solid State Sci. 6, 64 (1976).