Case Study on Economic Evaluation of Gasification Investment Using Bamboo Processing Residue
in Zhushan Area, Taiwan
Chyi-Rong Chiou,1) Song-Ling Wang,1) Sheng-Jie Yao,2) Dai-Rong Lee,2) Yu-Jen Lin2,3)
【Summary】
Taiwan is a country highly dependent on imported energy, but it possesses abundant bamboo residue resources; therefore, it is important and necessary to make the best use of those resources to develop technologies to convert residues into biomass energy. The purpose of this study was to evalu- ate the costs and benefits of two investment plans for an updraft gasification power generation system using bamboo residues in the Zhushan area, Nantou County, central Taiwan. According to the annual amount of bamboo residue from an individual bamboo processing company and from most bamboo processing industries in the Zhushan region, this study investigated 2 investment plans of gasification power generation: a single plant and a regional plant. The evaluation results showed that the single- plant investment plan, with an operating time of 1,000 h yr-1, power generation of 80,000 kWh yr-1, and bamboo residue consumption of 300 tons yr-1, could create an operating benefit of around NT$1,354,000 yr-1 (the exchange rate in 2019 was US$1≈New Taiwan (NT)$31.09), but the operation still exhibited a financial loss after deducting necessary costs. The net present value (NPV) calculated for an operation period of 15 yr was -NT$4,497,588 with an internal rate of return of -2.26% and a required payback period of more than 59 yr. The regional-plant investment plan, under an operating time 5600 h yr-1, power generation of 2,240,000 kWh yr-1, and bamboo residue consumption of 8,400 tons yr-1, created an operating benefit of around NT$35,482,000 yr-1. The NPV of this investment plan calculated over 15 yr was NT$107,663,898 with an internal rate of return of 26.54%, and only 5 yr was required to recover the initial investment costs. In comparison, the regional-plant investment plan of gasification power generation would be a more-feasible and better choice for investors because of larger-scale advantages and relatively greater profits.
Key words: bamboo residue, biomass energy, gasification power generation, cost-benefit analysis.
Chiou CR, Ang SL Yao SJ, Lee DR, Lin YJ. 2020. Case study on economic evaluation of gasifica- tion investment using bamboo processing residue in Zhushan area, Taiwan. Taiwan J For Sci 35(1):13-35.
1) Department of Forestry and Resource Conservation, National Taiwan University, 1 Roosevelt Rd, Section 4, Taipei 10617, Taiwan. 國立台灣大學森林環境暨資源學系,10617台北市大安區羅斯福路4 段1號。
2) Forest Utilization Division, Taiwan Forestry Research Institute, 53 Nanhai Rd., Taipei 10066, Taiwa. 林業試驗所森林利用組,10066台北市南海路53號。
3) Corresponding author, e-mail:[email protected] 通訊作者。
Received October 2019, Accepted April 2020. 2019年10月送審 2020年4月通過。
研究報告
竹加工剩餘資材氣化發電投資計畫之效益研究
—以南投竹山地區為例
邱祈榮1) 汪松齡1) 姚聖潔2) 李岱蓉2) 林裕仁2,3)
摘 要
如今台灣既高度仰賴進口能源,境內竹剩餘資材量又大,故有研發且應用轉換廢棄物為再生能源 技術之必要性。本研究目的在於評估上吸式氣化發電系統,以竹山地區竹剩餘資材為原料的投資計畫 之成本與效益。本研究依據該地區某竹製品公司和全竹山地區每年的剩餘資材量設置「單廠型氣化發 電投資計畫」和「區域型氣化發電投資計畫」。以單廠型氣化發電規模而言,每年設備穩定運轉1,000 小時,可發80,000度電,剩餘資材年消耗量為300噸。每年可創造135萬餘元的營業收入,扣除建設成 本、營運費用和其他雜費,其每年營運狀況呈虧損局面。營運期假設15年,其淨現值為-449萬餘元,
內部報酬率為-2.26%,需要長達59年以上才能由虧轉盈。區域型氣化發電投資計畫,每年設備運轉 5,600小時,可發224萬度電剩餘資材年消耗量為8,400噸,每年主副產品銷售收入達3,548萬餘元。15年 內的淨現值高達1.07億元,內部報酬率為26.54%,只需要5年就可回收期初投資成本。相較之下,區域 型竹剩餘資材氣化發電投資計畫因規模較大,盈利空間也相對多,所以是良好的選擇。
關鍵詞:竹剩餘資材、生質能源、氣化發電、成本效益分析。
邱祈榮、汪松齡、姚聖潔、李岱蓉、林裕仁。2020。竹加工剩餘資材氣化發電投資計畫之效益研究—
以南投竹山地區為例。台灣林業科學35(1):13-35。
INTRODUCTION
Energy is an indispensable necessity for humans to pursue social and economic de- velopment. However, people are over-reliant on traditional fuels such as oil and coal due to their convenient supply. At the same time, people often neglect concerns about envi- ronmental damage, excessive consumption of resources, and huge amounts of wastes created, all of which have gradually emerged from excessive emissions of carbon dioxide, methane, nitrous oxide, and other greenhouse gases, which have caused global warming to become more serious. The energy and indus- trial sectors are the main sources of carbon dioxide contributed by various sectors. In view of this, countries are committed to de- veloping a sustainable development model to
balance economic development with environ- mental protection and social justice. Concepts of waste minimization, 4R (reduction, reuse, regeneration and recycle) (Chang 2004), cradle-to-cradle (McDonough and Braungart 2010), sustainable material management (OECD 2010), and the circular economy (Ellen MacArthur Foundation 2013) have sprung up; at the same time, they are also be- ing highly valued by the public. It is hoped that limited resources can be properly utilized without jeopardizing the interests of future generations, and the waste generated can be reused for other purposes as much as possible to improve the efficiency of material use. In this context, countries are actively develop- ing clean energy strategies to resolve energy
shortages and environmental problems. Re- newable energy sources such as solar, wind, hydroelectric, biomass, and waste energy (hereafter referred to as biomass) were born.
Compared to other renewable energy sources, biomass energy or waste energy is renewable, rich in raw materials, highly economically efficient, able to supply energy and environ- mental protection, and can be operated on a small scale; thus, it has become a key energy plan in many countries (WBA 2017).
Taiwan’s geographical environment is unique and rich in resources, especially in forests and bamboo. According to the 4th Forest Resource Inventory by the Forestry Bureau, the total area of bamboo in Taiwan is 137,785 ha, accounting for about 6% of the total forest land area. Bamboo is a plant with high economic value, grows rapidly, and ma- tures early within 3~5 yr. Taiwan has a high demand for raw bamboo, and according to research by Lin et al. (2017a), the domestic demand for raw bamboo in 2014 was 90,058 tons, and the estimated waste from produc- tion processes was about 8997 tons, which is about 10% of the total demand for raw bam- boo. In addition to being used for crafts and the production of bamboo shoots in the early stage, Taiwanese bamboo is also used to pro- duce bamboo building materials, composite materials, bamboo charcoal, bamboo vinegar, and other products based on technological advancements in the later stage (Lin 2011).
With the direct use and processing of bam- boo materials, it is inevitable that different types of wastes are produced, such as bamboo powder and chips. In view of the fact that Taiwan consumes a large amount of bamboo materials every year, it is reasonable that the volume of bamboo residue cannot be ignored.
In recent years, in order to expand the bam- boo industry, people began to explore ways to fully utilize bamboo resources and promote
recycling technologies of bamboo residues to become increasingly mature. So far, tradi- tional methods of enterprises for dealing with bamboo residues include selling them to oth- ers, paying for transport, and giving them to manufacturers (Lin et al. 2017b). These treat- ments are not in line with the principles of environmental protection, and the economic benefits are relatively low. However, the pro- cessing of biomass fuels, chemical products, composite materials, and other agricultural products (Chen and Yeh 2017) is technically and economically feasible as a way to re- cycle.
Although the abovementioned methods for reusing bamboo residue have various advantages, energization is currently a great way to realize the development potential of re-use. Under pressure of limited oil re- sources and the continued rise in oil prices, energization can avoid damaging the environ- ment while also saving energy, maintaining the environment, and benefiting economics through major applications. Nowadays, many EU countries have chosen to crush, screen, and dry biomass wastes and then press it into pellets or ingot fuel. After being molded into shape, the pelletized fuel has a uniform size, small volume, and uniform heat value. It is easy to store, convenient to transport and manage, produces less soot when combusted, and can be directly used for various types of boilers. According to a statistical assess- ment, the global wood pellet consumption in 2010 was around 13.5×10⁶ tons, the future consumption demand for wood pellets could exceed 50×106 tons in 2025, and over 25%
of global wood pellets are consumed in the EU (Statista 2015)
In addition to advantageous wood pel- lets, gasification power generation is another technology to convert biomass into energy. It involves a chemical reaction of carbonaceous
materials with oxygen or water vapor at high temperature to produce synthetic gases, which are removed by a purification system and then sent to an engine for power generation.
Nowadays, Europe and the US are ahead of Taiwan in promoting this technology. In Eu- rope, countries such as Switzerland, Austria, and Germany all have developed biomass gasification power, which has mainly adopted woody biomass from forests and timber mills (Yamasaki 2005). In the US over the past 20 yr, over 50 companies have sprung up to provide gasification facilities to businesses.
The majority of gasification facilities power small commercial buildings or manufactur- ing plants (Whitty et al. 2015). Gasification power generation is feasible for regional en- ergy, and its development not only can solve the current problem of waste disposal, but also increases the added value of resources; at the same time it also can provide society with cleaner energy, so the potential for industrial applications is enormous. If the application of biomass or waste gasification for power gen- eration can be more widely promoted, then environmental problems can be ameliorated and the dependence on traditional fuels can be reduced. It will be beneficial to Taiwan to establish a sustainable society. Therefore, Taiwanese can cooperate with each other and actively develop this technology through poli- cies, society, laws, technology, and economics so that “sustainable social development” is no longer an impossible goal.
Since the 1990s, research focusing on these technologies or beneficial evaluations of biomass gasification power generation has increased year by year (Kirkels and Verbong 2011). Europe, the US, Japan, and China are leaders of related studies, and now those stud- ies can be used as basic references for invest- ment research and development for manu- facturers, and can also provide references for
governments to support related industries and develop policies.
The environmental benefits of gasifica- tion of biomass or waste power generation include impacts on human health, ecosystem quality, climate change, and resource con- sumption (Fernández et al. 2017). According to a study in Taiwan by Ho (2001) of annual rice husk production for simulated gasifica- tion power generation, the annual gasification of about 290,000 tons of rice husks could produce 65´106 kWh of electricity and reduce carbon dioxide emissions by 54,813 tons.
Sinha et al. (2010) analyzed the economic feasibility of developing a gasification power generation system with abandoned bamboo powder in Assam, India. Results showed that the gasification power generation sys- tem could reduce costs and also could save 1100´106 tons of coal yr-1 in Assam, effec- tively reducing greenhouse gas emissions.
Gasification power generation technol- ogy has many advantages which cannot be neglected, such as flexibility of raw materi- als, product diversity, and contributions to emission reductions. To solve problems of waste dumping and sanitation, to save trans- portation costs on waste delivery, to reduce electricity from outside sourcing, and to ob- tain extra profits from byproducts, this study attempted to set up 2 operation gasification power generation types: one for a single com- pany and the other for regional utilization using annual bamboo residues in the Zhushan area of central Taiwan. In addition, to avoid excessive particle sizes of residues which can cause burst problems due to the porous struc- ture of the gasification process and promote process efficiency, surplus bamboo materials like bamboo chips and bamboo powder from factories need to be crushed 2 or 3 times to match the gasification conditions of a particle size range of 0.3~1.0 cm. The gasifier used in
this study was an updraft type that can accept raw materials with a large particle size and high ash content (up to 15%); it is relatively easy to operate and has lower construction costs (Chopra and Jain 2007). Materials with small particle sizes were sent to the gasifier for gasification after drying and crushing, and most of the impurities were removed via a purification system. The tar, carbon, and con- densate were discharged, and finally synthetic gas was produced to send to an internal com- bustion generator to generate electricity.
This study proposes 2 investment plans based on the above mentioned 2 gasification power generation scenarios for bamboo resi- dues, and analyzed their economic feasibility and the possibility of promoting industrial development through a cost-benefit analysis.
Then, a follow-up decision analysis was con- ducted for decision-makers to evaluate the most appropriate plan for future development and promotion of gasification power genera- tion in the Zhushan area.
MATERIALS AND METHODS Study case background
The study case was conducted in Zhushan Township, Nantou County, where the main product is processed semi-finished bamboo swords and other accessories using Makino bamboo (Phyllostachys makinoi) and Moso bamboo (P. pubescens). All products are sold to China, Japan, Europe, and the US.
Up to now, the bamboo residue from process- ing was sent to boilers built in the factory to burn for heat energy for the process of bam- boo boiling and washing. This factory also leased free space to other small factories for the processing and manufacturing of bam- boo chopsticks, bamboo sticks, and related agricultural bamboo products. Most of the bamboo residue is in the form of chips, fila-
ments, knots, tails, and so on. According to the actual investigation, the total amount of bamboo residue produced by this factory and the related processing factories is around 300 tons yr-1, which is equivalent to around 25 tons mon-1 of bamboo residue.
In addition, according to an investigation of raw material production and waste disposal conducted by the Forestry Research Institute in the Zhushan area in 2014, the total demand for bamboo materials for the bamboo pro- cessing industry in 2014 was around 37,000 tons, and the amount of bamboo residue was 8,395 tons, with an estimated residue amount of around 700 tons mon-1. The main types of residues are bamboo chips and filaments at 33 and 30%, respectively, and the rest consists of bamboo heads (16%), nodes (15%), tails (4%), branches (1%), and tubes (1%).
Therefore, this study analyzed the eco- nomic benefits of 2 investment plans for gasification power generation based on the amount of bamboo residue: one was a single factory type using 300 tons yr-1, and the other was a regional type using 8400 tons yr-1.
Note that all monetary figures in this paper are given in New Taiwan (NT) dollars, and the average exchange rate in 2019 was US$1.00≈NT$31.09.
Analysis methods
This study used a cost-benefit analysis (CBA) to evaluate expenditures and benefits of the 2 investment plans at different time points, and then selected the more-suitable or more- profitable investment plan based on various criteria. Furthermore, different gasification power generation investments were discussed using a break-even analysis (BEA), so that in- vestors could learn how much waste materials need to be purchased each year for gasification power generation to reach a balance of profit and loss for an investment, as this is important
reference information for investors.
Since any investment plan has many po- tential risks and uncertainties, decision-makers seeking to avoid wrong decisions must analyze risks caused by any uncertainties or change the investment plan. Thus, this study used a sensitivity analysis to determine related sensi- tive factors to the investment plan of bamboo residues for gasification power generation, and then made reasonable assumptions when applying a scenario analysis to estimate fu- ture business conditions. Predicting different development situations is also very significant information for decision-makers formulating an investment plan.
A. Cost-benefit analysis (CBA)
CBA is a tool to estimate strengths and weaknesses of alternatives used and compare completed or potential courses of actions, or to estimate the value against the cost of a decision, project, or policy. It is commonly used in commercial transactions, business and policy decisions, and project investments.
The following four evaluation indicators were used for the CBA in this study (Boardman 2006, European Commission 2008).
1. Net present value (NPV)
The NPV is the sum of the present value of all investment benefit discounts of all in- vestment periods deducted from the discount- ed investment capital (net benefit). When the NPV is positive, the investment will bring in more value to the enterprise; executives can also choose the highest net present value from multiple plans to invest in.
...(1) where Bt is income for period t, Ct is expendi- ture of period t, r is the discount rate, and t is time.
2. Benefit-cost ratio (BCR)
The BCR represents the ratio of the total present value of all benefits divided by the total present value of costs. When the BCR is
> 1, it means the overall benefit of the plan is greater than the cost; that is, this plan is worthy of investment. If there are different plans, the decision-maker can choose the one with the highest ratio of benefits.
...(2) where Bt is the income for period t, Ct is the expenditure of period t, r is the discount rate, and t is time, as in formula (1) above.
3. Internal rate of return (IRR)
The IRR is the discount rate leading the net present value to 0, which means that the IRR is equal to the interest rate when the pres- ent value of the investment cost reaches the present value of the expected benefit. Decision- makers can decide on the priority of invest- ment plans usually based on the IRR from high to low.
... (3) where Bt is the income for period t, Ct is the expenditure of period t, r is the internal rate of return, and t is time.
4. Payback Period (PP)
The PP refers to the period of time for the investment cost to be returned in years.
Decision-makers can choose the period they plan after comparing the PPs of different plans.
... (4) where Bt is the income for period t, Ct is the expenditure of period t, r is the discount rate, and t is the return period.
B. Decision analysis
1. Break-even analysis (BEA)
The BEA is an important way for com- panies to manage and develop business. It not only can show the importance of fixed costs and variable costs, how product sales affect costs and income, and how product price fluc- tuations cause changes, but also explains how scale expansion will affect costs, income, etc..
Thus, it is used as a basis for investors to con- trol production volumes, costs, and the sale price to avoid losses.
The common analytical methods of break-even include the equation method, contribution margin method, and graphical method. This study used the equation method to determine the smallest-scale investment with zero net profit of the investment plan;
however, the diverse products in this study (electricity, biochar, and vinegar) had differ- ent production ratios, so only the following formula was used (Schweitzer et al. 1991):
Total revenue - total cost = net operating profit = 0 ... (5) 2. Sensitivity analysis
Sensitivity analyses are mainly divided into single-factor and multifactor sensitivity analyses. The analytical principles are the same, but the premise of the multifactor sen- sitivity analysis is that multiple factors that change at the same time are independent of each other, and the probability of fluctuating with each other is the same. Decision-makers can identify the most sensitive factors that may affect economic performance indica- tors and assess the scope of the changes they cause. At the same time, it can further analyze the causes of fluctuations and then adjust and avoid risks in a timely manner. On the other hand, it can also compare the sensitivity of many programs and choose the least sensitive
and safest investment case (Saltelli 2000).
When the NPV of an investment plan dramat- ically changes due to changes in some factors, that investment plan could pose a huge risk, and contrarily, it might represent investment cases that are trustworthy.
3. Scenario analysis
Scenario analysis is a process of analyz- ing future events by considering alternative possible outcomes (Aaker 2001). In this study, it refers to a method of analyzing impacts of multiple factors on the NPVs of investment plans when they change simul- taneously. An early application was mainly used to evaluate overall macro-economic or political factors.
C. Operational parameters
1. Output efficiency of gasification power generation
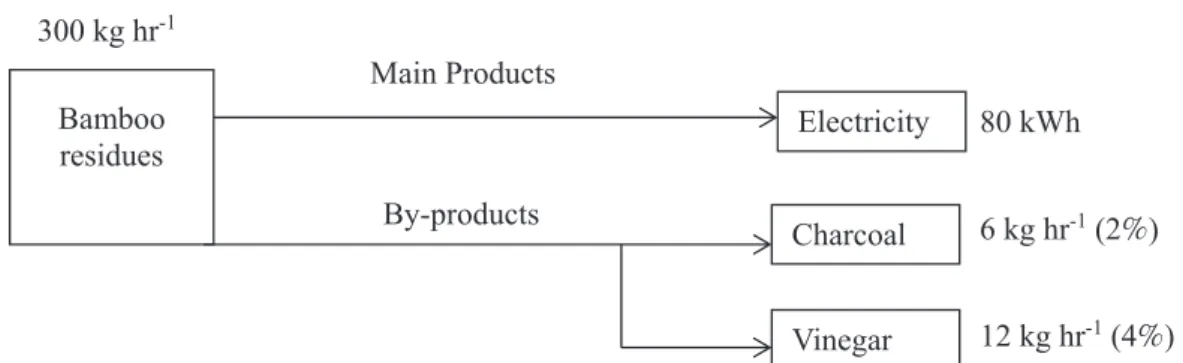
This study used an improved updraft gasifier which controlled the gasification tem- perature within a range of 900~1,200℃, and based on the equipment design efficiency, the speed at which bamboo residues were fed to the unit was set to around 300 kg h-1 to pro- duce 100 kWh of electricity. However, con- sidering that bamboo residues have high cel- lulose contents, the calorific value is similar to that of wood, and some energy will be lost when the synthetic gas is converted into elec- tricity, so the actual power generator produc- tion was set to 80 kWh. In addition, byprod- uct (charcoal and vinegar) output during the gasification process will increase or decrease with changes in the gasification temperature, air flow rate, fuel, air equivalent ratio, and raw material moisture content. Therefore, this study set charcoal and vinegar production rates to 2 and 4% of the raw material, respec- tively (Fig. 1).
2. Operational plan for gasification power generation
The operational plan was based on actual visits and results of a questionnaire survey conducted by the Forestry Research Institute in 2014, and refers to the design of gasifi- cation power generation equipment in the Taiwanese market. The plan for gasification power generation was divided into a single- plant type (with a throughput of 300 tons yr-1) and a regional type (with a throughput of 8,400 tons yr-1), and other related operational data are described in Table 1. In addition, relevant evaluation parameters for the invest-
ment plans were modified from a study by Arena et al. (2015), which was a cost-benefit evaluation for an investment plan for a small- scale gasification power generation system established for solid recovered fuel (Table 2).
3. Costs and benefits of the gasification power generation investment plans
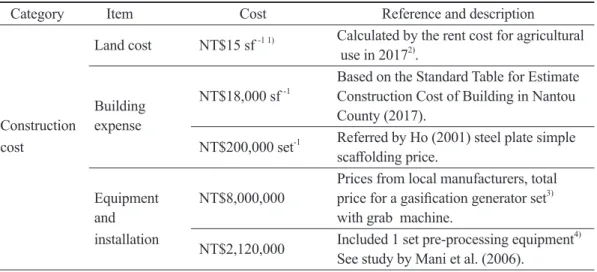
Table 3 shows the construction costs, operational expenses, and other costs for this study, with quotations calculated based on governmental regulations and market prices provided by related factories. Among them, maintenance costs, power costs, and cost of 300 kg hr-1
Main Products
By-products Bamboo
residues Electricity
Vinegar Charcoal
80 kWh
6 kg hr-1 (2%)
12 kg hr-1 (4%) Fig. 1. Schematic diagram of the output of the gasification power generation.
Table 1. Operation plans for 2 investment scenarios
Item Single plant Regional plant
Pre-processing equipment (no. of sets) 1 1
Gasification power generation (no. of sets) 1 5
Operators1) (workers yr-1) 1 9
Operating hours2) (h yr-1) 1,000 5,600
Consumption of raw materials (tons yr-1) 300 8,400
Net power generation3) (kWh yr-1) 80,000 2,240,000
1) The regional-plant equipment is based on a 24-h operation system, and 3 shifts are needed, includ- ing vacation.
2) The operating hours are the amount of raw materials divided by (300 kg h-1×the number of gasifi- cation power generation equipment groups); the operating hours are the time that the equipment can be operated, deducting the time for inspection and maintenance when shut down, and the time of switching and warming up machines; the running rate is about 90%.
3) The net power generation is the operating hours×the amount of gasification power generation×80 kWh h-1; the annual net power generation is the annual amount of electricity remaining after deduct- ing the amount of electricity supplying other equipment in the plant.
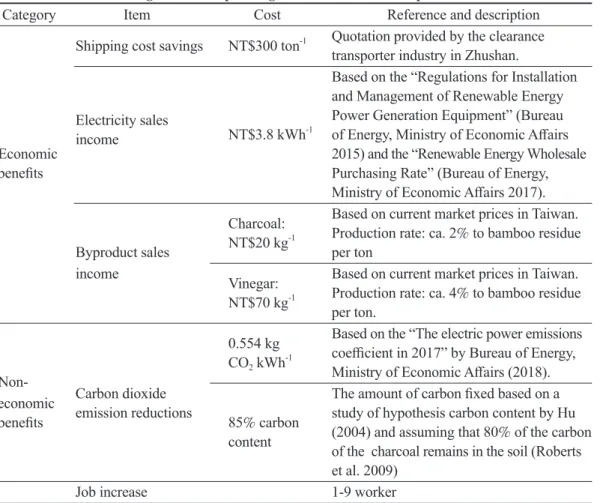
sales were calculated in accordance with co- efficients derived from historical experience and related references. Table 4 shows poten- tial economic benefits and non-economic ben- efits from the investment plan, which were based on related market prices, public regula- tions, and references.
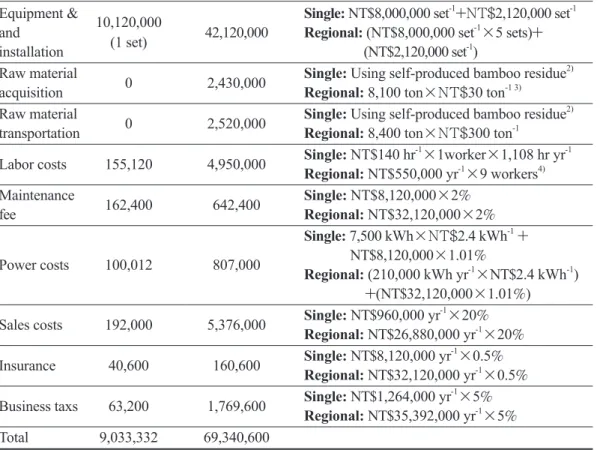
Based on abovementioned costs and potential benefits, annual cost estimations and annual benefit estimations for 2 types of plants (single-plant and regional-plant) of gasification power generation were calculated in Tables 5 and 6, respectively.
RESULTS
A. Cost-benefit analysis
1. Cost and benefit comparisons of invest- ment plans of the 2 types of plants
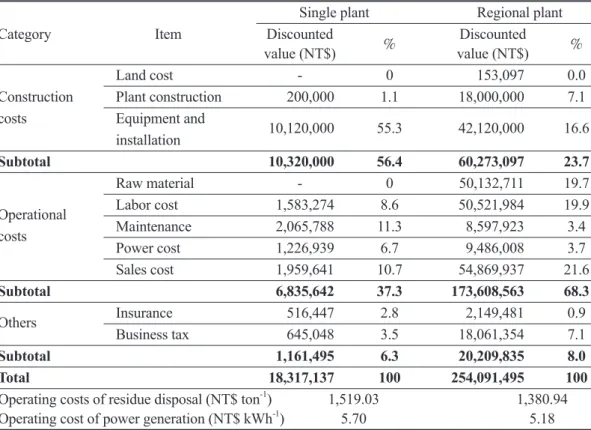
Table 7 shows comparisons of cost esti- mations for investment plans of the 2 types of plants within a discount period of 15 yr with a discount rate of 5.25%. Results show that for single-plant gasification power genera- tion, the construction cost was the highest proportion at 56.4% (NT$10,320,000), and
Table 2. Operational parameters of gasification power generation
Item Parameter value Reference and description
Evaluated period 15 yr Based on Arena et al.’s (2015) operating schedule Evaluated basis From January The phase 0 is the establishment and operation
of the first year test
Equipment lifetime 15 yr Based on Arena et al.’s (2015) operational period
of regular maintenance equipment
Based on the parameters for “Renewable Energy
Discount rate 5.25% Power Purchasing Rate 2018” (Energy Bureau,
the Ministry of Economic Affairs, 2017)
Based on the minimum tax rate in the Value-Added
Business tax 5% and Non-Value-Added Business Tax Law (National
Tax Administration, Ministry of Finance, 2017)
Table 3. Cost of the gasification power generation investment plan
Category Item Cost Reference and description
Land cost NT$15 sf-1 1) Calculated by the rent cost for agricultural
use in 20172).
Based on the Standard Table for Estimate
Building NT$18,000 sf-1 Construction Cost of Building in Nantou
Construction expense County (2017).
cost NT$200,000 set-1 Referred by Ho (2001) steel plate simple
scaffolding price.
Prices from local manufacturers, total
Equipment NT$8,000,000 price for a gasification generator set3)
and with grab machine.
installation NT$2,120,000 Included 1 set pre-processing equipment4)
See study by Mani et al. (2006).
con’t
Raw material NT$300 ton-1
purchasing Quotations provided by clearance operators
Raw material NT$300 ton-1 in Zhushan.
transportation
NT$140 h-1 Following the hourly minimum wage
Labor cost system of the Ministry of Labor (2018).
NT$550,000 yr-1 Based on the annual salary of a technician
or operator5).
Maintenance 2% of equipment According to the research setting of Chang
Operational cost (2003) and Lee (2010).
expenses 1.01% of building According to Fernández et al. (2015) to
cost set the annual cost of water and other
consumables.
Power cost According to Sultana et al. (2010) to
estimate power consumption 50 kWh h-1
NT$2.4 kWh-1 for 2 tons by a pre-calculation of processing
equipment and the average circulating
electricity bill for low-voltage power by
Taipower Co.
20% of byproduc Referring to data of foreign development, Cost of sales income including packaging, transportation,
advertising, and other expenses.
Insurance 0.5% of Referring to gasification power generation construction Cost experience by Arena et al. (2015).
Others According to the Value-Added and
Business Tax 5% of products Non-Value-Added Business Tax Law
announcement in 2017.
1) 1 sf means 1 Taiwanese square footage = 3.30579 m2.
2) The rent for agricultural use calculated on an average basis based on the land renting website and the Nantou County rent price of the young farmers’ counseling platform 2017.
3) Including the gasifier body, turbine feeder, condensation tower, purifier, separator, circulating water pump, pipeline, internal combustion engine, transformer, etc.
4) A set of pre-processing equipment containing a crusher and conveying trough equipment.
5) The annual salary was based on Ho (2001), the “statistical report on the number of employees and average salary” from the open platform of government information and statistics of 104 Human Resources Banks..
the operational cost was second-highest at 37.3% (NT$6,835,642). For the regional- plant, the operational cost was the highest proportion at 68.3% (NT$173,608,563), and the construction cost was relatively lower at
23.7% (NT$60,273,097). Other costs for the single plant and regional plant were 6.3%
and 8.0%, respectively. Among individual cost items, the highest proportions were the cost of equipment and installation at 55.3%
Table 5. Cost estimation for 2 types of gasification power generation plants
Items Annual amount (NT$ yr-1) Description
Single-plant Regional-plant
Single: The equipment was set up next to the
Land cost 0 15,000 existing factory, without extra cost
Regional: 1,000 sf-1 1)×NT$15 sf-1 yr-1
Plant 200,000 Single: Based on current market unit price of construction (1 set) 18,000,000 plant construction (Ho, 2001)
Regional: 1,000 sf-1×NT$18,000 sf-1
Table 4.Benefits of the gasification power generation investment plan
Category Item Cost Reference and description
Shipping cost savings NT$300 ton-1 Quotation provided by the clearance
transporter industry in Zhushan.
Based on the “Regulations for Installation
and Management of Renewable Energy
Electricity sales Power Generation Equipment” (Bureau income NT$3.8 kWh-1 of Energy, Ministry of Economic Affairs
Economic 2015) and the “Renewable Energy Wholesale
benefits Purchasing Rate” (Bureau of Energy,
Ministry of Economic Affairs 2017).
Charcoal: Based on current market prices in Taiwan.
NT$20 kg-1 Production rate: ca. 2% to bamboo residue
Byproduct sales per ton
income Vinegar: Based on current market prices in Taiwan.
NT$70 kg-1 Production rate: ca. 4% to bamboo residue
per ton.
0.554 kg Based on the “The electric power emissions
CO2 kWh-1 coefficient in 2017” by Bureau of Energy,
Non- Ministry of Economic Affairs (2018).
economic Carbon dioxide The amount of carbon fixed based on a benefits emission reductions 85% carbon study of hypothesis carbon content by Hu
content (2004) and assuming that 80% of the carbon
of the charcoal remains in the soil (Roberts
et al. 2009)
Job increase 1-9 worker
(NT$10,120,000) for the single plant and sales cost at 21.6% (NT$54,869,937) for the regional plant. The labor cost at 19.9%
(NT$50,521,984) and the cost for raw ma- terials at 19.7% (NT$50,132,711) were both similarly the second highest for the regional
plant. Obviously, the investment plan for the regional plant needed more capital at ca.
13.87 times that for the single plant. How- ever, the operating cost of residue disposal for the regional plant was relatively lower at NT$1,380.94 ton-1 compared to the single
con’t
Equipment & 10,120,000 Single: NT$8,000,000 set-1+NT$2,120,000 set-1 and (1 set) 42,120,000 Regional: (NT$8,000,000 set-1×5 sets)+
installation (NT$2,120,000 set-1)
Raw material 0 2,430,000 Single: Using self-produced bamboo residue2)
acquisition Regional: 8,100 ton×NT$30 ton-1 3)
Raw material 0 2,520,000 Single: Using self-produced bamboo residue2)
transportation Regional: 8,400 ton×NT$300 ton-1
Labor costs 155,120 4,950,000 Single: NT$140 hr-1×1worker×1,108 hr yr-1
Regional: NT$550,000 yr-1×9 workers4)
Maintenance 162,400 642,400 Single: NT$8,120,000×2%
fee Regional: NT$32,120,000×2%
Single: 7,500 kWh×NT$2.4 kWh-1 +
Power costs 100,012 807,000 NT$8,120,000×1.01%
Regional: (210,000 kWh yr-1×NT$2.4 kWh-1)
+(NT$32,120,000×1.01%)
Sales costs 192,000 5,376,000 Single: NT$960,000 yr-1×20%
Regional: NT$26,880,000 yr-1×20%
Insurance 40,600 160,600 Single: NT$8,120,000 yr-1×0.5%
Regional: NT$32,120,000 yr-1×0.5%
Business taxs 63,200 1,769,600 Single: NT$1,264,000 yr-1×5%
Regional: NT$35,392,000 yr-1×5%
Total 9,033,332 69,340,600
1) 1 sf means 1 Taiwanese square footage = 3.30579 m2.
2) The source of bamboo residue is produced by the case factory, so there are no extra costs to obtain raw materials.
3) In addition to our own residues of 300 tons yr-1, 8,100 tons of raw materials need to be purchased outside.
4) This plan requires 24-h operation for equipment, so it needs 3 shifts including vacations.
Table 6. Benefit estimation for 2 types of gasification power generation plants
Items Annual amount (NT$ yr-1) Description
Single-plant Regional-plant
Save on shipping 90,000 90,000 Single: 300 ton×NT$300 ton-1
Regional: 300 ton×NT$300 ton-1
Electricity sales 304,000 8,512,000 Single: 80,000 kWh×NT$3.8 kWh-1 1)
Regional: 2,240,000 kWh×NT$3.8 kWh-1
Charcoal sales 120,000 3,360,000 Single: 300 ton×0.02×(NT$20 kg-1)
Regional: 8,400 ton×0.02×(NT$20 kg-1)
Vinegar sales 840,000 23,520, 000 Single: 300 ton×0.04×(NT$70 L-1)
Regional: 8,400 ton×0.04×(NT$70 L-1)
Total 1,354,000 35,482,000
1) Wholesale purchase price per kWh of general waste renewable energy.
plant at NT$1,519.03 ton-1, and the operat- ing cost of power generation for the regional plant was also lower at NT$5.18 kWh-1 com- pared to the single plant at NT$5.70 kWh-1.
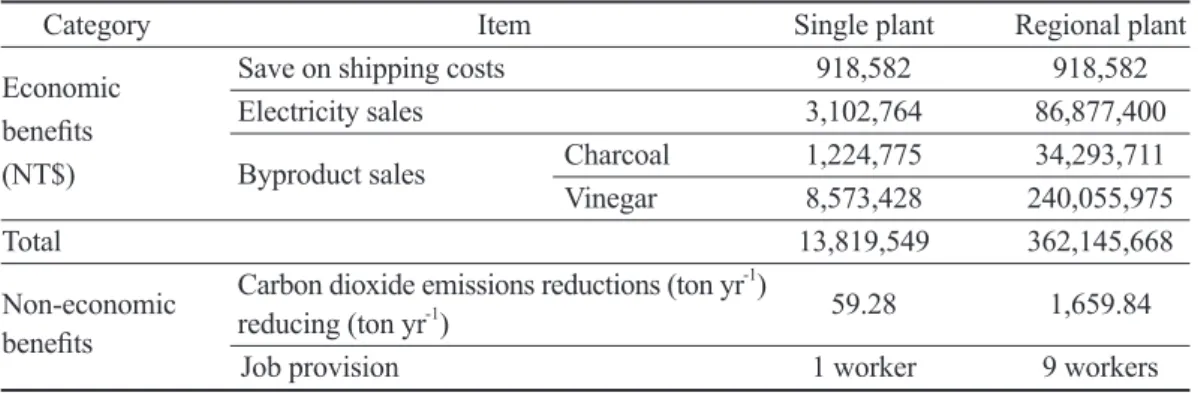
Table 8 shows comparisons of benefit estimations for investment plans of the 2 types of plants within the same period and the same discount rate as mentioned above for the cost estimation, and all earnings were added up through the discount rate to the ready-made NPV. The greatest economic benefits for both investment plans were not from electricity sales, which were estimated to be around NT$3,102,764 for the single plant and NT$86,877,400 for the regional plant, but from vinegar sales. The benefits of vinegar sales for the single plant and regional plant were estimated to be NT$8,573,428 and NT$240,055,975, respectively. Comparative-
ly, the investment plan for the regional plant could realize 28-fold economic benefits from only vinegar sales compared to the invest- ment plan for the single plant, and the overall economic benefit of the investment plan of the regional plant (at NT$362,145,668) was around 26.2-fold that of the single plant (at NT$13,819,549). Meanwhile, the investment plan for the regional plant could provide more non-economic benefits in terms of carbon dioxide emissions reduction of up to 1,659.84 tons yr-1 compared to around 59.28 tons yr-1 for the single-plant, and the plan could provide more job opportunities for up to 9 people.
The CBA results are shown in Table 9. The NPV for the investment plan of the single-plant with a 15 yr operating period was -NT$4,497,588, the CBR was 0.754, and the Table 7. Comparison of cost estimations for 2 types of plant investment planss
Single plant Regional plant
Category Item Discounted % Discounted %
value (NT$) value (NT$)
Land cost - 0 153,097 0.0
Construction Plant construction 200,000 1.1 18,000,000 7.1
costs Equipment and 10,120,000 55.3 42,120,000 16.6
installation
Subtotal 10,320,000 56.4 60,273,097 23.7
Raw material - 0 50,132,711 19.7
Operational Labor cost 1,583,274 8.6 50,521,984 19.9
costs Maintenance 2,065,788 11.3 8,597,923 3.4
Power cost 1,226,939 6.7 9,486,008 3.7
Sales cost 1,959,641 10.7 54,869,937 21.6
Subtotal 6,835,642 37.3 173,608,563 68.3
Others Insurance 516,447 2.8 2,149,481 0.9
Business tax 645,048 3.5 18,061,354 7.1
Subtotal 1,161,495 6.3 20,209,835 8.0
Total 18,317,137 100 254,091,495 100
Operating costs of residue disposal (NT$ ton-1) 1,519.03 1,380.94 Operating cost of power generation (NT$ kWh-1) 5.70 5.18
1) The total amount was discounted over a period of 15 yr, at a discount rate of 5.25%.
Table 8. Comparison of benefit estimations of 2 types of plant investment plans
Category Item Single plant Regional plant
Economic Save on shipping costs 918,582 918,582
benefits Electricity sales 3,102,764 86,877,400
(NT$) Byproduct sales Charcoal 1,224,775 34,293,711
Vinegar 8,573,428 240,055,975
Total 13,819,549 362,145,668
Non-economic Carbon dioxide emissions reductions (ton yr-1) 59.28 1,659.84 benefits reducing (ton yr-1)
Job provision 1 worker 9 workers
1) The total amount was discounted over a period of 15 yr, at a discount rate of 5.25%.
Table 9. The cost-benefit analysis indicators between the single-plant and regional-plant investment plans
Item Single plant Regional plant
Net present value (NT$) -4,497,588 107,663,898
Cost-benefit ratio 0.754 1.423
Internal rate of return (%) -2.26% 26.54%
Payback period (yr) 59 5
1) The total amount was discounted over a period of 15 yr, at a discount rate of 5.25%.
IRR was -2.26%. In addition, it would take 59 yr to recover the capital. Obviously, this long uncertainty indicates a high risk, which would not be a beneficial investment plan. Rela- tively, the NPV of the investment plan of the regional plant could reach NT$107,663,898, the CBR was 1.423, the IRR was 26.54%, and the payback period was 5 yr. Based on this cost-benefit analysis, the plan for the regional plant could be an economically feasible in- vestment.
2. Break-even analysis (BEA)
Based on the CBA results of the gasifica- tion power generation investment plans for the single plant and regional plant, gasifica- tion power generation operation using bam- boo residues would obviously produce eco- nomic benefits within 15 yr, the investment scale would need to exceed the single-plant investment plan, and the disposal capacity of bamboo residues could reach 300~8,400 tons
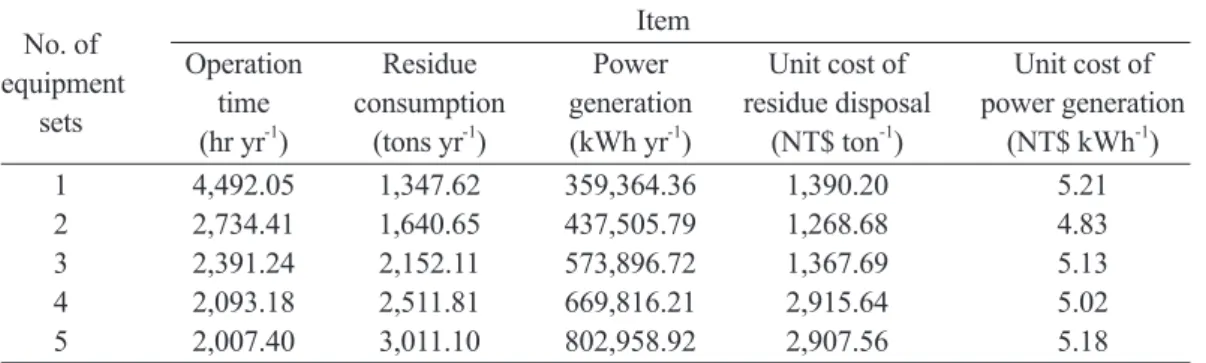
yr-1 in the Zhushan area. Therefore, this study simulated 5 investment plans in accordance with 5 sets of equipment (1~5 sets) and ana- lyzed their break-even points, particularly to determine the minimum amounts of bamboo residue to be supplied annually. This is impor- tant information as a reference for investors.
Results of the BEAs are shown in Table 10. The number of equipment sets was close- ly correlated with residue consumption and power generation. The disposal capacity of residue should be at least ca. 1,347 tons yr-1 and at least ca. 359,364 kWh yr-1 of electricity should be generated to achieve a break-even point when only 1 set of equipment is set up.
The status when 5 sets of equipment are set up were that the disposal capacity of residue should be at least ca. 3,011 tons yr-1 and the electricity generated would be ca. 802,958 kWh yr-1 to achieve the break-even point. Un- der this scenario, all of the bamboo residues in the Zhushan area would basically be a suf-
ficient amount to supply the investment plans.
B. Sensitivity analysis results
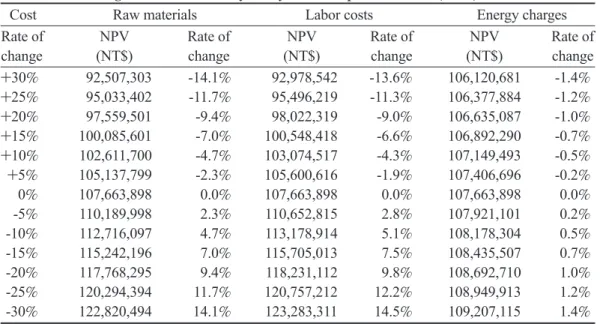
1. Cost single-factor sensitivity analysis This study analyzed the sensitivity of three single factors of raw material costs, la- bor costs, and electricity costs, and results are shown in Table 11. In comparison, the raw material cost had the highest sensitivity to the NPV. Once the cost of raw materials increased to 30% (from NT$600 to NT$780 ton-1), the NPV was reduced to NT$92,507,303, and the rate of change was -14.1%. Conversely, once the cost of raw materials decreased 30% (from NT$600 to NT$420 ton-1), the NPV increased to NT$122,820,494, with a rate of change of 14.1%. Labor costs were highly susceptible to inflation and financial market turmoil as well, and once the aver- age employee’s salary increased 30% (from NT$550,000 to NT$715,000 yr-1), the NPV decreased to NT$92,978,542, with a rate of change of -13.6%. Conversely, once the av- erage labor salary decreased 30%, the NPV increased to NT$123,283,311, with a rate of change of 14.5%. Regardless of a change in the cost of raw materials or labor within a range of ±30%, the NPV remained positive, which means that investment in regional- plant gasification power generation still had a
profitable space.
For long-term operation, the electricity costs could be considered a sensitivity factor due to power peak periods and summer sea- sons. However, an increase or decrease in the electricity cost within ±30% influenced the NPV only slightly within a range of ±1.4%.
Obviously, the electricity cost was not sig- nificantly sensitive for the investment plan of regional-plant gasification power generation.
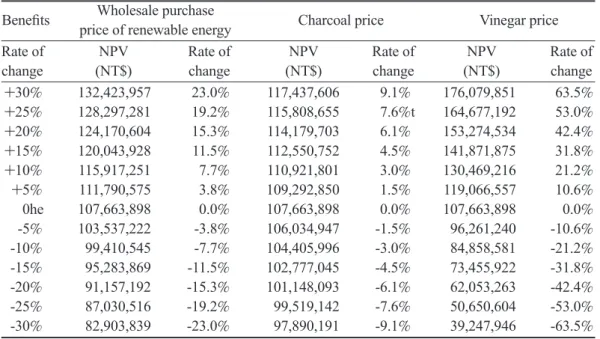
2. Benefit single-factor sensitivity analysis Table 12 shows sensitivity analysis results of 3 single factors of the wholesale purchase price of renewable energy, the charcoal price, and the vinegar price. Among these 3 factors, fluctuation in the vinegar price was most sensi- tive to the NPV, the wholesale purchase price of renewable energy was the second-most sen- sitive factor, and the charcoal price was a rela- tively weakly sensitive factor. The current vin- egar price in Taiwanese markets varies within a wide range of NT$50~200 L-1. This study adopted a price of NT$70 L-1 as a basic value for ease of estimation. Once the sale price of vinegar increased 30% (from NT$70 to NT$91 L-1) or decreased 30% (from NT$70 to NT$49 L-1), the NPV increased to NT$176,079,851 with a rate of change of 63.5% or decreased to NT$39,247,946 with a rate of change of -63.5%, respectively.
Table 10. Break-even analysis of investment plans for different equipment sets Item
No. of Operation Residue Power Unit cost of Unit cost of equipment time consumption generation residue disposal power generation sets (hr yr-1) (tons yr-1) (kWh yr-1) (NT$ ton-1) (NT$ kWh-1)
1 4,492.05 1,347.62 359,364.36 1,390.20 5.21
2 2,734.41 1,640.65 437,505.79 1,268.68 4.83
3 2,391.24 2,152.11 573,896.72 1,367.69 5.13
4 2,093.18 2,511.81 669,816.21 2,915.64 5.02
5 2,007.40 3,011.10 802,958.92 2,907.56 5.18
1) The unit costs were calculated at the present value with a discount rate of 5.25%.
The wholesale purchase price of renew- able energy was formulated by the Taiwanese energy authority based on the Renewable Energy Development Act, which is to pro- mote renewable energy development. Obvi- ously, the NPV was significantly affected by the wholesale purchase price of renewable energy. Once the wholesale purchase price increased 30% (from NT$3.80 to NT$4.94 kWh-1) or decreased 30% (from NT$3.80 to NT$2.66 kWh-1), the NPV increased to NT$132,423,957 with a rate of change of 23.0% or decreased to NT$82,903,839 with a rate of change of -23.0%, respectively.
With regard to the sale price of charcoal, there was only a small impact on the NPV of the investment plan. Once the charcoal price increased 30% or decreased 30%, the NPV increased or decreased in value only with a rate of change of ±9.1%.
Based on the above-described analytical results, in general, labor costs, raw mate- rial costs, vinegar prices, and the wholesale purchase price of renewable energy were sensitive factors that impacted the NPV of in-
vestment in regional-plant gasification power generation.
3. Discount rate sensitivity analysis
Table 13 shows that the effect of the discount rate on the NPV varied. Once the discount rate increased 8%, the NPV was reduced to NT$80,589,167, which was 25%
less than the original base value. When the discount rate increased 12%, the NPV sharply decreased to nearly 51.9% to NT$51,843,720, but the NPV remained positive, which means that the general investment plan could still meet the requirements of economic benefits, and the investment risk was within tolerance.
C. Scenario analysis
According to the multiple sensitivity ana- lytical results, the costs of raw materials, labor costs, and the vinegar price were obviously significant sensitive factors for the economic benefits of the investment plans. Therefore, to provide a more-valuable reference for inves- tors, this study further explored the uncertainty caused by changes in these factors through a Table 11. Cost single-factor sensitivity analysis to net present value (NPV)
Cost Raw materials Labor costs Energy charges
Rate of NPV Rate of NPV Rate of NPV Rate of
change (NT$) change (NT$) change (NT$) change +30% 92,507,303 -14.1% 92,978,542 -13.6% 106,120,681 -1.4%
+25% 95,033,402 -11.7% 95,496,219 -11.3% 106,377,884 -1.2%
+20% 97,559,501 -9.4% 98,022,319 -9.0% 106,635,087 -1.0%
+15% 100,085,601 -7.0% 100,548,418 -6.6% 106,892,290 -0.7%
+10% 102,611,700 -4.7% 103,074,517 -4.3% 107,149,493 -0.5%
+5% 105,137,799 -2.3% 105,600,616 -1.9% 107,406,696 -0.2%
0% 107,663,898 0.0% 107,663,898 0.0% 107,663,898 0.0%
-5% 110,189,998 2.3% 110,652,815 2.8% 107,921,101 0.2%
-10% 112,716,097 4.7% 113,178,914 5.1% 108,178,304 0.5%
-15% 115,242,196 7.0% 115,705,013 7.5% 108,435,507 0.7%
-20% 117,768,295 9.4% 118,231,112 9.8% 108,692,710 1.0%
-25% 120,294,394 11.7% 120,757,212 12.2% 108,949,913 1.2%
-30% 122,820,494 14.1% 123,283,311 14.5% 109,207,115 1.4%