國立臺灣大學企業管理碩士專班 碩士論文
Global MBA
College of Management National Taiwan University
Master Thesis
台灣 IC 設計公司面對 IDM 挑戰之對應策略,以立錡科 技為例
The strategic response of Taiwanese analog IC design houses to the challenges of IDM- A case study of Richtek Technology Corporation
黃炳凱
Huang, Ping-Kai
指導教授:陳忠仁 博士 Advisor: Chung-Jen Chen, Ph.D.
中華民國 101 年 6 月 June, 2012
ABSTRACT
A complete semiconductor supply chain has been established in Taiwan from the upstream such as circuit design and wafer fabrication to the downstream such as packaging and function test since the first fab was set up in 1980. The investment of integrated circuit manufacturing was saved tremendously when the business model, foundry, was proposed. Therefore, a lot of fabless design houses were set up in Taiwan, and the annual production value of IC design in Taiwan is in the second place over the world.
Most Taiwanese analog IC design companies start small and target niche markets and acquires the market by replacing the foreign companies at the low price. When the market leader utilizes its advantages like production capacities, capitals, and product portfolios, to adopt the aggressive expansion, it is an important task how to use past advantages to acquire additional resources to transform company for new competition to a Taiwanese fabless design house.
This research proposes mergers and acquisitions as a strategic move, and attempts to identify the factors of making decision. Texas Instrument and Richtek are raised as examples to discuss the relationship of the competition in analog IC industry, and five Taiwanese analog design houses are raised as M&A targets. The growth, revenue-enhancing synergy, cost reduction synergy, product portfolio, market positioning, and merging cost are discussed in this research.
Keyword: mergers and acquisitions, M&A, IC design, five forces
CONTENTS
口試委員會審定書 ...i
ABSTRACT ... ii
CONTENTS ... iii
LIST OF FIGURES ... v
LIST OF TABLES ... vii
Chapter 1 Introduction ... 1
1.1 Motivation... 2
1.2 Objects ... 5
1.3 Research Flow ... 6
Chapter 2 Literature Review ... 8
2.1 Strategic Motives and Determinants of M&A ... 8
2.2 Porter's Generic Strategies ... 10
2.3 Porter's Five Forces Analysis ... 11
Chapter 3 Methodology ... 15
3.1 Framework ... 15
3.2 Data Collection ... 17
Chapter 4 Case Description... 18
4.1 Analysis of Texas Instrument ... 18
4.2 Analysis of Texas Instrument Strategic Moves ... 23
4.3 Analysis of Richtek... 29
4.3.1 Past Research of Richtek ... 32
4.3.2 Richtek’s Current Status ... 35
4.4 Five Forces Analysis of Analog IC Industry ... 36
Chapter 5 Merging and Acquisition Decision ... 40
5.1 Analysis of Advanced Analog Technology ... 43
5.2 Analysis of Leadtrend Technology ... 48
5.3 Analysis of Macroblock Inc. ... 51
5.4 Analysis of Global Mixed-mode Technology ... 55
5.5 Analysis of Advanced Power Electronics Corp... 59
5.6 Summary ... 65
Chapter 6 Conclusion and Future Work... 69
6.1 Conclusion ... 70
6.2 Future Work ... 72
REFERENCE ... 74
ABOUT AUTHOR ... 76
LIST OF FIGURES
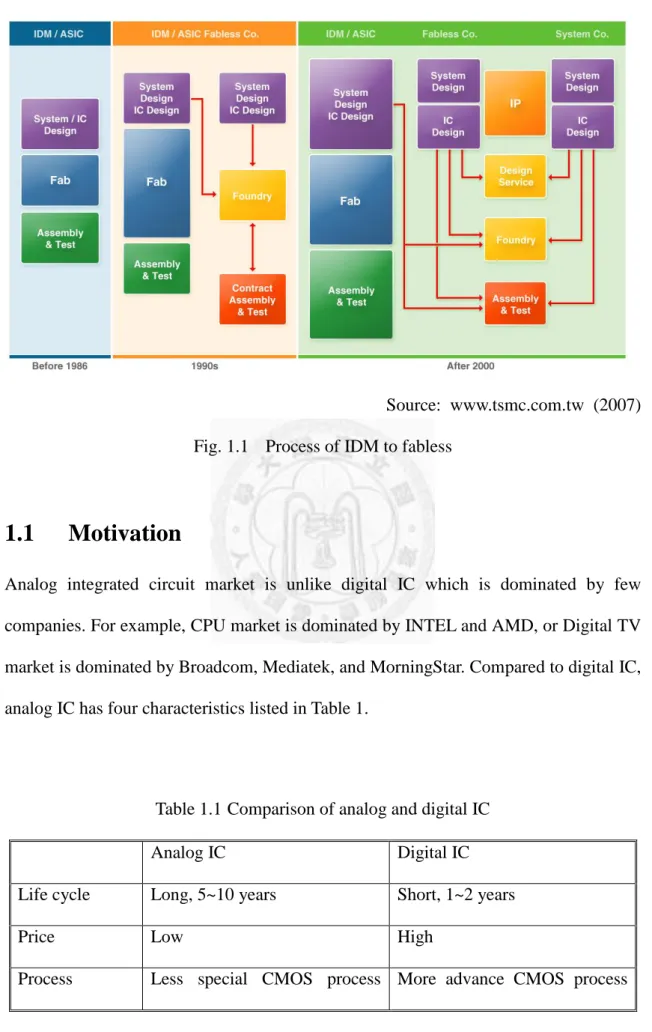
Fig. 1.1 Process of IDM to fabless ... 2
Fig. 1.2 Research flow ... 7
Fig. 2.1 Economies and Diseconomies of scale ... 9
Fig. 2.2 Michael Porter’s five forces model ... 14
Fig. 4.1 Taiwan semiconductor supply chain ... 18
Fig. 4.2 TI’s power management IC revenue distribution ... 25
Fig. 4.3 NS’s power management IC revenue distribution ... 26
Fig. 4.4 Richtek’s power management IC revenue distribution ... 31
Fig. 4.5 Richtek’s revenue compared to other Taiwanese analog fables design house31 Fig. 4.6 Richtek’s revenue, 2000~2010 ... 31
Fig. 4.7 Richtek’s P/E, 2003~2011 ... 32
Fig. 4.8 Richtek’s P/B, 2003~2011 ... 32
Fig. 4.9 Ichak Adizes’ corporate life cycle model ... 33
Fig. 5.1 AAT’s P/E, 2005~2012 ... 45
Fig. 5.2 AAT’s P/B, 2005~2012 ... 45
Fig. 5.3 AAT’s closing price on 30/03/2012 ... 47
Fig. 5.4 Richtek’s closing price on 30/03/2012 ... 47
Fig. 5.5 Leadtrend’s position in analog IC market ... 50
Fig. 5.6 Leadtrend’s closing price on 30/03/2012 ... 51
Fig. 5.7 Mblock’s closing price on 30/03/2012 ... 55
Fig. 5.8 GMT’s revenue distribution in application, 1Q/2007~2Q/2011 ... 56
Fig. 5.9 GMT’s P/E, 2004~2011 ... 57
Fig. 5.10 GMT’s closing price on 30/03/2012 ... 59
Fig. 5.11 APEC’s product mix ... 64
Fig. 5.12 AEPC’s closing price on 30/03/2012 ... 65
Fig. 5.13 BCG Matrix ... 66
Fig. 6.1 Market driving forces between TI and Richtek ... 71
Fig. 6.2 Richtek’s five force analysis after M&A... 72
LIST OF TABLES
Table 1.1 Comparison of analog and digital IC ... 2
Table 1.2 Analog chip company rank ... 3
Table 1.3 Top 10 semiconductor companies ... 4
Table 2.1 Michael Porter’s generic strategies ... 11
Table 4.1 Revenue of Texas Instrument, 2008~2011 ... 20
Table 4.2 Profit of Texas Instrument, 2011 ... 23
Table 4.3 Long-term debt of Texas Instrument, 2011 ... 27
Table 4.4 Principal payment of Texas Instrument ... 28
Table 4.5 Richtek’s financial statement, 2010~2011 ... 36
Table 5.1 Target companies’ capital, 2011 ... 42
Table 5.2 Case companies’ revenue, 2007~2011 ... 43
Table 5.3 AAT’ annual revenue, 2010~2011 ... 44
Table 5.5 Leadtrend’s P/E and P/B, 2007~2011 ... 49
Table 5.7 Mblock’s P/E and P/B, 2007~2011 ... 53
Table 5.8 GMT’s annual revenue, 2010~2011 ... 56
Table 5.9 Sales, market share ranking of top 15 power MOSFET vendors worldwide in 2009 ... 60
Table 5.10 APEC’s annual revenue, 2010~2011 ... 61
Table 5.11 APEC’s P/E and P/B, 2007~2011 ... 62
Table 5.12 Richtek’s 2011 revenue distribution ... 65
Table 5.13 Score in five factors ... 67
Chapter 1 Introduction
In this study, a merging and acquisition is proposed as a strategic move to respond to competitors in semiconductor industry. Firstly, we provide the basic background of this industry. The manufacturing processes of semiconductor are quite complex.
Semiconductor manufacturing begins with a sequence of photo-lithographic and chemical processing steps that fabricate a number of semiconductor devices on a thin silicon wafer. Each device on the wafer is tested and the wafer is cut into pieces called chips. Each chip is assembled into a package that then is usually retested. The entire process typically requires between 12 and 18 weeks and takes place in highly specialized facilities.
In the beginning of semiconductor industry, all of the processes are held in one company which integrates circuit design, wafer fabrication, chip packaging, and function test. This business model is called IDM, Integrated Device Manufacturer.
As the time rolling, more and more knowledgeable persons who are good at the circuit design and they raise capitals to set a company to design the circuit. We call this kind of company fabless design house, but they are not capable to set up their own fabs because the cost of setting up a fab becomes more and more expensive. For example, the cost of an 8” foundry is over USD $300 million. Therefore, there is another kind of business model appears that a company operates several foundries to provide semiconductor processing productivity to manufacture the chips for the fabless design houses, and it doesn’t design its own circuit. Taiwan Semiconductor Manufacture Corporation (abbreviated TSMC) (2330TT) is a typical model of this business.
Source: www.tsmc.com.tw (2007) Fig. 1.1 Process of IDM to fabless
1.1 Motivation
Analog integrated circuit market is unlike digital IC which is dominated by few companies. For example, CPU market is dominated by INTEL and AMD, or Digital TV market is dominated by Broadcom, Mediatek, and MorningStar. Compared to digital IC, analog IC has four characteristics listed in Table 1.
Table 1.1 Comparison of analog and digital IC
Analog IC Digital IC
Life cycle Long, 5~10 years Short, 1~2 years
Price Low High
Process Less special CMOS process More advance CMOS process
technology technology brings more advantages
Robustness
Close relationship with the components
Less noise and distortion in application
Therefore, the top three players of the analog chip market, Texas Instruments Incorporated (NYSE: TXN), STMicroelectronics and Infineon, together have about 33% market share.
Table 1.2 Analog chip company rank 2010
Rank
2010 Revenue
2010 Share
2009 Rank
2009 Revenue
2009 Share
Texas Instrument 1 6,190 14.64% 1 4,372 13.66%
STMicroelectronics 2 4,291 10.15% 2 3,409 10.65%
Infineon 3 3,328 7.87% 3 2,704 8.45%
ADI 4 2,482 5.87% 4 1,798 5.62%
ON SEMI 5 2,313 5.47% 5 1,769 5.53%
Maxim 6 1,936 4.58% 7 1,333 4.17%
Fairchild 7 1,600 3.78% 8 1,188 3.71%
National Semiconductor
8 1,419 3.36% 6 1,460 4.56%
Linear 9 1,170 2.77% 9 968 3.02%
Intersil 10 822 1.94% 10 611 1.91%
Richtek - 404.7 0.96% - 267 0.83%
Market size 42,285 100.00% 32,001 100.00%
Unit: $M; Conversion rate: 1USD=30NTD Source: Databeans (2011/3/24), Companies’ reports summarized by this study
In 3rd quarter in 2009, Texas Instrument’s (abbreviated TI) first 12” foundry which installed the equipments purchased from Qimonda, a bankrupt memory company, entered into the mass production phase. In 2010, TI continued its expansion strategy acquiring two wafer fabs from Spansion Japan Limited. The two fabs located in Aizu-Wakamatsu have 12” and 8” wafer capacities. Not only in Japan, but TI also acquired SMIC’s 8” fab which is used in memory production originally in Chengdu. TI purchased these facilities at very low price from theses bankrupt companies except SMIC that gives it a significant advantage in lowering the cost of production.
After the acquisition of National Semiconductor (abbreviated NS) in April 2011, it has become the 3rd largest semiconductor producer, adding $42 billion to annual revenue from NS.
Table 1.3 Top 10 semiconductor companies
2010 Rank Company
2010 Revenue (US$M)
2010 Market Share
1 INTEL 41,430 13.8%
2 SAMSUNG 28,256 9.4%
3 TOSHIBA 12,376 4.1%
4* Texas Instrument 12,356 4.1%
5 Renesas 10,368 3.5%
6 Hynix 10,350 3.4%
7 STMicroelectronics 10,290 3.4%
8 Micron 8,884 3.0%
9 Qualcomm 7,167 2.4%
10 Infineon 6,680 2.2%
Others 152,156 50.7%
Sum 300,313 100.0%
*excluding National Semiconductor’s revenue Source: Gartner (2010/12)
1.2 Objects
There are several possible and practical strategic moves can be adopted to respond TI’s strategic moves. The object of this research is to see it is helpful if there is any merger and acquisition will be formed between Taiwanese analog chip fabless design houses to cross the ceiling and take the advantage of economic of scope to compete with TI and how to choose the target companies.
Facing TI’s aggressive expansion, the other analog chip companies adopted several strategic moves. There are two identical companies which adopted the similar strategies to TI. The first one is MAXIM, which leveraged the production capability of Powerchip’s 12” fab. The utilization of Powerchip’s fab is low because DRAM industry is under down cycle. The other one is Infineon which purchased Qimonda’s 12” fab located in Dresden, Germany at EU € 100.6 million on 12th, May, 2011. Taiwanese analog chip fabless design houses must be impacted by this chain reaction initiated by
TI.
The rising of Taiwanese fabless design house is usually resulted in a single successful product in a single product line. The risk of this business model is the growth momentum is highly relative to one industry, and the profit is decreasing and decreasing because the competition among the rivalries if this company fails in the expansion of developing a new product line successfully. Generally speaking, we can set several ceilings to review the growth of an analog chip fabless design house. The first ceiling is NT$1 billion, and the second on is NT$3 billion ($100 million). A fabless design house crosses the last one to prove it can stand in the industry longer that the revenue is above NT$30 billion ($1 billion).
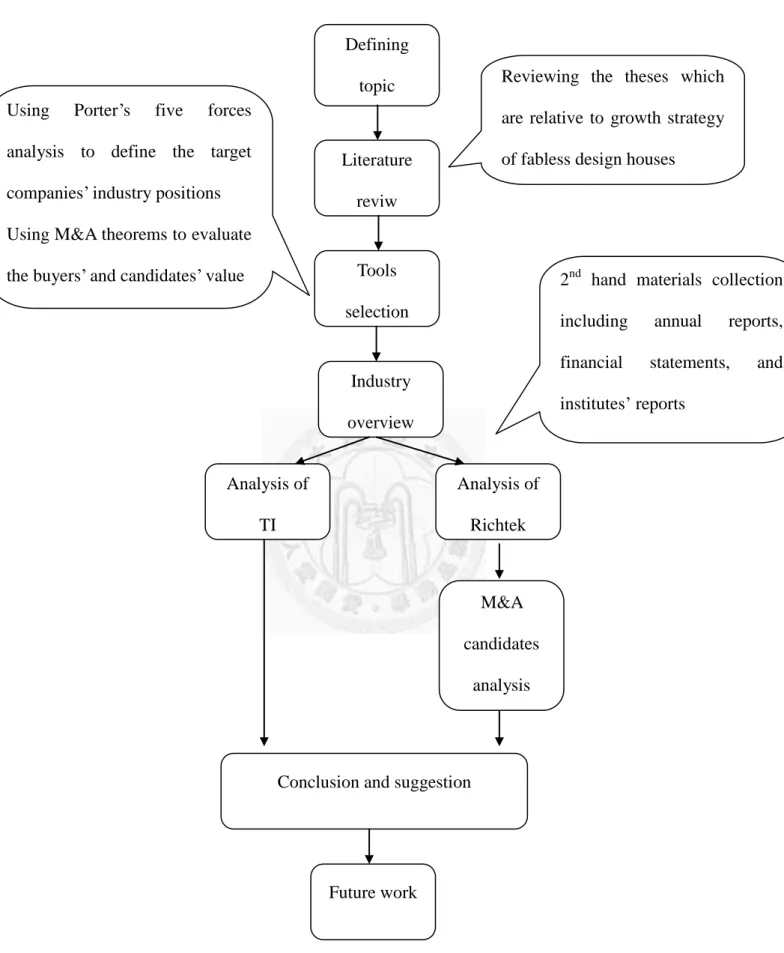
1.3 Research Flow
This research follows the steps listed in Fig. 1.2. It is expected to find a conclusion and result a workable suggestion which can be applied as a strategy. However, there are three factors could impact the precision of the conclusion resulted by this research.
(1) Some cooperation’s information is treated confidential so that it wouldn’t like to be disclosed
(2) Most of Taiwanese companies’ annual reports are published in June before the shareholders assembly. The main framework of this research is made in April.
Therefore, this study can’t collect the most updated data.
(3) Due to constrain of time and the limitation of the ability, the conclusion may not be an effective solution to this issue.
Fig. 1.2 Research flow Defining
topic
Literature reviw
Tools selection
Reviewing the theses which are relative to growth strategy of fabless design houses Using Porter’s five forces
analysis to define the target companies’ industry positions Using M&A theorems to evaluate the buyers’ and candidates’ value
Industry overview
Analysis of TI
Analysis of Richtek
2nd hand materials collection including annual reports, financial statements, and institutes’ reports
M&A candidates
analysis
Conclusion and suggestion
Future work
Chapter 2 Literature Review
This study combines the analysis of strategies and finance, so that several tools including Porter’s generic strategy, and five forces model are applied in the study to exam the case companies’ strategies and the positions in the belonged industry, and to evaluate the M&A, the five key elements proposed by Gaughan P.A. “Mergers acquisitions and corporate restructurings”(2007), are growth, synergy, operating synergy, diversification, and other economics motives like taxation are applied. In the end of this chapter, a framework will be come out from the summary of three tools, and it is used to evaluate the target companies.
2.1 Strategic Motives and Determinants of M&A
The five key elements proposed by Gaughan P.A. are growth, synergy, operating synergy, diversification, and other economics moves.
Growth
One of the most fundamental motives for M&As is growth. Companies seeking to expand are faced with a choice between internal or organic growth and growth through M&As. Growth through M&As may be a much more rapid process, although it brings with it its own uncertainties. Companies may grow within their own industry or they may expand outside their business category.
Synergy
The term synergy is often associated with the physical sciences rather than with economics or finance. It refers to the type of reactions that occur when two substances or factors combine to produce a greater effect together than that which the sum of the
Operating Synergy
Operating synergy can be defined as two categories, revenue-enhancing operating synergy and cost reduction synergies. Revenue-enhancing operating synergy may come from new opportunities that are presented as a result of the combination of the two merged companies.There are many potential sources of revenue enhancements, and they may vary greatly from deal to deal. They may come from a sharing of marketing opportunities by cross-marketing each merger partner’s products. With a broader product line, each company could sell more products and services to their product base.
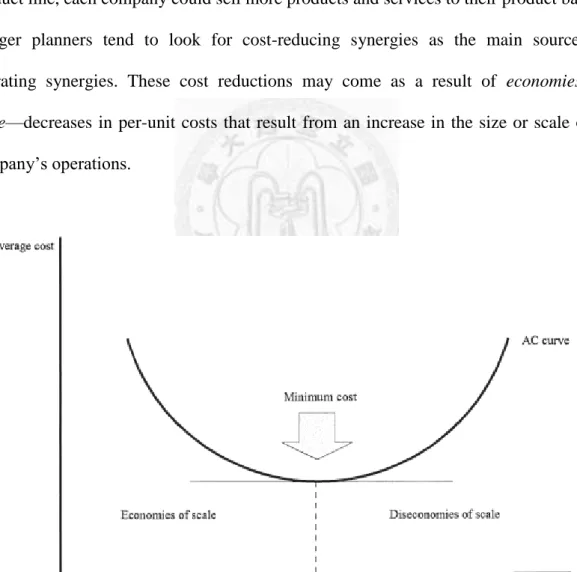
Merger planners tend to look for cost-reducing synergies as the main source of operating synergies. These cost reductions may come as a result of economies of scale—decreases in per-unit costs that result from an increase in the size or scale of a company’s operations.
Fig. 2.1 Economies and Diseconomies of scale
Diversification
Diversification means growing outside a company’s current industry category. This motive played a major role in the acquisitions and mergers that took place in the third merger wave—the conglomerate era. This outward expansion was often facilitated by some creative financial techniques that temporarily caused the acquiring firm’s stock price to rise while adding little real value through the exchange.
Other Economics Motives
In addition to economies of scale and diversification benefits, there are two other economic motives for M&As: horizontal integration and vertical integration. Horizontal integration refers to the increase in market share and market power that results from acquisitions and mergers of rivals. Vertical integration refers to the merger or acquisition of companies that have a buyer–seller relationship.
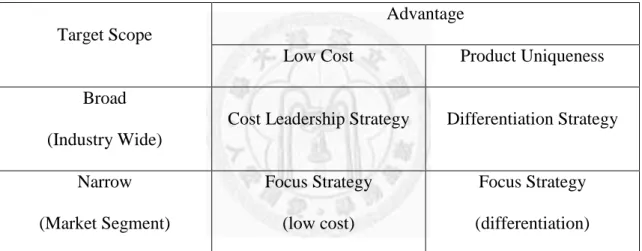
2.2 Porter's Generic Strategies
In Porter's “Competitive Strategy: Techniques for Analyzing Industries and Competitors”
(1980), he simplifies the scheme by reducing it down to the three best strategies. They are cost leadership, differentiation, and market segmentation (or focus). Market segmentation is narrow in scope while both cost leadership and differentiation are relatively broad in market scope.
Firms with a high market share were often quite profitable because they pursued a cost leadership strategy. Porter suggested combining multiple strategies is successful in only one case. Combining a market segmentation strategy with a product differentiation strategy was seen as an effective way of matching a firm’s product strategy (supply side) to the characteristics of your target market segments (demand side). But combinations like cost leadership with product differentiation were seen as hard (but not impossible)
to implement due to the potential for conflict between cost minimization and the additional cost of value-added differentiation.
Some commentators have made a distinction between cost leadership, that is, low cost strategies, and best cost strategies. They claim that a low cost strategy is rarely able to provide a sustainable competitive advantage. In most cases firms end up in price wars.
Instead, they claim a best cost strategy is preferred. This involves providing the best value for a relatively low price.
Table 2.1 Michael Porter’s generic strategies
Target Scope
Advantage
Low Cost Product Uniqueness
Broad (Industry Wide)
Cost Leadership Strategy Differentiation Strategy
Narrow (Market Segment)
Focus Strategy (low cost)
Focus Strategy (differentiation)
2.3 Porter's Five Forces Analysis
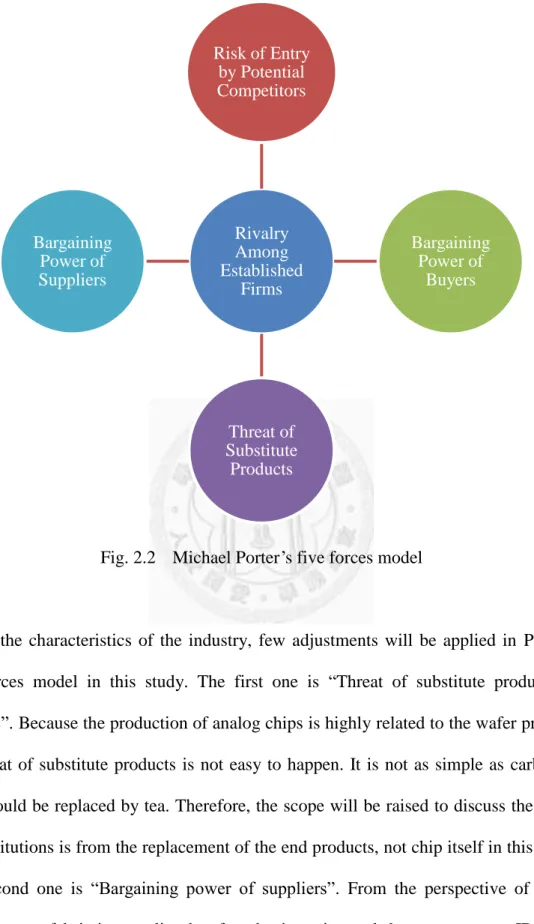
Porter’s “Five Forces Analysis” is a framework for industry analysis and business strategy development published in Harvard Business Review in 1979. “Five Forces Analysis” is used to determine the competitive intensity and therefore attractiveness of a market.
Risk of Entry by Potential Competitors
(1) The existence of barriers to entry (patents, rights, etc.) (2) Economies of product differences
(3) Brand equity
(4) Switching costs or sunk costs (5) Capital requirements
(6) Access to distribution
(7) Customer loyalty to established brands (8) Absolute cost
(9) Industry profitability
Rivalry Among Established Firm
(1) Sustainable competitive advantage through innovation (2) Competition between online and offline companies (3) Level of advertising expense
(4) Powerful competitive strategy
Threat of Substitute Products (1) Buyer propensity to substitute
(2) Relative price performance of substitute (3) Buyer switching costs
(4) Perceived level of product differentiation
(5) Number of substitute products available in the market
(6) Ease of substitution. Information-based products are more prone to substitution, as online product can easily replace material product.
(7) Substandard product (8) Quality depreciation
Bargaining Power of Suppliers
(2) Degree of differentiation of inputs
(3) Impact of inputs on cost or differentiation (4) Presence of substitute inputs
(5) Strength of distribution channel
(6) Supplier concentration to firm concentration ratio (7) Employee solidarity (e.g. labor unions)
(8) Supplier competition - ability to forward vertically integrate and cut out the BUYER
Bargaining Power of Buyers
(1) Buyer concentration to firm concentration ratio
(2) Degree of dependency upon existing channels of distribution (3) Bargaining leverage, particularly in industries with high fixed costs (4) Buyer volume
(5) Buyer switching costs relative to firm switching costs (6) Buyer information availability
(7) Availability of existing substitute products (8) Buyer price sensitivity
(9) Differential advantage (uniqueness) of industry products
Fig. 2.2 Michael Porter’s five forces model
Due to the characteristics of the industry, few adjustments will be applied in Porter’s five forces model in this study. The first one is “Threat of substitute products or services”. Because the production of analog chips is highly related to the wafer process, the threat of substitute products is not easy to happen. It is not as simple as carbonate drink could be replaced by tea. Therefore, the scope will be raised to discuss the threat of substitutions is from the replacement of the end products, not chip itself in this study.
The second one is “Bargaining power of suppliers”. From the perspective of an IC design house, fab is its supplier, but foundry is an internal department to an IDM. To unify the discussion, the fab is treated as a supplier in this study.
Rivalry Among Established
Firms Risk of Entry
by Potential Competitors
Bargaining Power of
Buyers
Threat of Substitute
Products Bargaining
Power of Suppliers
Chapter 3 Methodology
The most of Taiwanese companies in semiconductor industry are small and medium businesses. This study reviews literatures to conclude the position of corporation life where Richtek is, and how the growth track reflects in the revenue. According to the managing level of Richtek analyzed the competitive strengths by Porter’s five forces analysis itself, which kind of the merging and acquisition suggestion should be applied to Richtek.
3.1 Framework
Combining the three tools mentioned in the previous chapters, the factors used to evaluate in this study are growth, vertical integration, horizontal integration, debt/asset ratio, and merging cost. All the data used to analyze are from the public information, like the annual reports, quarterly financial reports, companies’ websites, and institutes’
reports.
(1) Growth
The number used to evaluate the first factor “growth” is the revenue. How much the merger contributes to the growth, and it can help the target firm cross the ceiling of the revenue. The concept is similar to revenue-enhancing operating synergy. The greater revenue is positive to block the new comers enter this industry, and is a basic to gain the greater bargaining power of suppliers and customers. Price-to-Earning ratio (P/E) and Price-to-Book ratio (P/B) are used to predict the growth in the future.
(2) Vertical integration
The idea of vertical integration is similar to cost leadership proposed in Porter’s generic strategies and cost reduction synergy. This study uses the amount the case
companies pay to the major vendor to estimate the potential of cutting cost by scale of economics. Also, this factor reflects to “bargaining power of suppliers” in Porter’s five forces analysis.
(3) Horizontal integration
Porter’s generic strategies tell us the other strategy to pursuit the competitive advantage is “Differentiation”. In this factor, this study measures the product portfolio compliment after the merger. If one firm can provide more products to a customer, its bargaining power of customers becomes stronger according to Porter’s five forces analysis.
(4) Debt/asset ratio
The one topic mentioned in Gaughan P.A.’s “Desirable Characteristics of Secured Leveraged Buyout Candidates” is “Limited debt on the firm’s balance sheet”. The less debts on the firm’s balance sheet relative to the collateral value of the firm’s assets, the greater the borrowing capacity of the firm. If the firm’s balance sheet is already encumbered by significant financial leverage, it may be more difficult to finance the LBO. The prior debt limits the company’s borrowing capacity. Even companies with low pre-LBO debt levels end up exhausting their borrowing capacity after the LBO
(5) Merging cost
The better and more efficient M&A way is LBO and it can enjoy the benefit of tax reduction. However, the M&A tool concerned in this thesis is only stock-for-stock because of the inefficiency of Taiwan’s financial environment. Therefore, the stock price is the criterion in calculating the merging cost. The closing price on 30/3/2011 is used to be the cost of the merger.
3.2 Data Collection
The data analyzed in this study are second hand information including revenues, financial statements, stock prices, product portfolios, and etc. They are published in companies’ annual reports, institutes’ reports from securities companies, consulting companies, and research companies.
Annual report
&Financial statement
• Texas Instrument
• Richtek
• Advanced Analog Technology
• Leadtrend
• Mblock
• Global Mixed- mode
Technology
• Advance Power Electronic Corp.
• TSMC
Consulting company
• Gartner
• Databean
• ITRI
• Global Data
• Wright Investors' Service Research
Securities
• CLSA
• Citibank
• Nomura
• KGI
• JP Morgan
• Fubon
• Deutsche Bank
Website
• Bloomberg
Chapter 4 Case Description
The characteristic of Taiwanese semiconductor industry is the network of firms to band together to produce and distribute. From the supply chain, whole industry can be defined as upstream and downstream. The upstream companies include fabs, masks, and IC design houses. The downstream companies include assembly, test, and distributors.
This network is formed by small and medium capital companies to lower the entry barrier. Conversely, an IDM integrates all productions in house, and its capital is huge.
In the following paragraphs, two indicators will be raised for the research. One is TI which represents an IDM, and the other is Richtek which represents a fabless design house.
Source: ITRI (2005) Fig. 4.1 Taiwan semiconductor supply chain
4.1 Analysis of Texas Instrument
TI is a typical foundry model of Integrated Device Manufacturers, IDM, which design and manufacture semiconductors by themselves. TI founded in 1930, and is corporate in
WAFER
MATERIAL
DESIGN
MASK
CHEMISTRY
FAB
CP CMP
PACKAGE
FT LEADFRAME
CHANNEL
Delaware, headquartered in Dallas, Texas, and has design, manufacturing or sales operations in more than 30 countries, and it is the world 4th largest semiconductor company in 2010 as measured by revenue according to Gartner’s investigation.
TI owns and operates semiconductor manufacturing facilities in North America, Asia and Europe. These include both high-volume wafer fabrication, assembly and field test facilities that require substantial investment to construct and are largely fixed-cost assets once in operation. Because TI owns many manufacturing capacities, a significant portion of TI’s operating cost is fixed, and it is inflexible when the market is during the down cycle. In general, these fixed costs do not decline with reductions in customer demand or utilization of capacity. Therefore, TI needs to keep manufacturing products to dilute the fixed cost even the down cycle, and launches price competition to sell products as more as possible.
In order to lower the expense in keeping investing advanced fabrication processing technology like 90nm, 65nm or more advanced, and maintain the utilization of the capacity. TI manufactures Analog products and most of our Embedded Processing products by using older, less expensive equipment, and outsources the advanced logic products, such as Wireless products. Advanced logic wafer manufacturing continually requires new and expensive processes and equipment. In contrast, the processes and equipment required for manufacturing our Analog products and most of our Embedded Processing products do not have this requirement.
To supplement our internal wafer fabrication capacity and maximize our responsiveness to customer demand and return on capital, our wafer manufacturing strategy utilizes the capacity of outside suppliers, commonly known as foundries, like TSMC. TI sources about 25 percent of our wafers from external foundries, with the vast majority of this outsourcing being for advanced logic wafers. In 2010, external foundries provided 60
percent of the fabricated wafers for our advanced logic manufacturing needs. TI expects the proportion of our advanced logic wafers provided by foundries will increase over time. TI expects to maintain sufficient internal wafer fabrication capacity to meet the vast majority of its own analog production needs.
In addition to using foundries to supplement TI’s wafer fabrication capacity, TI selectively use subcontractors to supplement our assembly/test capacity. TI generally use subcontractors for assembly and filed test of products that would be less cost-efficient to complete in-house (e.g., relatively low-volume products that are unlikely to keep internal equipment fully utilized), or when demand temporarily exceeds its own internal capacity. TI believes it often has a cost advantage from maintaining internal assembly and field test capacity.
TI’s internal and external manufacturing strategy reduces the level of our required capital expenditures, and thereby reduces our subsequent levels of depreciation below what it would be if we sourced all manufacturing internally. Consequently, TI experiences less fluctuation in our profit margins due to changing product demand, and lower cash requirements for expanding and updating its manufacturing capabilities.
TI has three major product lines which are Analog, Wireless, and Embedded Processing, and the revenue distributions are listed in Table from 2008 to 2012.
Table 4.1 Revenue of Texas Instrument, 2008~2011
2008 2009 2010 2011
Amount Ratio Amount Ratio Amount Ratio Amount Ratio Analog 4,789 38.31% 4,202 40.30% 5,979 42.81% 6,375 46.41%
Wireless 3,451 27.61% 2,626 25.18% 2,978 21.32% 2,518 18.33%
Embedded Processing
1,631 13.05% 1,471 14.11% 2,073 14.84% 2,110 15.36%
Other 2,630 21.04% 2,128 20.41% 2,936 21.02% 2,732 19.89%
Revenue 12,501 100% 10,427 100% 13,966 100% 13,735 100%
Source: TI’s annual report, 2011~2010
Analog
TI’s analog product portfolio includes sound, temperature, pressure or images – by conditioning them, amplifying them and often converting them to a stream of digital data that can be processed by other semiconductors, such as digital signal processors (DSPs). TI’s analog semiconductors are also used to manage power distribution and consumption. Sales to TI’s analog segment’s more than 80,000 customers generated 43 percent of our revenue in 2010. According to Databeans’ research, the worldwide market for analog semiconductors was about $42 billion in 2010. TI’s analog segment’s revenue in 2010 was about $6 billion, or about 14 percent of this market, the leading position
Wireless
The growth dynamitic of wireless products comes from enabling connectivity through the cellular network (such as Bluetooth® devices, WiFi networks, GPS location services, and Near Field Communication (NFC)). TI’s wireless products which could be used in cell phones, tablet computers and other emerging portable devices generated about $3 billion, or 21 percent of our revenue, in 2010, with a significant portion of those sales to a single customer, Nokia.
TI’s Wireless investments are concentrated on its connectivity products and OMAP applications processors, areas we believe offer significant growth opportunities and
which will enable us to take advantage of the increasing demand for more powerful and more functional mobile devices
Embedded Processing
TI’s Embedded Processing products include our DSPs and microcontrollers. DSPs perform mathematical computations almost instantaneously to process or improve digital data. Microcontrollers are designed to control a set of specific tasks for electronic equipment.
Sales of Embedded Processing products generated 15 percent of our revenue in 2010.
According to external sources, the worldwide market for embedded processors was about $18 billion in 2010. TI’s Embedded Processing segment’s revenue in 2010 was about $2 billion, or about 11 percent of this fragmented market.
Embedded Processing products are used in many different applications and custom Embedded Processing products are used in specific applications, such as communications infrastructure equipment and automotive.
TI’s 2011 revenue was $13.73 billion which is slightly decreased compared to 2010, but net income was $2.24 billion which was less than $992 million compared to 2010.
Gross profit in 2011 was $6.77 billion, a decrease of $720 million, or 10 percent, from 2010. The reasons are
1. Restructuring from the earthquake in Japan
2. Semiconductor downturn began in the third quarter, 2011
3. A combination of decreasing order, lower revenue, lower average levels of factory utilization as we reduced production in response to weaker demand. Lower factory utilization decreased our gross profit by $175 million from the year-ago period 4. Acquisition-related charges reflected in cost of revenue and inventory charges
Table 4.2 Profit of Texas Instrument, 2011
2011 2010 YoY
Revenue 13,735 13,966 (1.68%)
CoGS 6,963 6,474 7.02%
Gross profit 6,772 7,492 (10.63%)
Gross margin 49.30% 53.64%
SG&A 1,638 1,519 7.26%
Operating profit 2,992 4,514 (50.87%)
Operating margin 21.78% 32.32%
*the number excludes NS’ revenue
Unit: M USD Source: TI’s annual report, 2011
Acquiring National Semiconductor
TI acquired National Semiconductor (NYSE:NSM) for $6.5 billion in cash on 23rd, September in 2011. TI financed this deal with cash and debt, and believed it can recover TI’s investment with three to four years. In this study, we think this is the key reason why TI acquired NS within 73% premium.
4.2 Analysis of Texas Instrument Strategic Moves
Acquiring National Semiconductor: diversification by horizontal integration
The acquisition was not predatory, but strategic, combining two industry leaders in analog semiconductors, each with unique strengths in delivering products to improve performance and efficiency and convert real-world signals in electronic systems. To
show its support, the boards of directors of both companies have unanimously approved the transaction.
“This acquisition is about strength and growth,” said Rich Templeton, TI’s chairman, president and chief executive officer. “National has an excellent development team, and its products combined with our own can offer customers an analog portfolio of unmatched depth and breadth. In recent years, National’s management team has done an outstanding job of improving margins and streamlining expenses, which upon close will increase TI’s profitability and earnings per share, excluding transaction costs. Our ability to accelerate National’s growth with our much larger sales force is the foundation of our belief that we can produce strong returns on our investment. The combined sales team will be 10 times larger than National’s is today, and the portfolio will be exposed to more customers in more markets.”
Each respective company boasts core competencies the other yearns for. Among them are TI’s incredible range of 30,000 analog products, extensive customer reach, and industry-leading manufacturing including the world’s first 300-millimeter analog factory.
National brings a portfolio of 12,000 analog products, a strong position with customers in the industrial power market, and excellent customer design tools. When the deal finalizes, National becomes absorbed into TI’s analog arm and should produce well over half the sales in the division. The dual company will also leverage National’s manufacturing operations in US, Scotland and Malaysia, which TI will continue to operate. Each preexisting site has further room to grow and falls in line with Templeton’s grand vision.
In 2012, Texas Instruments (TXN) is transferring its listing to the Nasdaq Stock Market from the New York Stock Exchange, becoming the biggest company ever to make the
The second-largest U.S. chipmaker will start trading on Nasdaq’s platform on Jan. 3, keeping its TXN symbol, ending a 60 year relationship with NYSE. The motivation for TI to make the move is annual cost savings for listing venues. TI, given its market value, would be about the 17th biggest company listed on new exchange board.
TI thinks the existing products portfolio overlap with NS is very few.TI’s revenue in analog comes from the application of computing mainly, but computing only accounts 8% of NS’ revenue. NS’ revenue comes from wireless mainly, but this part only accounts 11% of TI’s. Therefore, we can foresee the products overlap of these two companies is few.
Source: Gartner 2011/4 Fig. 4.2 TI’s power management IC revenue distribution
Military/Aerosp ace 1%
Consumer 13%
Automobile 1%
Communicatio ns 17%
Wireless 11%
Computing 38%
Storage 3%
Industrial/Medi cal 16%
Source: Gartner 2011/4 Fig. 4.3 NS’s power management IC revenue distribution
Acquiring foundries: cost leadership by vertical integration
NS only has two 8” foundries which locate in Greenock, Scotland and South Portland, Maine, and it also outsource some products to foundries. Now, TI only utilizes 50% of production capability, so TI can complement NS’ production base to produce wafers in house, and stop outsourcing to save the transaction cost.
Lowering average cost by huge volume
Risk of acquiring National Semiconductor
LBOs present a variety of risk. The risk of an LBO may be broken down into two main categories: business risk and interest rate risk.
Business risk refers to the risk that the firm going private will not generate sufficient earnings to meet the interest payments and other current obligations of the firm. This
Military/Aero space
1%
Consumer 12%
Automobile 3%
Communicat ions
3%
Wireless 47%
Computing 8%
Storage 1%
Industrial/M edical
25%
risk category takes into account factors such as cyclical downturns in the economy and competitive factors within the industry, such as greater price and nonprice competition.
Firms that have very cyclical sales or companies that are in very competitive industries tend not to be good LBO candidates.
TI paid $2,956 million and $3,528 million to acquire National’s intangible assets including developed technology, customer relationships, and in-process R&D, and goodwill which is attributed to including National’s product portfolio and work expertise. This payment accounts 98.88% of this acquisition. It means if this acquisition can’t bring the synergy, TI will be hurt a lot.
Interest rate risk is the risk that interest rates will rise, thus increasing the firm’s current obligations. This is important to firms that have more variable rate debt. Interest rate increases could force a firm into bankruptcy even when it experienced greater than anticipated demand and held nonfinancial costs within reasonable bounds. The level of interest rates at the time of the LBO may be a guide to the probability that rates will rise in the future. For example, if interest rates are low at the time of the buyout, interest rate increases may be more likely than if interest rates are at peak levels.
TI issued fixed- and floating-rate long term debt to help fund the National Semiconductor acquisition. The total amount is $3.497 billion. The following table summarizes the total long-term debt outstanding as of December 31, 2011
Table 4.3 Long-term debt of Texas Instrument, 2011
Due Interest rate Amount
2012
6.15% $375
Floating rate $1,000
Swapped to 0.0922% fixed rate
2013 0.875% $500
2014 1.375% $1,000
2015 3.95% $250
2016 2.375% $1,000
2017 6.60% $375
Total long-term debt $4,500
Unit: million USD Source: TI’s annual report, 2011
Adding the net unamortized premium ($93M) and deducting less current portion of long-term debt ($382M), TI’s total long-term debt is $4,211M of December 31, 2011.
Although TI issued the debts at the fixed rate mostly, and it won’t be impacted by the interest rate variation heavily, it is still a big challenge to TI to pay the interest and principals year by year. According to TI’s 2011 annual report, the long-term debt obligations represent principal payments and include amounts classified as current portion of long-term debt is listed in Table. The related interest payments are not included.
Table 4.4 Principal payment of Texas Instrument Payment due by period
2012 2013/2014 2015/2016 thereafter Total Long-term debt obligation $375 $2,500 $1,250 $375 $4,500
Unit: million USD
Source: TI’s annual report, 2011
Reviewing TI’s cash flows, cash and cash equivalents at end of 2011 is $992 million, and TI’s annual adding cash and cash equivalents is around $130 million according to the records in 2009 and 2010. So, we can forecast TI will face a challenge to pay principals and interest from 2013 if the synergy of acquiring NS is not as good as the expectation. Also, it is difficult to TI to launch other acquisitions before 2017.
Obviously, TI’s strategy is to leverage the advantages in cost leadership by acquiring foundries at the low price, and differentiation by acquiring NS at the same time.
In this study, we will discuss how it will impact Taiwanese analog chip industry and how Taiwanese companies should react. We will use Richtek as an example because it is the top analog company in Taiwan, but it has only around 1.3% market share. For Taiwanese fabless analog IC firms like Richtek, who currently utilizes TSMC’s 6” wafer fab mainly, TI’s activities pose a real threat. A 12” wafer can produce dies 2.25 times that of 8" wafer, and 4 times that of 6" wafer. Will it form a consolidation in Taiwanese fabless analog IC firms? In this study we will explore possible strategies in M&A and discuss it is workable to compete with TI or not.
4.3 Analysis of Richtek
Richtek, founded in 1988, is a fabless design house which participates in analog circuit design, test, sale, and marketing has long been a Taiwanese IC design company leading in the market of analog chips for consumer electronics, computers, and communications equipment. Richtek doesn’t have own production capability, but outsources to the professional manufacturers, like TSMC for wafer fabrication, and Greetek for chip
packaging.
Richtek’s products are 100% in analog and product portfolios are (1) Linear regulator
(2) Switching converter (3) Switching controller (4) Battery management (5) WLED driver
(6) LED lighting driver (7) ADC/DAC and amplifier
Richtek’s products are used in four categories majorly which are listed in the following figure, and the portions are.
Computing: TFT LCD panel, motherboard, notebook, graphic card Communication: mobile phone, network
Consumer: handheld, digital still camera Others: storage, others
Source: Richtek annual report 2010
Fig. 4.4 Richtek’s power management IC revenue distribution
Richtek has the highest and fastest revenue growth in Taiwan’s analog chip vendors with an average product gross margin of ~36.2% for ten years (2000-2010).
Source: Richtek investors report 09-2011 Fig. 4.5 Richtek’s revenue compared to other Taiwanese analog fables design house
Source: Richtek investors report 09-2011 Fig. 4.6 Richtek’s revenue, 2000~2010
Source: Nomura Equity Research 10/08/2011 Fig. 4.7 Richtek’s P/E, 2003~2011
Source: Nomura Equity Research 10/08/2011 Fig. 4.8 Richtek’s P/B, 2003~2011
4.3.1 Past Research of Richtek
They are “The Competitive Advantages of Operation Strategies Study for Taiwan Small and Medium IC Fables Enterprises” (2011) by Lu, Tse-Jen and “A Case Study of Competitive Advantage of Nations on Analog IC Companies in USA,Taiwan & China”
(2009) by Chia-Hsiang Weng. Lu’s research tells us when a corporation seeks a further growth, it should create another product line before “Stable” stage. He uses Ichak Adizes corporation life cycle to indicate where the Taiwanese fabless companies are.
The corporate life cycle model separates 10 stages of a corporate life. They are Courtship, Infancy, Go-Go, Adolescence, Prime, Stable, Aristocracy, Early Bureaucracy, Bureaucracy, and Death. In Lu’s analysis, he defines Richtek is in the stage of adolescence because Richtek keeps the momentum of the growth, and corporation operation is excellent. At that time, Richtek entered the rank of worldwide top 25 companies. Lu suggests Richtek should watch the competitors’ strategies and keeps expanding the market share to keep the momentum.
Fig. 4.9 Ichak Adizes’ corporate life cycle model
In Weng’s interview to Steve Lai, Chief Operating Officer, COO of Richtek, who thought Richtek stayed the leadership in its own industry by Porter’s five forces analysis.
Lai thought the threat of the potential entrant is low, so that the competition is limited in
the existed companies. Compared to sticking the price, it is easier to drive the cost down because Richtek has advantages in the scale of economics. He also pointed out Taiwanese fabless design house is not good at creating plural successful product lines.
Lai analyzes Ritchtek itself by Porter’s five forces analysis in the following paragraph.
Risk of Entry by Potential Competitors: LOW
The new entrant usually competes by the pin-to-pin compatible at the low price.
However, Richtek has achieved the economic of scale. Therefore, it forms a barrier in the cost, and Richtek’s controllability in channels is high.
Rivalry Among Established Firms: HIGH
The investment of a fables design house is not high, and the exit barrier is not high, either. So, there are a lot of fabless companies enter this market. The phenomenon of over production is very severe. Richtek faces the competition from IDMs and fabless analog design houses from China recently.
Threat of Substitute Products: LOW
Because analog chip is unique in the process, the possibility of the replacement by the substitution is low, and the switching cost is high.
Bargaining Power of Suppliers: HIGH
The switching cost of wafer fabrication is high because technology barrier is high, but the switching cost of back-end, like assembly and testing is low because the level of differentiation is low. Richtek’s foundry partner is TSMC, and 40% of back-end vendors located in Taiwan, 50% in China, and 10% in Malaysia are quietly separated.
Bargaining Power of Buyers: Depends
The bargaining power is positively correlated to the purchasing quantity. In PC industry,
which kind industry, the possibility and ability of vertical integration of buyers is low.
The summaries of the literature review are
1. The switching cost in the analog IC industry is high no matter in the suppliers’ site, or buyers’ site.
2. The unit price of an analog chip is low, so that it is difficult to a fabless analog IC design house to cross the ceiling to achieve the economic of scale.
3. The reason of the success of a Taiwnese fabless IC design house is one or two successful products called “Star” usually. Most of them fail in developing another
“Star” before the previous “Star” becomes “Dog”.
4.3.2 Richtek’s Current Status
According to Richtek’s 2011 balance sheet listed in Table 4.5, we can find the revenue dropped 8.45%, YoY. It is because Richtek ‘s major market, computing, including PC and TFT LCD panel industry, which accounts 62% of Richtek’s revenue, didn’t perform well in 2011. According to IDC’s research, the worldwide growth rate of PC industry is only 1.8%. The situation of TFT LCD panel industry is worse. LCD TV, monitor, notebook panel shipments dropped 1.4%, 5.1%, 13.5%, YoY.
COGS keeps the same decreasing rate as the revenue, and gross margin keeps consistent, around 38%. Richtek was supposed that it didn’t face the severe price war from TI or other competitors who were forced to do so by TI. Many companies took many different methods to cut their cost, such as shrinking the line space by the process to reduce the chip size or manufacturing in a bigger size wafer like 8 inches to produce more chips once. However, Richtek’s SG&A increased 7.87%, YoY, causing the operating profit
decreasing 25.11% comparing to the number in 2011. Most of increased amount of SG&A was development expenses. It is a clue that Richtek has started to adopt the new process to cut the cost.
Table 4.5 Richtek’s financial statement, 2010~2011
2011 2010 YoY
Revenue 11,115,270 12,141,400 (8.45%)
CoGS (6,863,210) (7,493,388) (8.41%)
Gross profit 4,252,060 4,648,012 (8.52%)
Gross margin 38.25% 38.28% -
SG&A (2,522,086) (2,338,028) 7.87%
Operating profit 1,729,974 2,309,984 (25.11%)
Operating margin 15.56% 19.03% -
Unit: thousand NTD Source: Richtek financial statement, 2011
4.4 Five Forces Analysis of Analog IC Industry
In the end of this section, Porter’s five forces analysis is applied as a summary.
Risk of Entry by Potential Competitors: Low
TI, Richtek, or other existed analog IC companies have established IP protection and RD know-how after the operation in couple years. The new entrants will be limited in a niche market. TI’s major competitors are still other top analog chip companies.
Rivalry Among Established Firms: High
IDMs and fabless analog design houses are all competitors in the analog IC design
industry. Although TI has the highest market share, about 15%, the top three analog companies TI, STMicroelectronics, and Infineon, have only about 33% market share.
No single company dominates the market. In addition, life cycles of analog IC products is long and IC products are highly customized, so it would be hard for a single company to accommodate all the customizations.
Threat of Substitute Products: Depends
From the perspective of component scope, the analog chip is difficult to be replaced by the substitutions (e.g. integrated by the digital chips), but from the perspective of end application scope, a company with a wider product portfolio will have more advantages, such as TI, which involves in several different applications (e.g. automotive, 3C, and industry). Therefore, the impact of the recession of a single industry to TI is low.
However, Taiwanese companies are small and medium businesses, which focus on certain markets. For example, Richtek concentrate on PC industry. When there is a recession in PC industry, Richtek will be influenced a lot.
Bargaining Power of Suppliers: Depends
The major costs of a chip are wafers and packages. Because the wafer fabrication is relative to the specific technology and process, the switching cost of wafer is higher than that of packages. In this research, the definition of supplier is limited in the wafer fabrication only.
For IDM, we can use TI as an example. TI owns fabrication facilities and after acquiring several fabs from bankruptcy companies, TI reduces the transaction cost of fabricating wafers dramatically. We use Richtek and TSMC to describe the relationship between a fabless design house and a foundry. To TMSC, the total capacity of the manufacturing facilities managed by TSMC, including subsidiaries and joint ventures, reached 13.2 million eight-inch equivalent wafers in 2011. TSMC operates three advanced 12-inch
wafer GIGAFAB™ facilities (fab 12, 14 and 15), four eight-inch wafer fabs (fab 3, 5, 6, and 8), and one six-inch wafer fab (fab 2). TSMC also manages three eight-inch fabs at wholly owned subsidiaries: WaferTech in the United States and TSMC China Company Limited, and its joint venture fab, SSMC in Singapore. TSMC produces analog chips in fab 2(6”) and fab3 (8”). The portion of revenue from analog chips fabrication is still small compared the digital chips.
If one 8” wafer can produce 13,000 pieces of chips, we can calculate Richtek purchased equivalent 191 thousand pieces of 8” wafers in 2010. TSMC produced equivalent 11,300 thousand pieces of 8” wafers in 2010. Richtek accounted 1.69% only. In the scope of revenue, TSMC’s gross sale in 2010 is NT$431,630,858,000. Richtek only contributed NT$2,943,683,000 which accounted 0.68% of TSMC in 2010. We can find it although Richtek is the top fabless analog IC design house, the contribution in the revenue to TSMC is still low. If Richtek’s 191 thousand piece of 8” wafer are 100%
outsourced to TSMC fab2 and 3, it will account 10.93% (TSMC fab2’s and 3’s 8”
equivalent wafer productions are 1748 pieces). So, we think Richtek’s bargaining power to its major vendor, TSMC, is moderate to low.
Bargaining Power of Buyers: Depends
A wider portfolio can make the combination to sell to increase the bargaining power to buyers. For example, although some commodities’ prices are quite low like MOSFET, the company can suffer low gross margin of these products, and earn the profit from the niche products like DSP or PMIC by product bundling. In certain industries, such as LCD panels, motherboard, laptops, and graphic cards, are dominated by the conglomerates. Their procurement volume is huge, and they are price sensitive.
Unfortunately, Richtek’s current product portfolio focus on these kind market.
come out that in analog semiconductor industry an intense of competition among the existed companies is quite high, and new entrant is limited in the narrow market to develop the niche product. Therefore, a consolidation will form in this industry, and key successful factor is which company has the advantage in the supply chain. The horizontal axis in Porter’s five forces analysis mentions the relationship of the supply chain from upstream to downstream. The main costs of an analog IC are the wafer cost and the package cost. After the successive acquisitions, TI has the lower wafer cost compared to Richtek. So, the package cost is the determination in both companies’
outsourcing policy. Another uncertain factor is the substitution, the divergence of revenue of Richtek is still not enough, and Richtek’s revenue almost generates from electronics related markets. Compared to Richtek, TI’s product portfolio is wider. TI involves not only electronics related markets, but also medical, military, and automobile, so that the variation of TI’s growth momentum is less than Ricthtek, and the threat of substitution is lower than Richtek. In next chapter, we will discuss how the merging and acquisition decision should be made and how it can help Richtek in the future competition with TI.
Chapter 5 Merging and Acquisition Decision
In this chapter, Richtek is assumed as a M&A buyer to evaluate the efficiency, benefit and possibility to acquire or merge the five public listed fabless analog IC design houses in Taiwan stock market.
The first public listed Taiwanese analog IC design house merging case happened in 2008. The buyer is Global Mixed-mode Technology (abbreviated GMT) (8081TT), and the candidate is Aimtron (3298TT). The president of Aimtron, Chen, Huey-Lin, published a thesis “The Growth Strategies of Analog IC Design Companies” (2009) to express how and why she made this decision. In her thesis, she listed three major ceiling to exam the growth of a Taiwanese fabless analog IC design house. The first one is NT$1 billion, the second one is NT$3 billion, and the third one is NT$30 billion. The reasons are
(1) Momentum of expanding new market is low. Taiwanese fabless analog IC design house usually rises from a niche market, and replaces the foreign companies by the low price strategy. The niche market’s size is limited. When the market is saturated, the momentum of growth is limited, too.
(2) Profitability is not consistent. The hypothesis “boxer champion in one generation”
(2008) proposed by Tsai, Ming-Kai, the president of Mediatek, says one fabless design house could enjoy high EPS by one or two “Star”, but still falls finally because of failing in developing new profitable product continuously.
(3) When a niche market is profitable, a leader will bring its advantage in economic of scale/scope to enter this market by the price competition. The result is both of existing company (small company) and new entrant (leader) are not profitable, and
Although Aimtron has crossed the first ceiling, NT$1 billion, in 8 years since setup, it never crossed the next ceiling, NT$3 billion, all the time. Because the competition in the industry became more and more severe, she decided to sell Aimtron to GMT to expand economic of scale/scope of GMT, and maximize the shareholders’ benefit. Also, she would like to keep the well-experienced employees continuing their careers.
The criterion of screening the target companies are from the several scopes.
(1) Capital:
Concerning the cost of M&A, and the possibility of success, this research chooses the capitals of companies are between NT$300 million and NT$500 million, but this research will raise the example that the capital is greater than NT$500 million beyond this rule to exam the hypothesis.
(2) Product portfolio:
In this research, we discuss about the analog semiconductor industry, so the main products of the target companies are the analog chips will be chosen. We also evaluate it is effective if Richtek merges a company which produces the lower gross margin products, like MOSFET (Metal-Oxide Semiconductor Filed Effect Transistor) mainly.
(3) Application:
Although Taiwanese companies are good at the computing industry because of the structure of the industry, this research still tries to find the target companies which are good at the different applications to see the synergy in the differentiation.
Combining the three factors, the five chosen companies are 1. Advanced Analog Technology, 3438TT (abbreviated AAT)
2. Leadtrend Technology Corporation, 3588TT (abbreviated Leadtrend) 3. Macroblock Inc, 3527TT (abbreviated Mblock)
4. Global Mixed-mode Technology, 8081TT
5. Advanced Power Electronics Corp, 8261TT (abbreviated APEC)
The first 3 candidates meet the criteria, a small and medium business, and we want to discuss if a merger happens between Taiwanese first and second largest analog IC design house how much synergy they can gain. So, GMT is put on the list. On the other hand, TI’s also has MOSFET business, so a professional MOSFET company, APEC, is put on the list to discuss the possibility of synergy.
Table 5.1 Target companies’ capital, 2011
Company Capital
Richtek Technology Corporation 1,495
Advanced Analog Technology 386
Leadtrend Technology Corporation 446
Macroblock Inc 332
Global Mixed-mode Technology 862 Advanced Power Electronics Corp 1,444
Unit: million NT Source: companies’ annual reports
Including Richtek, the six companies’ revenues are listed in Table 5.1. Richtek is the leading company, and the revenue is twice larger than GMT which is the number two in Taiwan. According to Chen’s study, she sets three ceilings of the revenue, NT$1 billion,
NT$3 billion, and are still far away from NT$30 billion.
Table 5.2 Case companies’ revenue, 2007~2011
Company 2011 2010 2009 2008 2007
Richtek 11,115,270 12,141,400 8,004,440 6,808,767 6,062,073 GMT 4,759,087 5,013,639 4,099,962 3,323,524 2,797,925
AAT 1,076,054 1,243,462 799,927 1,065,463 1,130,763
Leadtrend 973,660 1,242,042 972,111 847,702 741,087 Mblock 2,103,993 1,851,878 1,285,284 1,293,664 1,204,661 APEC 2,993,677 3,607,455 3,059,318 3,022,857 3,735,616
Unit: thousand NT Source: companies’ annual reports
In the following paragraphs, the factors listed in Chapter 3 are used to measure the efficiency and benefit.
5.1 Analysis of Advanced Analog Technology
AAT was founded in 1999, and is a known provider of a variety of integrated circuits (ICs) and buffers. It manufactures a wide spectrum of products, including power supply drive modules, power supply management ICs, power supply detective ICs and power supply protective ICs. Advanced Analog is specialized in power management IC design technology. It operates in analog IC design industry. AAT offers a range of products for various applications such as manufacturing of LCD panels, digital still cameras, and portable DVD players, networking devices, Li-Ion battery, and white LED driver and switching power supplies. The products are divided in seven lines namely, Linear
Regulator, Switching Regulator, Multi-Function Regulator, Battery Management Supervisor, LED Driver and Others The Liner Regulator line offers Multi channel LDO, 2A LDO, 1A LDO, 500mA LDO and 300mA LDO. The Switching Regulator line offers charge pumps, buck controllers, buck converters, boost controllers and boost converters. TFT-LCD panel power regulators and Multichannel DC-DC regulators are part of the Multi-Function Regulator line. It also offers Li-ion battery chargers, protection devices, switching power supervisors, Reser ICs, Multi-string WLED drivers, LED drivers and single string LED drivers through its remaining product lines.
Table 5.3 AAT’ annual revenue, 2010~2011
2011 2010 YoY
Revenue 1,076,054 1,243,462 (15.56%)
CoGS (761,825) (789,541) (3.64%)
Gross profit 314,229 453,921 (44.46%)
Gross margin 29.20% 36,.50% -
SG&A (213,726) (210,084) 1.70%
Operating profit 100,503 243,837 (142.62%)
Operating margin 9.34% 19.61% -
Unit: thousand NTD
(1) The growth:
Compared to 2011’s revenue, AAT around accounts Richtek’s 9.68%. AAT’s gross margin and operating margin are both lower than Richtek. Therefore, it’s not obvious to Ricthtek’s growth if Richtek merges AAT. AAT’s P/E and P/B keep
Richtek from P/E perspective that AAT’s (~12x) is lower than Richtek’s (~17x), and the profit earning ability is lower than Richtek from P/B perspective that AAT’s (~1.5x) is lower than Richtek’s (~3x).
Source: Fubon Research 2011/08 Fig. 5.1 AAT’s P/E, 2005~2012
Source: Fubon Research 2011/08 Fig. 5.2 AAT’s P/B, 2005~2012
(2) Vertical integration
AAT’s major vendor is TSMC which is the same as Richtek. AAT spent NT$226,515 thousand purchasing wafers from TSMC in 2010. This amount is 7.69% of Richtek’s expense (NT$2,943,683,000)
(3) Horizontal integration
AAT’s main products are LDO and DC-DC regulators and controllers and applied in TFT-LCD mainly. The product portfolios and customers overlap Richtek mostly.
(4) Debt/asset ratio
AAT’s debt/asset ratio is 21% till 31/03/2011, and Richtek’s debt/asset ratio is 28.07% in the same period. So, it won’t bring a heavy loading to Richtek to pay the debt and interest if Richtek merges AAT. However, AAT’s debt/asset ratio increase year by year. It could mean AAT face the difficulty to operate gradually.
(5) Merging cost
Concerning the closing price on 30/03/2012, AAT’s is NT$44.9 per share, and Richtek’s is NT$182.0 per share which is 4.1 times of AAT. AAT’s capital is NT$397,151,000, and Richtek should pay 96,866,098 shares to merge it which accounts 6.58% of Richtek’s shares without premium.