109 (16%)
The Department raises revenue through taxes, duties and fees in accordance with the relevant legislation. In 2000-01, the Earnings and Profits Tax assessed increased by $10.9 billion (16%), as compared with the previous year. On the other hand, the total of duties and fees collected during the year was much the same as the previous year.
Profits Tax
Profits Tax is levied on individuals, corporations, bodies of persons and partnerships, in respect of assessable profits arising in or derived from Hong Kong. In 2000-01, the Profits Tax rates for corporations and non-corporate persons remained unchanged at 16% and 15% respectively..
A ssessing Functions
3
ASSESSING FUNCTIONS
12
2000 01
16% 15%
13
3
ASSESSING FUNCTIONS
5
Figure 5 Profits Tax assessed
Unincorporated Businesses
Corporations 80
60
40
20
0
44.7
36.1 4.2
40.5
1997-98 1998-99 1999-2000 2000-01 ($b)
57.0 6.1 46.2
7.0
5.2
50.9 39.2
30.9
2000 01
447 5
86 (24%)
37.6% 6
3 4
Reflecting an improvement in the state of the economy, Profits Tax of $44.7 billion was assessed during the year, representing an increase of $8.6 billion (24%) over the figure for the previous
year (Figure 5). Of the total tax assessed, the property and banking sectors together contributed 37.6% (Figure 6).
Further statistics relating to the tax assessed in respect of different business sectors are shown in Schedules 3 and 4.
Salaries Tax
Salaries Tax is charged on all income arising
in or derived from Hong Kong from any office (e.g. a directorship), employment or pension. The total tax payable is restricted to an amount not exceeding 15% (i.e. the standard rate of Salaries Tax) of the total income of the individual concerned.
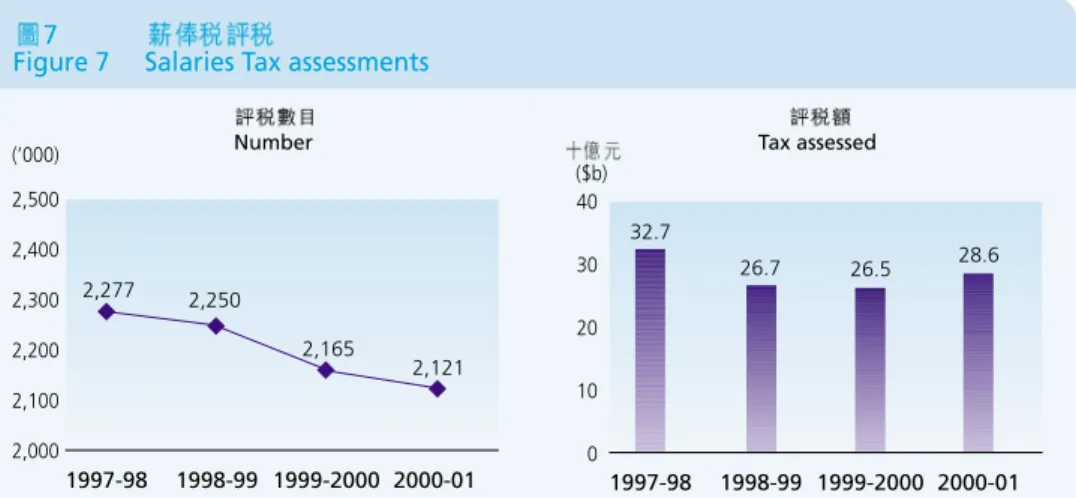
As compared with the previous year, the number of assessments made decreased slightly. However, as a result of an increase in the average level of income 7.9% more tax was assessed than in the previous year (Figure 7). Analyses of tax assessed and allowances granted in respect of taxpayers at various income levels are provided in Schedules 5 and 6.
15%
7.9% 7
5 6
6
Figure 6 Profits Tax assessed ratio by business sectors
Property (22.5%) Public Utilities (11.9%)
Others ( 17.6%) Manufacturing
( 11.6%)
Distribution (21.3%)
Banking (15.1%)
2000-01
7
Figure 7 Salaries Tax assessments
1997-98 1998-99 1999-2000 2000-01 2,500
2,400 2,300 2,200 2,100 2,000
2,121
(’000) Number Tax assessed
28.6 32.7
26.7 26.5
($b)
1997-98 1998-99 1999-2000 2000-01 40
30
20
10
0 2,277 2,250
2,165
10,316
11,602 12.5%
21.6%( 8)
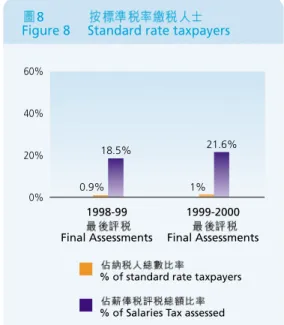
With the increase in the level of salaries, there was an increase of 12.5% in the number of standard rate taxpayers, from 10,316 last year to 11,602 this year. These taxpayers contributed 21.6% of the Salaries Tax assessed (Figure 8).
Notification Requirements of Employers
Apart from reporting commencements and cessations of employments, employers are required to prepare annual retur ns to report the emoluments of each of their employees. In 2000-01, 206,833 employers filed employer’s retur ns with the Department. During the year, the Department continued its past practice of conducting seminars to assist new employers in completing the returns.
In February 2001, letters were sent to 37,405 new employers inviting them to attend seminars which were held at the Concert Hall of the City Hall on 11 April 2001.
Property Tax
Property owners are subject to Property Tax which is charged at the standard rate of 15% in respect of the net assessable value of the property. Unincorporated businesses that pay Property Tax in respect of their business premises can have such payments set off against their Profits Tax liabilities.
Income arising from properties owned by corporations is subject to Profits Tax at the corporate rate in lieu of Property Tax. Statistics on the classification and ownership of properties, based on the records of the Department, are provided in Schedule 7. The number of assessments made during the year increased by 3%, as compared with the previous year. Reflecting reduction in rental income, the amount of Property Tax assessed dropped by 6.2%
(Figure 9).
% of standard rate taxpayers
% of Salaries Tax assessed
8
Figure 8 Standard rate taxpayers
1998-99 1999-2000
Final Assessments Final Assessments 60%
40%
20%
0% 1%
21.6%
0.9%
18.5%
3
ASSESSING FUNCTIONS
14
206,833
2001 2 37,405
4 11
15%
7
2 0 0 0 0 1 3%
6 . 2 % 9
550
500 450 400 350 300
474 (’000)
9
Figure 9 Property Tax assessments
494 488
471 Number
1.36 1.87
1.55 1.45
($b)
1997-98 1998-99 1999-2000 2000-01 3
2
1
0
Tax assessed
15
3
ASSESSING FUNCTIONS
1997-98 1998-99 1999-2000 2000-01
10
Figure 10 Assessments made under Personal Assessment
400
350
300
355 384
367
341
(’000) Number
3.53
4.31 4.00
3.27 ($b)
5 4 3 2 1
0
Tax assessed
1997-98 1998-99 1999-2000 2000-01
1997-98 1998-99 1999-2000 2000-01
4.1%
8% 10
Personal Assessment
An individual may elect for Personal Assessment in respect of his or her total income. Under Personal Assessment, all of the income of the taxpayer and his or her spouse is aggregated into a single sum and, after the deduction of all allowances, is assessed at the marginal tax rates.
In appropriate circumstances, this reduces the total tax liability of the individual (e.g. an individual who would otherwise be chargeable at the standard rate on each separate income source). As a result of an increase in the number of elections, the number of assessments made in 2000-01 was 4.1% more than the previous year.
The amount of tax assessed increased by 8% (Figure 10).
30,000 10,000
6
92 11
Advance Ruling
The advance ruling service allows a person to apply for a ruling on the way in which a provision of the Inland Revenue Ordinance applies in relation to a particular arrangement.
A fee is charged for the service on a “cost recovery” basis.
Initially, the applicant is required to pay an application fee of
$30,000, for a ruling concerning the “Territorial Source Principle”, or $10,000 for a ruling on any other matter.
The Department endeavours to provide a ruling within 6 weeks of the date of application, provided that all relevant information is furnished with the application and further consultation with the applicant is not required.
During the year, 92 advance ruling applications were processed (Figure 11). Most of the applications were for rulings on Profits Tax matters.
3
ASSESSING FUNCTIONS
16
11
Figure 11 Advance Ruling
1999-2000 2000-01
Number Number
5 17
Awaiting decision at the beginning of the year
69 81
Add: Applications received during the year
74 98
– Less: Disposed of –
Ruling made 44 79
Application withdrawn 7 6
Ruling declined 6 57 7 92
17 6
Awaiting decision at the end of the year
2000 01
6 9 12
Objections
A taxpayer who is aggrieved by an assessment made under the Inland Revenue Ordinance may lodge an objection to the Commissioner. A significant proportion of the objections received each year arise from estimated assessments issued to taxpayers who have failed to lodge their tax returns in time. An objection of this nature must be supported by a completed return and, where applicable, by supporting accounts. Most of these objections are settled promptly by reference to the returns submitted.
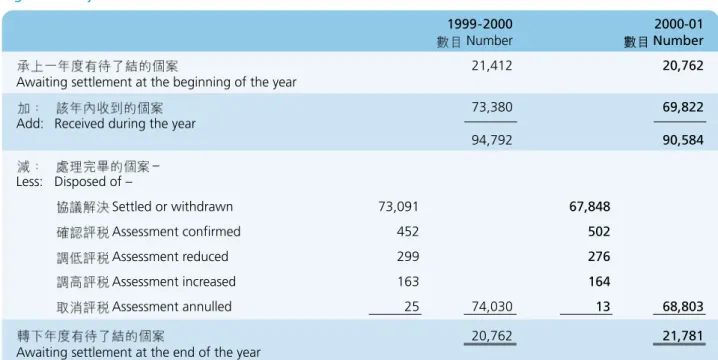
Other objections are also generally settled by agreement between the taxpayers and assessors concerned. Relatively few objections are ultimately referred to the Commissioner for determination. During the year, the Department processed some 69,000 objections (Figure 12).
12
Figure 12 Objection statistics
1999-2000 2000-01
Number Number
21,412 20,762
Awaiting settlement at the beginning of the year
73,380 69,822
Add: Received during the year
94,792 90,584
– Less: Disposed of –
Settled or withdrawn 73,091 67,848
Assessment confirmed 452 502
Assessment reduced 299 276
Assessment increased 163 164
Assessment annulled 25 74,030 13 68,803
20,762 21,781
Awaiting settlement at the end of the year
17
3
ASSESSING FUNCTIONS
2001 3 31
1 9 127
2000
0 1 2 7 7
13
Appeals to the Board of Review
A taxpayer who is dissatisfied with the Commissioner’s determination of his objection may appeal to the Board of Review (Inland Revenue Ordinance) to have the determination reviewed. As at 31 March 2001, the Board consisted of a chairman and 9 deputy chairmen (who have legal training and experience) and 127 other members. During the year, the Board processed 277 appeals (Figure 13).
13
Figure 13 Appeals to the Board of Review
Number
2000 4 1 157
Awaiting hearing or decision as at 1 April 2000
265 Add: Lodged during the year
422 –
Less: Disposed of –
Withdrawn 89
Assessment confirmed 106
Assessment reduced in full 17
Assessment reduced in part 32
Assessment increased 27
Assessment annulled 4
Others 2 277
2001 3 31 145
Awaiting hearing or decision as at 31 March 2001
3
ASSESSING FUNCTIONS
18
2 0 0 0 0 1 3
14 2000 01
Appeals to the Courts
An appellant or the Commissioner may appeal to the Courts against a decision of the Board of Review. During the year, the Court of First Instance ruled on 3 appeal cases. The issues considered included the taxability of profits on the sale of certain properties; the Board’s jurisdiction to substitute its own valuation on a property, rather than use that of the Appellant or the Commissioner; and whether certain receipt was capital in nature.
The Court of Final Appeal decided in favour of the Commissioner in relation to 2 cases which were concerned with the deductibility of interest expenses which had been capitalised as part of the cost of trading stock.
Figure 14 sets out statistics concerning appeals to the Courts for 2000-01.
14
Figure 14 Appeals to the Courts
Court of Court of Total
First Final
Instance Appeal
2000 4 1 8 2 10
Awaiting hearing or decision as at 1 April 2000
15 – 15
Add: Lodged during the year
23 2 25
– Less: Disposed of –
Decided 3 2 5
Discontinued 8 11 – 2 8 13
2001 3 31 12 0 12
Awaiting hearing or decision as at 31 March 2001
19
3
ASSESSING FUNCTIONS
2,000 250
5,200 750
2001 3 31 7,098
5,631 2 , 0 8 6 8
1.5% ( 15)
Business Registration
The Department aims to maintain an efficient business registration system. Every person carrying on business in Hong Kong must register the business and pay the required fee. Registered businesses may renew their registration certificates either annually or once every 3 years. The registration fee and levy for the Protection of Wages on Insolvency Fund are respectively $2,000 and $250 if paid annually, or $5,200 and $750 if paid every three years. Up to 31 March 2001, 7,098 businesses had taken the 3-year certificates.
Reflecting improvement in the economy, the total of new and re-opened registrations in the year was 5,631 higher than that of the previous year. Moreover, the number of cancelled business registrations fell by 2,086 (Schedule 8).
The total number of active registrations recorded a growth of 1.5% for the year (Figure 15).
15
Figure 15 Active Business Registration
Unincorporated Businesses
Corporations 800
600
400
200
0
624,987 615,958
249,663 252,943
375,324 363,015
31.3.2000 31.3.2001 (’000)
3
ASSESSING FUNCTIONS
20
2,450 16
10,000 30,000
9,039 17%
2000
01 5 4
17
There was a corresponding increase in the number of certificates issued, resulting in an increase of $24.5 million in the amount of business registration fees collected (Figure 16).
A small business with sales or receipts below a specified limit ($10,000 for a business mainly deriving profits from the sale of services or $30,000 for other businesses) may apply for exemption from payment of the fee and levy.
The number of exemptions granted during the year was 9,039. This represents an increase of 17% over the previous year.
Where an application for exemption is not allowed, the business operator may appeal to the Administrative Appeals Board. During the year, 5 appeals were received by the Board, 4 of which were subsequently withdrawn by the appellants concerned (Figure 17).
16
Figure 16 Certificates issued and Fees collected
1999-2000 2000-01
Increase
( ) 687,150 703,075 2.3%
Number of certificates issued (Main and Branch)
( ) 1,276.2 1,300.7 1.9%
Fees (inclusive of penalties) ($m)
17
Figure 17 Appeals to the Administrative Appeal Board
Number
2000 4 1 0
Awaiting hearing as at 1 April 2000
5 Add : Lodged during the year
5 4 Less: Appeal withdrawn
2001 3 31 1
Awaiting hearing as at 31 March 2001
21
3
ASSESSING FUNCTIONS
18
Stamp Duty
CollectionsStamp Duty is charged on instruments effecting property and stock transactions and leasing of property (Figure 18).
18
Figure 18 Composition of Stamp Duty collections
Immovable Properties (45.8%) Leases etc.
(2.4%)
Shares (51.8%)
2000-01
3
ASSESSING FUNCTIONS
22 2000 01
1.6%
10%
18.6%
10% 19 9
4.7% 10
During the year, the property market was relatively stable and the duty collected from property transactions increased slightly by 1.6%. The stock market was less active than the preceding year. This, coupled with a 10% reduction in the stamp duty rate on stock transactions, resulted in a reduction of 18.6% in duty collected from stock transactions. Overall, stamp duty collected during the year decreased by 10%, as compared with the previous year (Figure 19 and Schedule 9). However, there was an increase of 4.7% in the number of documents stamped (Schedule 10).
5% 15%
750
Estate Duty
Estate Duty is charged on that part of a deceased person’s estate situated in Hong Kong. The threshold for levying duty is $7.5 million, and the duty rates range from 5% to 15%, depending on the value of the estate.
19
Figure 19 Stamp Duty collections
1999-2000 2000-01
$m $m Increase/Decrease
Immovable Properties 4,917 4,997 +1.6%
Shares 6,949 5,654 -18.6%
Leases etc. 250 260 +4.0%
Total 12,116 10,911 -9.9%
23
3
ASSESSING FUNCTIONS
20
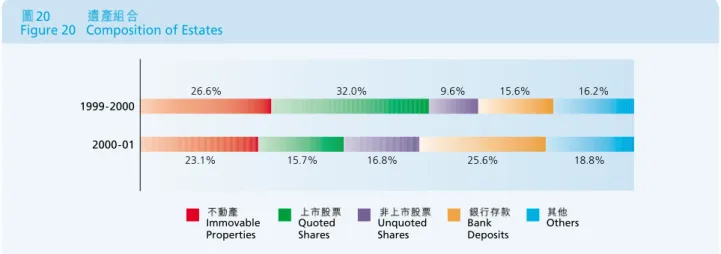
Figure 20 Composition of Estates
20 21
1 5
11 2.31 (18%)
6
12.58 12
Figures 20 and 21 show the composition of estates and cases processed for the past two years.
Estate Duty of $1.5 billion was collected during the year (Schedule 11), an increase of $231 million (18%) over that of the previous year.
As Estate Duty is payable on delivery of an estate duty affidavit or account (or within 6 months from the date of the deceased’s death, whichever is the earlier), $1,258 million was received during the year in advance of the issue of formal assessments (Schedule 12).
21
Figure 21 Estate Duty cases
1999-2000 2000-01
New cases 14,157 13,880
Cases finalised
Dutiable 354 318
Exempt 13,889 13,246
14,243 13,564
3
ASSESSING FUNCTIONS
24
1999-2000
2000-01
Immovable Properties
Quoted Shares
Bank Deposits
Others Unquoted
Shares
26.6% 32.0% 9.6% 15.6% 16.2%
23.1% 15.7% 16.8% 25.6% 18.8%
1999
3
2 0 0 0 0 1 22
13
5.8% 23
In respect of an appeal case lodged by a dutypayer in 1999, the Court of Final Appeal handed down a decision in favour of the dutypayer. The case concerned the issue of whether certain property disposed of by the deceased within 3 years prior to his death was liable to Estate Duty.
Betting Duty
Betting Duty is charged on bets made on totalisators at race meetings conducted by the Hong Kong Jockey Club and on the proceeds of lotteries conducted by the Hong Kong Lotteries Board.
The rates of duty for 2000-01 are shown below (Figure 22).
Compared to last year, there were increases in respect of both the amounts placed on racing bets and lottery ticket sales (Schedule 13). As a result, the total betting duty collected in 2000-01 was 5.8% more than that of the previous year (Figure 23).
22 2000 01
Figure 22 Rates of Betting Duty in 2000-01
Rate 12%
Standard Bets win, place, double, quinella and quinella place
T T T 19%
Exotic Bets six up, treble, tierce, trio, double trio and triple trio
25%
Lotteries
25
3
ASSESSING FUNCTIONS
23
Figure 23 Betting Duty collections
1999-2000 2000-01
$m $m Increase
10,748.1 11,382.5 +5.9%
Horse Racing
1,189.7 1,247.6 +4.9%
Lotteries
11,937.8 12,630.1 +5.8%
Total
3%
2000 01
4.7% 24
4.4% 25
14
22% 26
Hotel Accommodation Tax
Hotel Accommodation Tax is imposed on hotel and guest house accommodation at the rate of 3% of the accommodation charges paid by guests. The tax is collected quarterly in arrears.
In 2000-01, there was a drop in the number of hotels and boarding houses operating in Hong Kong. However, due to a rise in room occupancy rate of 4.7% (Figure 24), the number of taxable rooms increased by 4.4% (Figure 25).
This factor, together with a slight increase in hotel room charges (Schedule 14), resulted in an increase of 22% in the tax collected, as compared with the previous year (Figure 26).
26
Figure 26 Hotel Accommodation Tax collections
700 600 500 400 300 200 100
222.5 511.3
219.0
182.4
1997-98 1998-99 1999-2000 2000-01 ($m)
24
Figure 24 Room occupancy rates
1999-2000 2000-01
Increase
9,779,071 11,141,928 +13.9%
Room Days
79.4% 84.1% +4.7%
Occupancy Rate
25
Figure 25 Hotels, boarding houses, taxable rooms and exempted rooms
1999-2000 2000-01 Increase/Decrease
168 156 -7.1%
Hotels and Boarding Houses
36,339 37,932 +4.4%
Taxable Rooms
5,475 5,483 +0.1%
Exempted Rooms
3
ASSESSING FUNCTIONS
26
36 2000 01
15 27
Tax Reserve Certificates
There are two sets of circumstances under which Tax Reserve Certificates are purchased.
The first applies to taxpayers who wish to save for the payment of their future tax liabilities. Two service schemes are offered to these taxpayers: the ‘Electronic Tax Reserve Certificates Scheme’ for all taxpayers and the ‘Save-As-You- Earn’ (SAYE) Scheme for civil servants and civil service pensioners. Under the Electronic Tax Reserve Certificates Scheme, certificates can be purchased using various electronic means, i.e. by bank autopay, telephone, the Internet, public information kiosk or bank ATM. Under the SAYE Scheme, certificates are purchased by civil servants and civil service pensioners through monthly deductions from their salaries / pensions. Interest is payable on the certificates when they are redeemed for settlement of tax liabilities, based on the interest rate prevailing at the time of purchase, for a maximum period of 36 months from the date of purchase.
In 2000-01, there was an increase in the number of certificates sold under both the Electronic Tax Reserve Certificates Scheme and the SAYE Scheme (Schedule 15).
However, reflecting the reduction in interest rate during the year, the amount of certificates sold dropped (Figure 27).
The second situation applies to taxpayers who object to tax assessments and are required to purchase Tax Reserve Certificates in respect of the tax in dispute. Such certificates are used to settle any tax found payable upon finalization of the objection or appeal. Interest is only payable on the amount, if any, subsequently required to be repaid to the taxpayer, and is computed at floating rates ruling over the tenure of the certificate.
27
3
ASSESSING FUNCTIONS
27
Figure 27 Certificates sold
1999-2000 2000-01 100
90 80 70 60 50 40 30 20 10 0
799 87,300
1,048 77,695 (’000)
Number
($m)
1999-2000 2000-01 3,000
2,000
1,000
0
Amount
1,218.2
352.4 1,901.1
471.7
Certificates relating to Objections and Appeals
Certificates other than for Objections and Appeals
SCHEDULES
66
3
SCHEDULE 3 CORPORATIONS
PROFITS TAX CONTRIBUTIONS FROM VARIOUS BUSINESS SECTORS
Business Sectors Final Tax Assessed for Year of Assessment
1997-98 1998 -99 1999-2000
/$’000 (%) /$’000 (%) /$’000 (%)
– Distribution : –
777,250 1.8 454,555 1.2 607,426 1.7
Retail
6,805,946 15.4 5,568,802 14.9 6,805,640 19.3 Wholesale, Import and Export
129,765 0.3 91,687 0.2 96,187 0.3
Foreign Corporations carrying on Import and Export
2,789,153 6.3 3,948,746 10.6 4,208,967 11.9 Public Utilities
14,024,954 31.7 12,125,076 32.6 7,935,717 22.5 Estate Development, Investment and Finance
(other than Banking)
8,913,920 20.2 5,754,688 15.5 5,336,349 15.1 Banking
– Manufacturing : –
672,065 1.5 634,331 1.7 904,825 2.6
Clothing and Textiles
246,034 0.6 188,666 0.5 218,725 0.6
Food and Beverage Products
205,288 0.5 222,701 0.6 264,295 0.7
Steel and Other Metals
440,731 1.0 320,752 0.9 327,767 0.9
Printing and Publishing
2,467,264 5.6 2,098,263 5.6 2,399,590 6.8
Others
496,570 1.1 432,966 1.2 505,218 1.4
Shipping (including Shipping Agents, Shipbuilding, Docking, Travel Agents, Air Forwarding Agents and Airline Booking Agents)
944,740 2.1 603,709 1.6 606,310 1.7
Hotels, Restaurants and Amusement Centres
782,613 1.8 876,696 2.4 974,714 2.8
Stevedoring, Wharfing and Godowns
457,346 1.0 475,455 1.3 399,443 1.1
Clubs and Associations
263,409 0.6 237,800 0.6 197,551 0.6
Insurance Companies and Insurance Agents
176,732 0.4 202,024 0.5 221,505 0.6
Non-resident Corporations Trading through Agents (including Consignment Tax)
1,166,994 2.6 1,072,469 2.9 1,139,245 3.2
Building Contractors and Engineering Works
59,558 0.1 49,833 0.1 58,902 0.2
Aircraft Owners and Operators
29,478 0.1 29,402 0.1 36,357 0.1
Taxis, Hire Cars, Public Light Buses and Motor Boats
2,350,971 5.3 1,857,298 5.0 2,085,687 5.9
Miscellaneous
44,200,781 100.0 37,245,919 100.0 35,330,420 100.0 Total
67
SCHEDULES
4
SCHEDULE 4 UNINCORPORATED BUSINESSES
PROFITS TAX CONTRIBUTIONS FROM VARIOUS BUSINESS SECTORS
Business Sectors Final Tax Assessed for Year of Assessment
1997-98 1998 -99 1999-2000
/$’000 (%) /$’000 (%) /$’000 (%)
160,725 5.9 22,346 1.0 33,893 1.7
Estate Developers, Property Dealers, Estate Agents and Subletting Businesses
256,345 9.5 130,099 6.1 149,426 7.4
Finance and Securities including Brokers, Dealers and Insurance Agents
67,388 2.5 64,186 3.0 49,069 2.4
Builders, Decorators and Civil Engineering Works –
Distribution : –
152,928 5.6 118,877 5.6 126,074 6.2
Import and Export
82,172 3.0 56,543 2.7 49,639 2.4
Wholesale
140,034 5.2 101,228 4.8 110,418 5.4
Retail – Manufacturing : –
4,265 0.2 3,029 0.1 3,180 0.2
Agricultural Trades and Food & Beverage Products Manufacturers
33,311 1.2 23,505 1.1 20,272 1.0
Cloth and Clothing
46,820 1.7 35,632 1.7 36,636 1.8
Chemical Products and Mechanical Engineering
22,107 0.8 14,203 0.7 14,353 0.7
Printing and Publishing
62,565 2.3 49,081 2.3 47,399 2.3
Others
68,121 2.5 60,070 2.8 36,453 1.8
Hotels, Restaurants and Amusement Centres
38,004 1.4 29,443 1.4 27,589 1.4
Transport (including Wharfing and Godowns) –
Professions : –
234,668 8.7 251,930 11.8 230,211 11.4
Accountants
28,032 1.0 27,314 1.3 18,614 0.9
Architects, Engineers, Surveyors etc.
615,077 22.7 584,736 27.5 535,701 26.4
Doctors and Dentists
609,015 22.4 476,129 22.4 459,673 22.7
Solicitors and Barristers
79,496 2.9 68,250 3.2 67,723 3.3
Other Professions
12,357 0.5 10,732 0.5 11,171 0.6
Miscellaneous
155 – 49 – 48 –
Non-resident Businesses (Note)
2,713,585 100.0 2,127,382 100.0 2,027,542 100.0 Total
20A(3)
Note : Consignment Tax under Section 20A(3) of the Ordinance
SCHEDULES
685 1999-2000
SCHEDULE 5 ANALYSIS OF SALARIES TAX ASSESSMENTS FOR THE YEAR OF ASSESSMENT 1999-2000 BY INCOME GROUP
Concessionary Deductions
6
Annual Income No. of Percentage No. of Total Income Total Self Total Home Elderly Total Final Percentage Average
Taxpayers of Elections (After Deductions Allowances Education Donations Loan Residential Net Tax of Tax per
Taxpayers for Joint other than (See analysis Expenses to Interest Care Chargeable Total Taxpayer
Assessment Self Education per Charities Expenses Income Final Tax
Expenses and Schedule 6) Concessionary
Deductions)
(%) (%)
($) ($’000) ($’000) ($’000) ($’000) ($’000) ($’000) ($’000) ($’000) ($)
108,001 – 110,000 9,721 0.83 0 1,060,594 1,049,868 49 67 1 0 10,609 209 0.00 21
110,001 – 120,000 56,513 4.84 0 6,515,815 6,103,515 8,369 3,816 824 4 399,287 7,966 0.03 140
120,001 – 130,000 57,545 4.93 0 7,200,684 6,214,890 23,269 13,922 7,095 104 941,404 18,808 0.07 326
130,001 – 140,000 50,494 4.33 0 6,814,302 5,475,777 34,196 15,900 20,284 319 1,267,826 25,338 0.09 501
140,001 – 150,000 49,862 4.27 0 7,222,200 5,517,591 46,775 16,917 42,089 388 1,598,440 36,301 0.14 728
150,001 – 180,000 127,278 10.91 0 20,988,616 14,686,186 153,893 60,832 346,546 2,504 5,738,655 206,892 0.77 1,625
180,001 – 210,000 108,351 9.28 0 21,021,565 13,568,719 159,218 79,376 523,257 4,830 6,686,165 336,822 1.25 3,108
210,001 – 240,000 96,101 8.23 4,958 21,605,470 13,642,037 154,396 88,672 635,026 5,641 7,079,698 456,154 1.70 4,746
240,001 – 270,000 94,486 8.09 9,624 23,979,520 15,223,055 166,372 104,577 735,722 7,918 7,741,876 578,695 2.16 6,124
270,001 – 300,000 82,381 7.06 12,437 23,433,459 14,972,362 158,808 103,925 700,438 8,091 7,489,835 623,737 2.32 7,571
300,001 – 400,000 176,836 15.15 29,861 60,890,506 34,867,731 362,436 303,383 2,502,160 32,945 22,821,851 2,284,948 8.51 12,921 400,001 – 500,000 86,663 7.42 12,676 38,550,822 17,815,579 203,040 216,821 1,988,148 23,809 18,303,425 2,237,693 8.34 25,820 500,001 – 600,000 48,516 4.16 5,354 26,458,881 9,937,419 108,414 148,627 1,286,938 15,830 14,961,653 2,035,941 7.58 41,964
600,001 – 700,000 29,048 2.49 2,592 18,771,601 5,855,546 63,933 102,782 783,154 9,395 11,956,791 1,726,212 6.43 59,426
700,001 – 800,000 20,304 1.74 1,480 15,095,459 4,044,297 38,434 82,335 531,447 6,597 10,392,349 1,552,342 5.78 76,455
800,001 – 900,000 14,239 1.22 989 12,064,309 2,815,178 25,584 59,477 417,628 4,262 8,742,180 1,335,989 4.98 93,826
900,001 – 1,000,000 11,398 0.98 749 10,771,821 2,227,790 20,042 51,917 349,160 2,822 8,120,090 1,260,145 4.69 110,558
1,000,001 – 1,500,000 28,667 2.46 1,985 34,398,038 5,539,956 38,800 159,898 856,992 7,752 27,794,640 4,414,210 16.45 153,982
1,500,001 – 2,000,000 9,153 0.78 641 15,655,346 1,325,937 9,365 75,997 241,817 2,295 13,999,935 2,194,073 8.17 239,710
2,000,001 – 3,000,000 5,875 0.50 169 14,036,427 599,541 3,548 58,081 106,514 1,052 13,267,691 2,055,926 7.66 349,944
3,000,001 – 5,000,000 2,434 0.21 6 9,099,078 15,408 549 37,941 26,233 195 9,018,752 1,354,675 5.05 556,563
5,000,001 – 7,500,000 797 0.07 1 4,742,258 936 199 16,097 4,438 0 4,720,588 708,086 2.64 888,439
7,500,001 – 10,000,000 268 0.02 1 2,263,916 567 99 6,054 1,569 60 2,255,567 338,323 1.26 1,262,397
10,000,001 & /over 361 0.03 0 7,070,667 0 7 39,613 1,393 0 7,029,654 1,054,448 3.93 2,920,908
/ Total 1,167,291 100.00 83,523 409,711,354 181,499,885 1,779,795 1,847,027 12,108,873 136,813 212,338,961 26,843,933 100.00 22,996
69
SCHEDULES
6 1999-2000
SCHEDULE 6 ANALYSIS OF ALLOWANCES FOR THE YEAR OF ASSESSMENT 1999-2000 BY INCOME GROUP
Annual Basic Married Child Dependent Single Dependent Additional Dependent Additional Disabled Disabled Disabled Disabled Disabled Total Income Allowance Person’s Allowance Brother/ Parent Parent Dependent Grandparent Dependent Spouse Parent Grandparent Child Brother/ Allowances
Allowance Sister Allowance Allowance Parent Allowance Grandparent Allowance Allowance Allowance Allowance Sister
Allowance Allowance Allowance Allowance
($) ($’000) ($’000) ($’000) ($’000) ($’000) ($’000) ($’000) ($’000) ($’000) ($’000) ($’000) ($’000) ($’000) ($’000) ($’000)
108,001 – 110,000 1,049,868 0 0 0 0 0 0 0 0 0 0 0 0 0 1,049,868
110,001 – 120,000 6,103,404 0 111 0 0 0 0 0 0 0 0 0 0 0 6,103,515
120,001 – 130,000 6,214,860 0 0 30 0 0 0 0 0 0 0 0 0 0 6,214,890
130,001 – 140,000 5,453,352 0 10,695 4,830 0 6,120 0 780 0 0 0 0 0 0 5,475,777
140,001 – 150,000 5,385,096 0 59,235 29,760 0 37,650 30 5,820 0 0 0 0 0 0 5,517,591
150,001 – 180,000 13,746,024 0 281,872 111,330 0 329,940 168,390 37,620 10,830 0 120 60 0 0 14,686,186
180,001 – 210,000 11,701,908 0 457,537 128,220 54 711,090 469,680 62,130 29,340 0 3,540 840 420 3,960 13,568,719
210,001 – 240,000 9,175,032 2,407,752 473,849 131,280 54 793,740 525,780 70,200 31,830 0 19,080 3,300 1,680 8,460 13,642,037
240,001 – 270,000 7,987,032 4,434,912 809,105 104,220 55,296 999,780 670,560 69,510 33,000 0 42,420 4,260 2,760 10,200 15,223,055
270,001 – 300,000 5,961,708 5,870,880 1,261,006 91,440 85,008 956,130 597,630 61,050 27,390 480 41,100 3,660 3,360 11,520 14,972,362
300,001 – 400,000 11,893,824 14,408,928 3,386,486 159,360 218,023 2,782,830 1,594,980 138,750 58,410 5,880 141,120 13,740 27,300 38,100 34,867,731 400,001 – 500,000 5,926,392 6,866,424 1,771,765 72,660 119,988 1,786,470 991,770 75,480 32,730 4,260 109,260 9,960 20,760 27,660 17,815,579 500,001 – 600,000 3,419,496 3,640,464 1,047,699 32,100 66,150 1,032,810 540,090 36,510 15,180 1,740 70,740 4,560 13,860 16,020 9,937,419
600,001 – 700,000 2,053,836 2,166,696 632,000 16,770 39,744 573,420 286,350 20,580 8,310 960 36,540 3,180 7,500 9,660 5,855,546
700,001 – 800,000 1,403,892 1,577,880 455,996 8,730 25,969 355,890 164,520 10,920 4,260 780 24,360 1,200 5,460 4,440 4,044,297
800,001 – 900,000 963,684 1,148,256 317,960 6,030 20,358 224,160 102,180 7,410 2,400 240 14,460 960 3,540 3,540 2,815,178
900,001 – 1,000,000 771,876 918,216 253,766 4,290 13,932 169,380 73,950 5,040 1,860 240 9,420 900 2,460 2,460 2,227,790
1,000,001 – 1,500,000 1,776,600 2,554,632 655,950 7,410 37,584 332,640 132,420 8,820 2,880 660 19,920 1,200 4,260 4,980 5,539,956
1,500,001 – 2,000,000 126,144 906,768 195,735 810 10,260 58,050 21,660 990 300 0 3,000 240 1,200 780 1,325,937
2,000,001 – 3,000,000 13,500 460,728 93,525 120 4,968 17,610 6,810 480 120 120 780 120 600 60 599,541
3,000,001 – 5,000,000 108 9,720 2,340 60 0 1,620 1,020 90 90 0 240 0 0 120 15,408
5,000,001 – 7,500,000 108 648 180 0 0 0 0 0 0 0 0 0 0 0 936
7,500,001 – 10,000,000 0 432 135 0 0 0 0 0 0 0 0 0 0 0 567
10,000,001 & /over 0 0 0 0 0 0 0 0 0 0 0 0 0 0 0
/ Total 101,127,744 47,373,336 12,166,947 909,450 697,388 11,169,330 6,347,820 612,180 258,930 15,360 536,100 48,180 95,160 141,960 181,499,885
SCHEDULES
70
7 2001 3 31
SCHEDULE 7 PROPERTY STATISTICS (as at 31 March 2001)
Classification of Properties No. of Properties %
627,984 32.99 Solely owned by individuals (with rental income, if any, reported in Composite tax returns)
–
Jointly owned, owned by tenants-in-common, or solely owned other than by individuals –
98,438 Letting
33,250 Business use and/or rent free
456,403 Wholly occupied by owners for residential use
21,824 Vacant
72 609,987 32.04
Letting but no liability under Personal Assessment
339,350 17.83 Owned by corporations and exempt from Property Tax under the Inland Revenue Ordinance
207,137 10.88 Home Ownership Scheme or Private Sector Participation Scheme
897 0.05
Government owned
– 118,309 6.21
New Ownership – awaiting classification
1,903,664 100.00 Total
Classification of Ownership No. of Properties %
1 1,108,693 58.24
Properties owned by : 1 owner
2 747,810 39.28
2 owners
3 33,256 1.75
3 owners
4 8,114 0.42
4 owners
5 2,667 0.14
5 owners
6 10 2,641 0.14
6 to 10 owners
11 20 329 0.02
11 to 20 owners
20 154 0.01
Over 20 owners
1,903,664 100.00 Total
71
SCHEDULES
8
SCHEDULE 8 BUSINESS REGISTRATION STATISTICS
1997-98 1998-99 1999-2000 2000-01
Fiscal Year
85,544 73,164 81,689 87,553
New registrations
13,436 3,749 7,337 7,104
Re-opened registrations
104,158 95,338 87,714 85,628
Cancelled registrations
3 31
633,071 614,646 615,958 624,987
Current registrations as at 31 March
725,187 685,841 687,150 703,075
Certificates issued
4,084 5,501 7,704 9,039
Businesses exempted from payment of fees
199,711 228,521 238,831 256,851
Certified extracts issued
($’000) ($’000) ($’000) ($’000)
1,341,070 1,275,703 1,276,238 1,300,714
Fees and penalties collected (excluding levy)
15,481 14,703 10,697 10,320
Court fines 3 31
60,127 56,215 45,309 41,192
Fees and penalties in arrears as at 31 March (excluding levy)
SCHEDULES
72
9
SCHEDULE 9 STAMP DUTY COLLECTIONS
1997-98 1998-99 1999-2000 2000-01
Fiscal Year
($m) ($m) ($m) ($m)
– Duties on –
• 17,278.3 6,335.8 4,917.4 4,996.9
Assignments and Chargeable Agreements
• 11,485.5 3,588.1 6,948.7 5,653.7
Contract notes
• 299.7 246.9 228.1 237.2
Leases
• 4.2 1.5 3.4 6.4
Transfer deeds
• 2.4 1.7 2.4 2.1
Other documents
25.7 13.9 15.1 14.2
Penalties
1.1 0.8 0.8 0.7
Additional duties for delays in payment
29,096.9 10,188.7 12,115.9 10,911.2
Total duty collections
73
SCHEDULES
10
SCHEDULE 10 STAMP OFFICE ACTIVITIES AND COLLECTIONS
1997-98 1998-99 1999-2000 2000-01
Fiscal Year
Average number of callers per day
• 1,834 1,455 1,371 1,448
Stamp Office
• 195 211 185 205
Kowloon Sub-Office
• 123 141 131 130
Tsuen Wan Sub-Office
Number of documents stamped
• 1,140,721 903,334 891,259 929,456
Stamp Office
• 104,383 112,916 100,686 109,249
Kowloon Sub-Office
• 44,365 51,728 47,923 50,312
Tsuen Wan Sub-Office
1,289,469 1,067,978 1,039,868 1,089,017 Total
Contract note duty ($m) ($m) ($m) ($m)
• 11,005.3 3,374.3 6,547.3 5,224.4
Collected through Stock Exchange of Hong Kong Limited
• 480.2 213.8 401.4 429.3
Collected by Stamp Office & Sub-Offices
11,485.5 3,588.1 6,948.7 5,653.7
Total
Duty collections ($m) ($m) ($m) ($m)
• *
28,908.3 10,078.0 12,035.8 10,827.1
Stamp Office*
• 174.8 97.7 68.7 72.2
Kowloon Sub-Office
• 11.8 12.8 11.0 11.9
Tsuen Wan Sub-Office
• 2.0 0.2 0.4 0.0
Lands Department
29,096.9 10,188.7 12,115.9 10,911.2
Total
*
Including contract note duty collected through Stock Exchange of Hong Kong Limited 2000 4 1
Lands Department ceased to collect duty on 1.4.2000
SCHEDULES
7411 2001 3 31
SCHEDULE 11 ESTATE DUTY DUTY ASSESSED AND COLLECTIONS FOR THE YEAR ENDED 31 MARCH 2001
2000 4 1 2000 01
Assessments issued in 2000 -01 Total
Assessments issued before
Original Assessments Additional
1 April 2000 Assessments
200 200 400 400 1,000 1,000 2,000 2,000
Estates valued Estates valued Estates valued Estates valued Estates valued under $2m $2m to $4m $4m to $10m $10m to $20m over $20m
($’000) ($’000) ($’000) ($’000) ($’000) ($’000) ($’000) ($’000)
1999 2000 Outstanding charges brought
261,031 – – – – – – 261,031
forward from 1999-2000
Less: Amount discharged 17,427 – – – – – – 17,427
1999 2000 Net outstanding charges brought
243,604 – – – – – – 243,604
forward from 1999-2000
Net duty assessed – 503 241 48,459 213,614 814,588 3,979 1,081,384
Penalties charged – 55 0 789 4,589 5,781 – 11,214
Interest charged 8,298 547 253 8,641 21,827 70,331 7,371 117,268
Total amount payable 251,902 1,105 494 57,889 240,030 890,700 11,350 1,453,470
2000 4 1 Less: Amount paid on account before
1 April 2000 – – 471 27,141 171,321 725,436 1,306 925,675
2000 01 Net duty, penalties and interest payable
in 2000-01 251,902 1,105 23 30,748 68,709 165,264 10,044 527,795
Less: Outstanding charges carried
2001 02 forward to 2001-02 177,689 745 0 12,490 21,973 70,497 168 283,562
2000 01 Net duty, penalties and interest paid
in 2000-01 74,213 360 23 18,258 46,736 94,767 9,876 244,233
Add: Duty and interest paid on account
in respect of assessments to be – – 968 26,591 173,651 1,057,008 125 1,258,343
issued in subsequent years
2000 01 Total collections in 2000-01 74,213 360 991 44,849 220,387 1,151,775 10,001 1,502,576
75
SCHEDULES
12
SCHEDULE 12 ESTATE DUTY STATISTICS
1997-98 1998-99 1999-2000 2000-01
Fiscal Year
($’000) ($’000) ($’000) ($’000)
Assessment
1,124,063 1,167,991 1,358,871 1,081,384
Duty assessed
191,778 212,960 185,722 128,482
Penalties and interest
1,315,841 1,380,951 1,544,593 1,209,866
Total
Collection
1,087,058 866,162 893,776 1,258,343
Payment before assessment
501,006 370,504 377,854 244,233
Payment after assessment
1,588,064 1,236,666 1,271,630 1,502,576
Total
Arrears
3 31
198,406 238,998 261,031 283,562
Arrears as at 31 March