CHAPTER FOUR RESULTS AND DISCUSSIONS
This chapter presents research findings and discusses the implications in four
sections. The first section summarizes subjects’ demographic data including
distribution in terms of age, gender, working experience, language combination, A
language, interpretation training, and so on. The second section presents the analysis
results of subjects’ self-report personality preference, which is compared to norm
reference of university students and workers in other occupational settings. The third
section summarized subject’s overall anxiety level and results of data analysis by
using statistical techniques including Pearson correlation, linear regression,
multivariable regression, and stepwise analysis. The last section is dedicated to
discussion of analysis results regarding subjects’ personality profile and anxiety level.
4.1 Summary of Demographic Data
39 questionnaires containing three evaluation forms (MBTI personality type
indicator, State Anxiety test, and Trait Anxiety test) were either mailed to the
participating interpreters or delivered by the researcher to interpreters at the
conference venue. With a return rate of 76.9%, 30 questionnaires were returned to the
researcher by deadline. Of the 30 questionnaires returned, 30 personality type
indicators, 30 trait anxiety tests along with 26 anxiety tests were correctly completed
and deemed as valid. Results of two state anxiety tests were voided because each test
contained more than three questions left unanswered. Results of another two state
anxiety tests were also voided after the subjects reported that they completed the
questionnaire hours or even days after the conference ended.
Since State Anxiety is the dependent variable in the research design of the
present study, and the investigation of state–trait and state-experience correlation
depends on the existence of a State Anxiety score, subjects with such score missing
were removed from the population for anxiety analysis but still included in the
personality analysis. This implies that the personality analysis in this research
included the self-report information by 30 interpreters, whereas the anxiety analysis
was based on a slightly smaller population of 26 interpreters.
4.1.1 Population Size and Response Rate
The accurate population size of interpreters in Taiwan, as mentioned in chapter
three, is yet to be determined. To reach the undefined population of conference
interpreters in Taiwan, the researcher contacted several professional conference
organizers and interpretation service centers and obtained lists containing 44
conference interpreters. By way of snowballing, 13 further contacts were generated.
Consequently, a total of 57 interpreters were contacted for their willingness to
participate in the survey.
Of the 57 interpreters, 50 interpreters identified themselves as active interpreters,
which limited the research population to fifty subjects. Table 4.1 summarizes the total
response rate among the research subjects. The population size and participation rate
of the present study bears resemblance to the survey results presented by the Survey
of Translation and Interpretation Industry in Taiwan completed in 2004 (Government
Information Bureau, 2004), in which 53 interpreters were identified and 72% of them
agreed to participate in the survey.
Table 4.1 Response Rate of Research Subjects
Total Summary
No. of interpreters contacted 57 --
No. of interpreters who identified themselves as active interpreters
50 Active interpreters: 87.7 %
No. of active interpreters willing to participate
39 Participation rate: 78 %
No. of questionnaires returned 30 Return rate: 76.9 %
4.1.2 Gender and Age
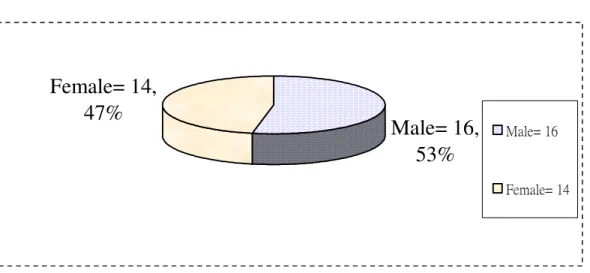
The research population consisted of 16 male interpreters (53%) and 14
female (47%) interpreters (Figure 4.1.2.1). This indicates that roughly half of the
research population was male and the other half was female. The gender distribution
bears resemblance, again, to that of the latest survey on the interpretation and
translation industry in Taiwan in 2004 (Government Information Bureau, 2004), in
which 42% of the population was represented by male interpreters and 58% by
female.
Male= 16, 53%
Female= 14, 47%
Male= 16
Female= 14
Figure 4.1 Gender Distribution of Subjects
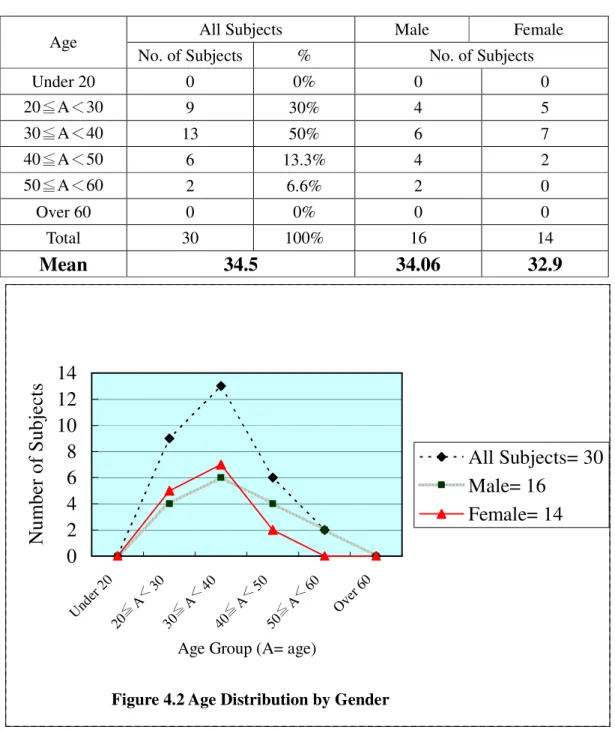
Table 4.2 shows the age distribution of the subjects. 80% of subjects were
between 20-40 years of age: 50% of the subjects were between 30-40 years of age,
followed by 30% between the age of 20-30; 13.3% were between the age of 40-50,
and 6.6% were between 50-60 years of age. No subjects were found to be under 20 or
over 60 years of age. Subjects’ average age was found to be 34.5. Average age of
female subjects was 32.9, similar to that of male subjects (34.06).
Figure 4.2 shows the similarity between female and male subjects’ age
distribution. The same similarity was also reported by the Industry Survey previously
noted. However, it is worth noting that the average age of subjects participating in this
research (34.5) differs from that of the Industry Survey, by which freelance
conference interpreters’ average age was found to be 40. The researcher wonders
whether the difference in average age could be attributed to a significantly higher
response rate among interpreters under 35 years of age.
Table 4.2 Distribution of Subjects by Age Groups
All Subjects Male Female
Age No. of Subjects % No. of Subjects
Under 20 0 0% 0 0
20≦ <30 A 9 30% 4 5
30≦ <40 A 13 50% 6 7
40≦ <50 A 6 13.3% 4 2
50≦ <60 A 2 6.6% 2 0
Over 60 0 0% 0 0
Total 30 100% 16 14
Mean 34.5 34.06 32.9
0 2 4 6 8 10 12 14
Under 20
20≦A<30
30≦A<40
40≦A<50
50≦A<60
Over 60
Age Group (A= age)
N u m b er o f S u b je ct s
All Subjects= 30 Male= 16
Female= 14
4.1.3 Training and Working Experience
All interpreters had received college education. 86.7% (26 interpreters)
indicated that they had attended interpreter’s schools, whereas 13.3% of subjects Figure 4.2 Age Distribution by Gender
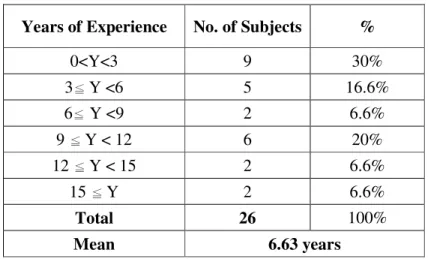
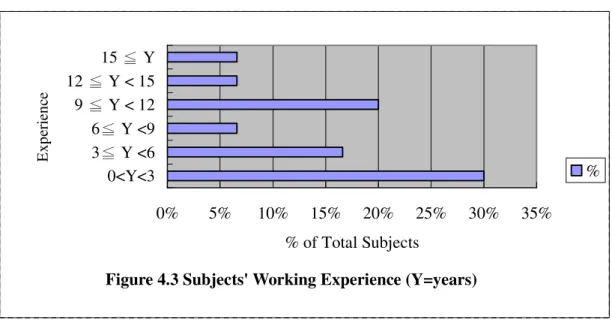
reported that they never received any interpretation training. In terms of subjects’
working experience, Table 4.3 and Figure 4.3 show that 30% of subjects reported
that they had worked less than 3 years as conference interpreters, followed by 20% of
subjects who had worked for 9-12 years, and 16.6% of subjects had worked for 3-6
years. The 3-6 years, 12-15 years, and over-15 years categories each accounts for
6.6% of the total population. The subjects’ average working experience in conference
interpreting was 6.63 years.
Table 4.3 Subjects’ Working Experience
Years of Experience No. of Subjects %
0<Y<3 9 30%
3≦Y <6 5 16.6%
6≦ Y <9 2 6.6%
9 ≦Y < 12 6 20%
12 ≦Y < 15 2 6.6%
15 ≦Y 2 6.6%
Total 26 100%
Mean 6.63 years
0% 5% 10% 15% 20% 25% 30% 35%
0<Y<3 3≦ Y <6 6≦ Y <9 9 ≦ Y < 12 12 ≦ Y < 15 15 ≦ Y
Experience
% of Total Subjects
%
4.1.4 Language Combination and Mother Tongue
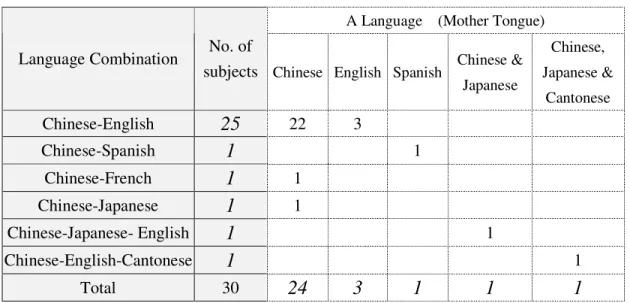
Table 4.4 summarizes the language combination and A language (mother tongue)
identified by the subjects. Figure 4.4 shows that 25 subjects, or 83.3% of the total
research population, identified Chinese-English as their language combination. One
subject identified Chinese- Spanish, one subject identified Chinese- French, one
subject identified Chinese- Japanese, one subject identified Chinese-Japanese-English,
and one subject identified Chinese-English-Cantonese as their language combination
in conference interpreting.
Figure 4.5 indicates that 24 subjects, or 80% of those surveyed identified
Chinese as their only A language, whereas 6 subjects identified such languages as Figure 4.3 Subjects' Working Experience (Y=years)
English, Spanish, Japanese, Cantonese or combinations of them as their A
language(s).
Table 4.4 Subjects’ Language Combination and A Language
A Language (Mother Tongue) Language Combination No. of
subjects Chinese English Spanish Chinese &
Japanese
Chinese, Japanese &
Cantonese
Chinese-English
25
22 3Chinese-Spanish
1
1Chinese-French
1
1Chinese-Japanese
1
1Chinese-Japanese- English
1
1Chinese-English-Cantonese
1
1Total 30
24 3 1 1 1
Figure 4.1.4.1 Subjects' Language Combination Chinese-English
84%
Chinese- Japanese
3%
Chinese- Japanese- English
3% Chinese-
English- Cantonese
3%
Chinese- French
3%
Chinese- Spanish
4%
Figure 4.1.4.2 Subjects' A Language Chinese
81%
Chinese &
Japanese
3% Chinese, Japanese
& Cantonese English 3%
10%
Spanish 3%
Figure 4.4 Subjects’ Language Combination
Figure 4.5 Subjects’ A Language
4.2 Summary of Personality Analysis Results
4.2.1 Overview of Subjects’ Personality Profile
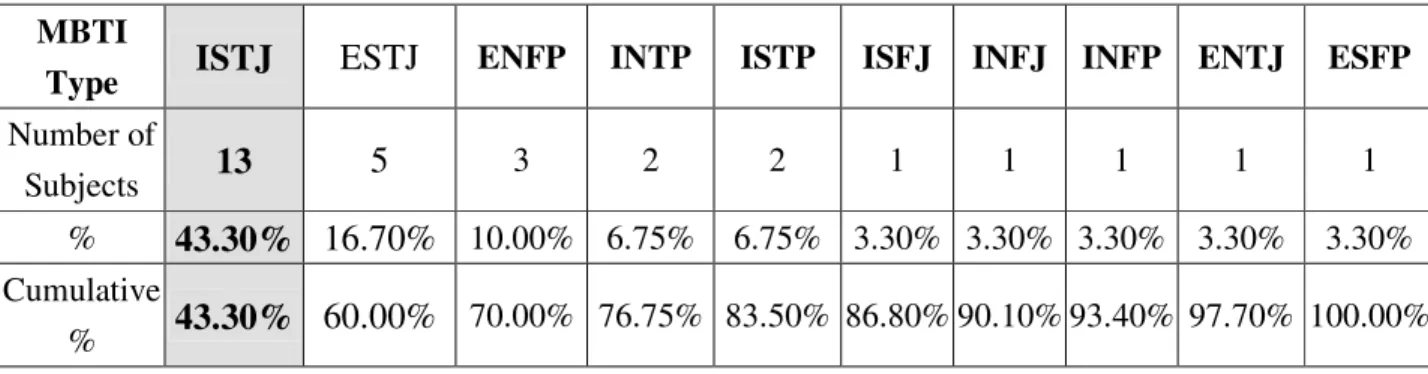
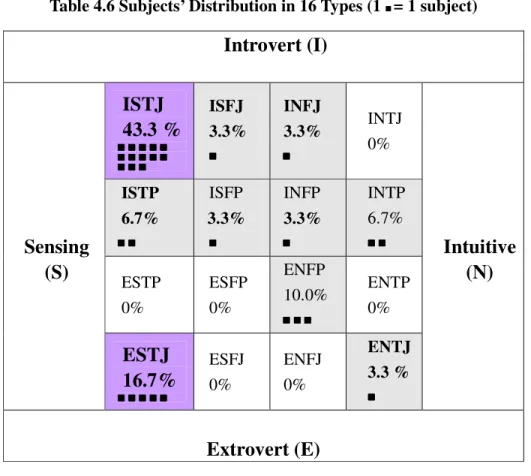
Table 4.5 summarizes MBTI type distribution of the 30 research subjects. Table
4.6 shows that the 30 subjects gravitated toward 10 of the 16 possible MBTI types: ISTJ,
ESTJ, ENFP, INTP, ISTP, ISFJ, INFJ, INFP, ENTJ and ESFP. 13 subjects were found
to be ISTJ type, whereas 5 subjects showed preference for ESTJ; 3 subjects showed
preference for ENFP, 2 subjects for INTP, 2 subjects for ISTP, 1 for ISFJ, 1 for INFP, 1
for INFJ, 1 for ENTJ and 1 for ESPF. The two most dominant types were found to be
ISTJ and ESTJ. ISTJ alone accounted for 43.3% of the total population.
Table 4.5 Subjects’ Type Distribution on MBTI
MBTI
Type ISTJ ESTJ ENFP INTP ISTP ISFJ INFJ INFP ENTJ ESFP Number of
Subjects 13 5 3 2 2 1 1 1 1 1
% 43.30% 16.70% 10.00% 6.75% 6.75% 3.30% 3.30% 3.30% 3.30% 3.30%
Cumulative
% 43.30% 60.00% 70.00% 76.75% 83.50% 86.80% 90.10% 93.40% 97.70% 100.00%
Table 4.6 Subjects’ Distribution in 16 Types (1 ■= 1 subject)
Introvert (I)
ISTJ 43.3 %
■
■■
■ ■■■■ ■■■■ ■■■ ■■■■■
■
■■
■ ■■■■ ■■■■ ■■■ ■■■■■
■
■■
■ ■■■■ ■■■■
ISFJ 3.3%
■
■
■
■
INFJ 3.3%
■
■
■
■
INTJ 0%
ISTP 6.7%
■
■■
■ ■■■■
ISFP 3.3%
■
■
■
■
INFP 3.3%
■
■
■
■
INTP 6.7%
■
■
■
■ ■■■ ■
ESTP 0%
ESFP 0%
ENFP 10.0%
■
■
■
■ ■■■■ ■■■■
ENTP 0%
Sensing (S)
ESTJ 16.7%
■■■
■ ■■■■ ■■■■ ■■■ ■■■■■
ESFJ 0%
ENFJ 0%
ENTJ 3.3 %
■■
■■
Intuitive (N)
Extrovert (E)
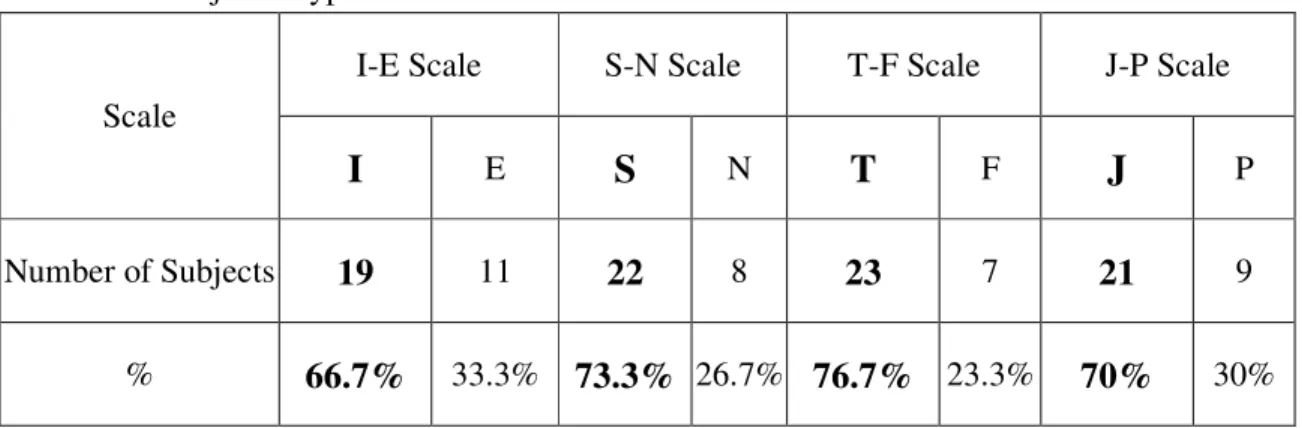
Table 4.7 provides a polarized view of subjects’ preference over the
dichotomous ends of the four MBTI scales. In terms of E-I Scale, 66.7% of the
subjects showed preference for the I end and 33.3% for the E end; with regard to S-N
Scale, 73.3% showed preference for the S end, and 26.7% for the N; on the T-F Scale,
76.7% showed preference for T and 23.3% for F; in terms of J-P Scale, 70% showed
preference for the J end and 30% for the P end.
Table 4.7 Subjects’ Type Distribution on 4 Scales: a Dichotomous View
I-E Scale S-N Scale T-F Scale J-P Scale Scale
I
ES
NT
FJ
PNumber of Subjects 19 11 22 8 23 7 21 9
% 66.7% 33.3% 73.3% 26.7% 76.7% 23.3% 70% 30%
4.2.2 Subjects vs. Normative Data
4.2.2.1 Subjects vs. University Students
Table 4.8 present a comparative view of subjects’ personality types versus that
of university population in Taiwan and U.S. The researcher had opted for university
population as the norm reference for this research based on the following reasons.
First, the validity and reliability of the Chinese MBTI (G form) was established based
on 1059 university students studying in a variety of academic fields (six colleges in
three universities) (Huang and Huang, 1992). Nevertheless, no norm references had
been established based on the general population in Taiwan. A comparison of subjects’
personality types versus Taiwanese general population was therefore not achievable
due to the unavailability of Taiwanese population norm.
Second, statistics by Center for Application of Psychological Type of the U.S.
(CAPT) showed that introverts and intuitive types are most frequent at higher levels of
education because higher education is usually concerned with understanding and using
concepts and ideas—attractive to introverts—and with abstraction , symbols and
theories—attractive to intuitive types (Macdaid et al, 1996). As previously noted,
subjects of this research had all received college education, which may increase the
proportion of introverts and intuitive types among them as personality theories
postulate. Had the research subjects been compared with the norm reference based on
general population, subjects’ increased preference as a result of higher education may
be mistakenly interpreted to characterize practitioners in conference interpreting.
Consequently, normative data derived from university students in Taiwan and the U.S.
serve as more desirable comparison basis for the research findings.
Two observations can be made when comparing subjects’ personality profile with
that of university population. First, as demonstrated in Table 4.9, subjects’ preference
for I (66.7%), S (73.3%), T (77.7%), J (70%) conforms to Taiwanese normative data, in
which I (65.6%), S (76.2%), T (61.7%), J (79.9%) attracted greater proportion of
Taiwanese university students (Huang and Huang, 1992). Huang and Huang (Huang
and Huang, 1992) and Myers (Myers, 1992) all pointed out that “there were significant
differences between the preferences of Chinese students and those of American college
population provided by CAPT. Since 26 subjects, or 86.7% of the total subjects
identified Chinese as their mother tongue or one of their mother tongues, it was not
surprising that subjects’ overall personality preferences bears more resemblance to
Chinese than the US population (E, 55.5%; S, 59.8%; F, 52.4%; J, 55.4%) (Mcdaid,
McCaulley, and Kainz, 1994). Removal of 4 non-native Chinese subjects from the
analysis data did not affect the remaining subjects’ distinct preference for I (65.4%), S
(73.1%), T (76.9%), and J (69.2%).
Second, Table 4.9 and Table 4.10 show the proportion of the most frequent types
among Taiwanese university population, which provides an alternative way to
characterize coherency within research data. The most dominant types among
Taiwanese university population are ISTJ (27.1%), ESTJ (16%), and ISFJ (14.8%),
whereas the most dominant types among US university population were ESFJ (10.3%),
ESTJ (10.7%), and ISTJ (9.7%). It can be observed that proportion of the three most
dominant types among subjects—ISTJ (43.3%), ESTJ (16.7%), and ENFP
(10.0%)—bears more resemblance to Taiwanese university population than its U.S.
counterpart, except for a seemingly higher proportion of ENFP among subjects.
Four non-Chinese native speakers were removed (2 ISTJs, 1 ENFP, and 1 ESTJ) again
from the analysis data in an attempt to minimize interference on analysis due to
comparing non-Chinese subjects with Chinese population. After research subjects were
strictly limited to native Chinese speakers, the most dominant types then became ISTJ
(42.3%), ESTJ (15.4%), followed by ENFP (7.7%) and ISTP (7.7%) (Table 4.8).
However, the great proportion of ISTJ (42.3%) among research subjects is not observed
in Taiwanese university population.
Table 4.8 Proportion of Each Type among Subjects vs. Taiwanese University Population (*= Three most dominant types)
MBTI Type
Taiwanese University Population
Research Subjects (n=30)
Research population with 4 non-Chinese interpreters removed
(n=26)
ISTJ * 27.1% * 43.3% * 42.3%
ISFJ * 14.8% 3.33% 3.85%
INFJ 3.50% 3.33% 3.85%
INTJ 5.90% 0.00% 0.00%
ISTP 3.90% 6.75% * 7.70%
ISFP 3.40% 3.33% 3.85%
INFP 3.50% 3.33% 3.85%
INTP 2.50% 3.33% 3.85%
ESTJ * 16.0% * 16.7% * 15.4%
ESFJ 7.50% 0% 0.00%
ENFJ 2.00% 0% 0.00%
ENTJ 3.20% 3.30% 3.85%
ESTP 1.90% 0% 0.00%
ESFP 1.70% 3.30% 3.85%
ENFP 2.00% * 10.0% * 7.70%
ENTP 1.20% 0% 0.00%
Table 4.9 Dichotomous View on Type Distribution: Subjects’ vs. Taiwanese and US Normative Data (%)
E-I Scale S-N Scale T-F Scale J-P Scale
Occupation
E I S N T F J P
3 Most Dominant
Types
%
ISTJ 40.3
ESTJ 16.7
All Subjects
N= 30 33.3 66.7 73.3 26.7 76.7 23.3 70.0 30.0
ENFP 10.0
ISTJ 42.3
Native Chinese Subjects
34.6 65.4 73.1 26.9 76.9 23.1 69.2 30.8
ESTJ 15.4
ISTJ 27.1
ESTJ 16
Univ.
Students, Taiwan (Norm)
35.4 65.6 76.2 23.8 61.7 38.3 79.9 20.1
ISFJ 14.8
ESFJ 10.3
ESTJ 10.7
Univ.
Students, US 55.5 44.5 59.8 40.2 47.6 52.4 55.4 44.6
ISTJ 9.7
(Source: Mcdaid, McCaulley, and Kainz,1994; Huang, 1991).
4.2.2.2 Subjects vs. Workers in Different Occupational Settings
Table 4.10 juxtaposes the type distribution and three most dominant types among
subjects and Taiwanese and American workers across different occupational settings,
including business managers, insurance agents, lawyers, military personnel, and
counselors (Mcdaid, McCaulley, and Kainz, 1994; Huang, 1992). Several observations
First, it is interesting to note despite the difference in occupation, Taiwanese
workers as a whole showed more preference for I, S, T, J, though the proportion that
introverts, sensing, thinking, and judging types may vary from one occupation to
another. The only exception is insurance agents, who showed for preference for E, but
similarly more preference for S, T, and J (Huang, 1992). It is not surprising that
Taiwanese workers demonstrated personality characteristics similar to Taiwanese
university students mentioned earlier since most of them had received college
graduation (Huang, 1992), just like the research subjects.
Second, Huang indicated that the most dominant types among Taiwanese
University students and Taiwanese workers as a whole are ISTJ, ESTJ, and ISFJ. The
most dominant types among research population are ISTJ and ESTJ. Huang pointed
out that highly centralized type distribution can be observed in Taiwanese business
managers and insurance agents; the most dominant type- ESTJ (49.6%) for business
managers and ESTJ (48.2%) for insurance agents- alone accounted for almost half of
the workers in that profession. However, Huang was not able to offer an explanation
(Huang, 1992). Such focalized distribution pattern was also observed among research
subjects— when limiting subjects to native Chinese interpreters, ISTJ alone accounted
for as much as 42.3% of the research population.
Table 4.10 MBTI Type Distribution: Subjects vs. Workers in Other Occupational Settings
E-I Scale S-N Scale T-F Scale J-P Scale
Occupation
E I S N T F J P
Three Most
Dominant Types %
ISTJ 40.3
ESTJ 16.7
Subjects 36.7 63.3 73.3 26.7 76.7 23.3 70.0 30.0
ENFP 16.7
ISTJ 42.3 Native
Chinese Subjects
34.6 65.4 73.1 26.9 76.9 23.1 69.2 30.8
ESTJ 15.4
ESTJ 49.6
ISTJ 33.9
Business Managers,
Taiwan
53.9 56.1 96.5 3.5 91.3 8.7 95.6 4.4
ISFJ 6.1
ESTJ 17.5
ISTJ 15.9
Business Managers,
US
55.7 44.3 60 40 63.9 36.1 68.4 31.6
ENTJ 10.1
ESTJ 48.2
ISTJ 21.7
Insurance Agents, Taiwan
69.9 30.1 84.3 15.7 73.5 26.5 97.6 2.4
ESFJ 14.5
ESTJ 21.8
ENFP 13.9
Insurance
Agents, US 70 31 58 43 54 47 57 44
ESFJ 8.9
ISTJ 31.5
ESTJ 16.4
Lawyers,
Taiwan 39.7 60.3 74.0 26.0 83.6 16.4 78.1 21.9
INTJ 12.3
INTJ 15.1
ENFP 11.8
Lawyers,
US 41.3 58.7 30.6 69.4 64.9 35.1 53.9 46.1
ISTJ 11.4
ISTJ 32.3
ESTJ 29.2
Military Personnel,
Taiwan
45.3 54.6 91.5 8.5 68.5 31.5 86.9 13.1
ISFJ 11.5
ESTJ 17.8
ISTJ 14.1
Military Personnel,
US
53.4 46.6 64.4 35.6 57.2 42.8 61.8 38.2
ISFJ 9.47
ISTJ 22.7
ESTJ 18.2
Counselors,
Taiwan 38.6 61.4 73.5 26.5 54.6 45.4 90.1 9.9
ISFJ 17.4
ENFP 17.9
INFP 12.5
Counselors,
US 56.0 44.0 35.8 64.2 33.3 66.7 51.2 48.8
ENFJ 10.2
(Source: Mcdaid, McCaulley, and Kainz, 1994; Huang, 1992; Huang and Huang, 1992)
4.3 Summary of Anxiety Score Analysis Results
Section 4.3 summarizes results of Anxiety Score analysis in two parts. The first
part offers an overview of the distribution of subjects’ Trait and State anxiety scores.
The second part presents results of regression and correlation analysis to examine the
effect of Trait Anxiety scores, years of experience and gender on State Anxiety.
4.3.1 Overview of Subjects’ State and Trait Anxiety Scores
Table 4.11 summarizes the State and Trait anxiety scores among subjects. The
anxiety scores of the general population based on 737 Taiwanese was juxtaposed for
comparison. Subjects’ mean Trait Anxiety score was 40.04 (SD=8.87), mean State
Anxiety score was 44.4 (SD= 10.3). In terms of State Anxiety, most subjects’ (38.5%)
scores fell into the 40-50 range; in terms of Trait Anxiety, most subjects’ scores (50%)
fell into the 30-40 rang. (Figure 4.6)
Table 4.11 Summary of Subjects’ Trait and State Anxiety Score
Trait Anxiety score State Anxiety score Anxiety Scores
Mean SD Sample
No. Mean SD Sample
No.
Subject population
40.04
8.87 2644.38 10.3 26
General Population 43.8 11.5 737 - - -
(Source: Zhong and Long, 1984)
Figure 4.3.1.1 Distribution of Subjects' State and Trait Anxiety
2
13
7
4
0 0
2
6
10
6
2
0 0
2 4 6 8 10 12 14
20≦score<30
30≦score<40
40≦score<50
50≦score<60
60≦score<70
70≦score<80 Score
Number of Subjects
Trait Anxiety Distribution State Anxiety Distribution
Mean Trait Anxiety Score = 40.04
Mean State Anxiety Score= 44.38
Fig. 4.6 Distribution of Subjects' State and Trait Anxiety Scores
To obtain an antithetic view of each subject’s State Anxiety (S-Anxiety) and
Trait Anxiety (T-Anxiety), the 26 pairs of State and Trait Anxiety records were sorted
by the value of T-Anxiety scores and individually plotted on Figure 4.7. It is
interesting to note that no visible incremental tendency can be observed in subjects’
State Anxiety even when the 26 Trait scores were organized in an ascending order.
This runs contrary to State-Trait Anxiety theory which suggests a positive correlation
between State and Trait anxiety. This has prompted the researcher to further
investigate the State-Trait Anxiety relationship by using statistical techniques such as
correlation and regression analysis, results of which are presented in the following
paragraphs.
Mean T-Anxiety score=40.04; Mean S-Anxiety score=44.38
0 10 20 30 40 50 60 70
V IAAAC A D MAB C QAE U X Z T J OAD N W K Y F S R B
Subject Code
Anxiety Score
0 10 20 30 40 50 60 70 Trait Anxiety Score State Anxiety Score
Figure 4.7 Juxtaposition of Subjects' Trait and State Anxiety
4.3.2 Comparison of Subjects and General Population’s Trait Anxiety Scores
T-test was used to statistically analyze the difference between subjects’ Trait
Anxiety scores and those of the general population (Zhong and Long, 1984). Table
4.12 shows that the difference between subjects’ and the general population’s Trait
Anxiety scores is statistically insignificant (t=0.43732, p=0.05).
Table 4.12 T-test Statistics of Trait Anxiety Scores between General Population
(general/non-specific population or over-all) and Research Population Variables
(populations)
n Scores of Trait Anxiety (Mean ± SD)
t-value<
t0.05/2 , 761
95% confidential limit of the difference
of two means General
population
737 43.80 ± 11.50NS
Subject population
26 40.03846 ± 8.870088
t=0.43732<
1.96
-13.1~20.6
NS: is not significant between means of trait anxiety scores of normal population and
interpreter’s population by t-test at p = 0.05.
4.3.3 Results of Correlation and Regression Analyses
The anxiety scores were also analyzed by using ANOVA, Pearson Correlation,
Simple Linear Regression, and Stepwise Multivariable Regression Analysis to show
the relationship between dependent variable (State Anxiety Score) and independent
variables (trait anxiety score, years of experience, gender, and personality), and the
analysis results are discussed in this section. Based on hypotheses noted in the
foregoing paragraphs, data were first processed with Pearson Correlation Analysis to
assess the relationship between the three variables: subjects’ state anxiety score, trait
anxiety score, and years of experience. Table 4.13 demonstrated a statistically
significant relationship between State Anxiety and experience (r=-0.590, p= 0.002).
The analytical results failed to show a significant relationship between subjects’ Trait
Anxiety scores and State Anxiety scores (r= 0.387, p= 0.051), however the p-value
(type I error) is almost equal to 0.05 which means a positively and significantly
relationship (between these two anxiety scores).
Table 4.13 Correlation Coefficients Analysis among State Anxiety Scores, Trait
Anxiety Scores, and Experience
Trait anxiety score
Year of experience
State Anxiety score Trait anxiety score
Pearson correlation coefficient Significance (p-value)
N
1 -0.548**
0.004 26
0.387 0.051 26 Year of experience
Pearson correlation coefficient Significance (p-value)
N
-0.548**
0.004 26
1 -0.590**
0.002 26 State Anxiety score
Pearson correlation coefficient Significance (p-value)
N
0.387 0.051 26
-0.590**
0.002 26
1
** Correlation is significant at the 0.05 level (2-tailed)
4.3.3.1 Effect of Experience on State Anxiety Scores
Linear regression was performed to examine the relationship between subjects’
state anxiety scores (y, dependent variable) and years of experience (x, independent
variable) as demonstrated in Fig. 48. Results showed a linear and significant
relationship between the two variables and demonstrated that State Anxiety score
significantly respond to years of experiences (y= -0.8851x+ 50.25; R2 = 0.3477, p =
0.002) (Figure 4.8).
Figure 4.8 Linear Regression Analysis: Responses of State Anxiety Scores to the Years of Experience
y = -0.8851x + 50.25 R2 = 0.3477
0 10 20 30 40 50 60 70
0 5 10 15 20 25 30
Experience (Years)
State anxiety scores
P=0.02
4.3.3.2 Effect of Trait Anxiety Scores on State Anxiety Scores
Linear regression was conducted to examine the responses of subjects’ State
Anxiety scores (y) to Trait Anxiety score (x). Results failed to show a consistent effect
of trait anxiety scores on state anxiety score (Figure 4.9).
Figure 4.9 Linear Regression Analysis: Responses of State Anxiety Scores to Trait Anxiety scores
y = 0.0011x3 - 0.186x2 + 10.065x - 127.22 R2 = 0.3215
y = 0.4502x + 26.357 R2 = 0.1496
0 10 20 30 40 50 60 70
0 20 40 60 80
Trait anxiety scores
State anxiety scores
4.3.3.3 Effect of Gender on State Anxiety Scores
ANOVA analysis was performed to determine the effect of gender on subjects’
State anxiety score. Table 4.14 shows that gender did not significantly affect State
Anxiety scores (F-value = 0.123, p= 0.729).
Table 4.14 ANOVA Analysis of the Effect of Genders on State Anxiety Scores
Variables Sum of
squares
Degree of freedom
Mean squares
F-values p-value
Between groups (Genders)
13.630 1 13.630 0.123 NS 0.729
Within groups (error)
2652.524 24 110.522
Total 2666.154 25
Variables Sum of
squares
Degree of freedom
Mean squares
F-values p-value
Between groups (Genders)
13.630 1 13.630 0.123 0.729NS
Within groups (error)
2652.524 24 110.522
Total 2666.154 25
NS= independent variable of gender is not significant at p=0.729 by f test
4.3.3.4 Effects of Trait Anxiety Scores, Years of Experience and Gender on State
Anxiety Scores
relationship between the four variables: state anxiety score scores (dependent) and
trait anxiety scores, years of experience and genders (the latter three as independents).
The results showed that only experience was determined as a predictor of state
anxiety scores in the model (t=-3.577, p= 0.002). Trait anxiety (t=0.452, p=0.656) and
gender (t=0.745, p=0.464) were both excluded from the model (Table 4.17a and Table
4.17b).
Table 4.15 Stepwise Multivariable Regression: Response of State Anxiety Scores to Years of Experience, Trait Anxiety and Gender
Variables Degree of freedom
R-square Adjusted R-square
Standard error of the estimate
Model 1 0.348 0.321 8.512
1. Model used for stepwise regression analyses is Y ijk (State Anxiety scores) = a + b (Years of experience) i + c (trait anxiety ) j + d (gender) k +εijk
Table 4.16 Coefficient Test of Parameters of Intercept and Slop of the Model and Excluded Variable with Their Statistics
Model Coefficients
(β)
SE t-values p-value
Constant 50.250 2.340 21.473 0.000
Year of experience (=slop)
0.885 0.247 -3.577* 0.002< 0.05
Excluded variable
Trait anxiety 0.091 0.452NS 0.656 > 0.05
Gender 0.131 0.745 NS 0.464 > 0.05
4.3.3.5 Effect of Personality on State Anxiety
Student t-test, Multivariable Stepwise Analysis and Decision Tree Analysis were
used to examine the effect of subjects’ personality type on their State Anxiety scores.
To examine the relationship between subjects’ State Anxiety (dependent) and
personality (independent), four subjects with missing State Anxiety scores were
inevitably removed from the data. All subjects were then divided into two kinds of
personality type- 12 ISTJs and 14 non-ISTJs who distributed in 9 different types.
First, the 26 pairs of personality and State Anxiety scores were analyzed with
Student t-test to investigate whether subjects’ personality (ISTJ or non-ISTJ) results in
differential State Anxiety Scores. Table 4.18 shows that ISTJs’ mean State Anxiety
score was 44.14, and non-ISTJs’ mean State Anxiety score was 44.67. Results
indicated that there is no significant difference in State Anxiety between the two
MBTI personality types (t-value=0.1264).
Table 4.17 Student t-test Analysis of the difference in State Anxiety Score between
MBTI and non-MBTI types.
MBTI personality types
Mean State Anxiety
Standard deviation t-value (df = 24)
Non-ISTJ 44.67 10.32 0.1264
ISTJ 44.14 10.72 -
The effect of personality when considered along with years of experience was
further examined with stepwise regression analysis. This process helps to determined
whether personality type as an independent variable can be excluded from the
regression model. Table 4.19a and Table 4.19b summarize the responses of State
Anxiety scores to the independent variables of year experience and MBTI personality
types. Analysis results of stepwise regression demonstrated a significant effect of
subjects’ years of experience on State Anxiety scores (t-value=-0.3580; p=0.02).
Nevertheless, subjects’ personality type was found to have insignificant effect on
State Anxiety scores (t-value=-0.296; p=0.770) and was excluded from the model.
Table 4.18 Stepwise Regression Analyses: Response of State Anxiety Scores to Year
Experience and MBTI Personality Types1
Variables df SS MS F-value p-value
Model 1 928.104 928.104 12.816 0.002
Residue 24 1738.050 72.419
Total 25 2666.154
1. Model used for stepwise regression analyses is Y ij (State Anxiety scores) = a + b (Years of experience) i + c (MBTI personality types) j + εij
Table 4.19 Coefficient Test of Parameters of Intercept and Slop of the Model and Excluded Variable with Their Statistics
Model Coefficients SE t-values p-value
Constant 50.284 2.345 21.439 0.000
Year of experience 0.888 0.248 -3.580 0.002
(=slop)
Excluded variable MBTI personality types
-0.296 0.770
4.4 Discussion of Personality and Anxiety Score Analysis
4.4.1 Discussion of Personality Analysis
This section presents the analysis results of subjects’ self-report personality
characteristics in the following sequence. First, a discussion of subjects’ preference
for I, S, T, and J on MBTI was presented; second, differences and similarities between
subjects’ personality and that of the norm population were discussed. Third,
interpretation and discussion of the most frequent types among subjects: ISTJ and
ESTJ. The section ends with a discussion of the relationship between subjects’
personality types and State Anxiety scores.
4.4.1.1 Subjects’ Preferences for I, S, T, and J
Subjects in this research demonstrated preferences for I (66.7%), S (73.3), T
(76.7%), and J (70%) on the four MBTI Scales. First, preference for Introversion
indicated that more subjects believed they are energized by what goes on in the inner
heads. Second, preference for Sensing suggested more subjects reported they are more
realistic and practical than imaginative or innovative. They are good at remembering
and working with facts, and have a natural preference to make decisions in an objective,
logical, and analytical manner with an emphasis on tasks and results to be
accomplished. Third, instead of taking a sympathetic or appreciative approach,
dominance of “Thinking” indicates that more subjects prefer deciding objectively by
analyzing and weighing the evidences, even including the unpleasant facts. Last but not
least, preference for Judging suggests more subjects prefer a planned and organized
way of living over a flexible and spontaneous lifestyle. However, coherency among
subjects’ personality does not necessary distinguish them from the general population
or workers in other occupations before a comparison is made.
4.4.1.2 Preference for I, S, T, and J Similar to Normative Data
Subjects’ preference for I (66.7%), S (73.3), T (76.7%), and J (70%) is congruous
to the personality characteristics of Taiwanese university population, in which
dominance of I (66.7%), S (76.2%), T (61.7%), J (79.9%) was also observed (Huang
and Huang, 1992). Moreover, the preference is similar to that of Taiwanese workers in
other occupations, who show similar preferences for I, S, T, J, save insurance agents
who showed more preference for Extroversion as previously mentioned. (Huang, 1992)
This particular finding conforms to Huang’s research on personality types of
Taiwanese workers in ten different occupations. (Huang, 1991) Huang’s extensive
researches about Taiwanese university students and workers of different occupations
using MBTI in the early 90s had lead to the conclusion that, though workers in different
walks of life were included and compared to Taiwanese university population,
“personality characteristics of Taiwanese workers as a whole are found to be
nevertheless quite similar to that of Taiwanese university population.” Moreover, “the
three most dominant types among Taiwanese workers (ISTJ, ESTJ, and ISFJ) also
conform to those of Taiwanese university population.” (Huang, 1992)
Several researches had conducted extensive personality surveys and concluded
that there is a significantly higher percentage of introverts among Chinese population
(Huang and Huang, 1992). Introversion is not only a characteristic of Chinese people
living in Taiwan and China Mainland, but also prevalent among those Chinese who live
in other parts of the world. Huang and Huang also observed a “dominance of S, T, J”
after completing an extensive survey study on 1059 university students using MBTI
Form G. Huang believed that dominance of S, T, and J among Chinese population
could be attributed to two factors: first, the traditional Confucius teaching, and, second,
the method of teaching in today’s Taiwan which emphasizes memorization and
organization over creativity. (Huang and Huang, 1992)
Therefore, it is no surprise to find dominance of I, S, T, J among Taiwanese
practitioners across different occupational settings, including the subjects of this
research. It can therefore be concluded that, subjects’ preferences for I, S, T, and J are
personality characteristics inherent in a Chinese socialization process, and the research
findings in turn validated the construct validity of the MBTI.
To sum up, the research finding refutes Hypothesis One that “the three most
frequent types among participating interpreters’ are different from the university
population or workers in other occupational settings. However, an investigation of the
most frequent types and the proportion they constitute helps us to investigate the
personality types that become interpreters.
4.4.1.3 Two Most Frequent Types: ISTJ and ESTJ
Nevertheless, interpretation of the personality characteristics of ISTJ and ESTJ
appears to be one of the only ways to shed light on the types that were most
frequently attracted to the profession of conference interpreting in Taiwan. Myers
pointed out that in most occupations, all 16 types are found. For each occupation,
some types are more frequent and others are less frequent. In theory, the frequent
types are those who would like the work of that profession (Myers, 1992). Subjects in
this research gravitated toward only 10 of the 16 possible MBTI types: ISTJ, ESTJ,
ENFP, INTP, ISTP, ISFJ, INFJ, INFP, ENTJ and ESFP. As mentioned earlier, after
four non-native Chinese subjects were removed from the analysis data, the most
dominant types then became ISTJ (42.3%) and ESTJ (15.4%). This observation is
congruous to Huang’s findings that S-T combinations are most prevalent among
Chinese university population (Huang and Huang, 1992).
However, the higher frequency of ISTJ (42.3%) and ESTJ (15.4%) suggests that,
of all the 16 possible types, the conference interpreting profession attracted a greater
proportion of ISTJs and ESTJs. This focalized distribution, particularly the marked
prevalence of ISTJs, was not observed among Taiwanese university population and
workers in other occupations. In Huang’s extensive study of Taiwanese workers’
personality types using MBTI, similar type focalization was also observed in business
managers and insurance agents, among whom ESTJ type alone accounted for as much
as 49.6% and 48.2% respectively.
In an attempt to explain such unusual distribution, Huang suggested that no
definitive conclusions can be drawn to explain the overwhelming dominance of one
particular type such as ESTJ in business managers and insurance agents. It can be
viewed as the personality characteristic representative of workers in that trade, or it
could be attributed to a small sample size which resulted in the under-representation
of the less dominant types in this research (Huang, 1992).
Subjects are found to share considerable similarity with normative populations
in their preference on the four MBTI scales and the dominant types; consequently,
interpretation of the personality characteristics of ISTJ and ESTJ appears to be one of
the only ways to shed light on the types that were most frequently attracted to the
profession of conference interpreting in Taiwan. Table 4.20 presents a brief
interpretation of ISTJ and ESTJ from a career development perspective.
Table 4.20 Interpretation of ISTJ & ESTJ Personality: A Career Development
Perspective
ISTJ: Introverted Sensing with Thinking
ISTJs have one character trait which puts them at a definite advantage in terms of career success- perseverance. Because the ISTJ has such a strong sense of duty, they may have a difficult time saying "no" when they are given more work than they can reasonably handle. For this reason, the ISTJ will work for long periods of time and put tremendous amounts of energy into doing any task which they see as important to fulfilling a goal.
An ISTJ will do best in a career in which they can use their excellent organizational skills and their powers of concentration to create order and structure.
They prefer to work alone, but work well in teams when the situation demands it.
They like to be accountable for their actions, and enjoy being in positions of authority.
The ISTJ has little use for theory or abstract thinking, unless the practical application is clear. ISTJs have tremendous respect for facts. They hold a tremendous store of facts within themselves, which they have gathered through their Sensing preference.
ESTJ: Extraverted Thinking with Sensing
For ESTJs, the driving force in their lives is their need to analyze and bring into logical order the outer world of events, people, and things. ESTJs like to organize anything that comes into their domain, and they will work energetically to complete tasks so they can quickly move from one to the next.
ESTJs put forth a tremendous amount of effort towards doing things the right way. They will be happiest in leadership positions, however, because they have a natural drive to be in charge, they are best suited for jobs which require creating order and structure. ESTJs promote the work ethic. They believe that power, position and prestige should be worked for and earned. Laziness is rarely viewed with ambivalence nor benevolence by this type.
They are thorough, hard-working, dependable, and driven to fulfill their duties, and therefore will very likely follow projects through to completion. ESTJs have a clear set of standards and beliefs which they live by; they have excellent organizational abilities and enjoy creating order and structure
Source: BSM Consulting, MBTI Type Portrait
Personality Characteristics shared by ISTJ and ESTJ and its Relation with
Conference Interpreting
People tend to be attracted to, and are most satisfied in, jobs or careers that
provide them with the opportunity to express and use their preferences. As Table 4.21
shows, one’s combination of perception and judging, that is, one’s S-N and T-F
preferences (the middle two letters of one’s MBTI type) makes a lot of differences in
the kind of work one will do best and enjoy most, as Myers suggested (Myers, 1992).
If one’s daily work has the most need for the kind of perception he naturally prefers,
he will handle the job better and find it more satisfying (Myers, 1992). ISTJs and
ESTJs, who prefer Sensing and Thinking like to focus their attention on realities,
which they handle with objective analysis. They tend to become more practical and
analytical than sympathetic or friendly. They find scope for their ability in technical
skills with objects and facts, such as applied science, administration, business,
banking, and so on as shown in Table 4.21.
Table 4.21 Effects of Combination of Perception and Judgment on Career Choice
People who prefer
ST Sensing &
Thinking
SF Sensing &
Feeling
NF Intuition &
Feeling
NT Intuition &
Thinking Focus their
attention on Realities Realities Possibilities Possibilities and handle
these with Objective Analysis Personal Warmth Personal Warmth Objective Analysis Thus they tend
to become
Practical and analytical
Sympathetic and friendly
Enthusiastic and insightful
Logical and Analytical and find scope
for their ability in
Technical skills with objects and
facts
Practical help and Services for people
Understanding and communicating
with people
Theoretical and technical developments
Career examples
Applied science, business, administration,
banking, law enforcement, production, construction, etc
Health care, community service,
teaching, supervision, religious service, office work, sales,
etc.
Behavioral science, research, literature,
Art& music, religious service,
health care, teaching, etc.
Physical science, research, management, computers, law,
engineering, technical work, etc.
(Source: Introduction to Type by Myers-Briggs Type Indicator, 1992)
As Myers pointed out, while one’s main fields of interests are apt to be directly
related to the kind of perception and judgment one prefers, all of one’s preferences are
important to his career. The sort of work one will most enjoy doing within any
particular field may depend on his EI preference- whether one likes to use his favorite
process extravertedly in the outer world of people and things, or introvertedly in the
inner world of impressions and ideas. But how one “goes about” or the way one
1992: 28) Myers suggested that the introverts among individuals with ST combination
of preference, i.e., the ISTJ in this research, like to organize facts and principles
related to a situation. The extraverts among them, especially those who also prefer
Judging (ESTJ), like to organize the situation itself to get it moving. (Myers, 1992)
In terms of career choice, ISTJs and ESTJs both do best in a career in which
they can use their excellent organizational and analytical skills. Reliance on thinking
makes them logical, analytical and practical. They are attracted to a career that
enables them to focus their attention on realities, organization, and practicability.
They prefer an occupational setting where they can find scope for their ability in
technical skills by using objective analysis.
It is not surprising that ISTJ and ESTJ were found to be two of the most
frequent types among research subjects. First and foremost, the utilitarian nature of
conference interpreting directly associated with its goal to facilitate real-life
communication is attractive to ISTJs and ESTJs who are practical and pragmatic.
Second, type theory postulates that people with Sensing-Thinking combination of
preferences prefer occupations which rely on technical skills with objects and facts.
Conference interpreting itself is a “technical skill” that has its foundation in
practicability instead of theoretical framework; this fits well with ISTJs and ESTJs’
career preferences. Third, a good proportion of success in conference interpreting
hinges on interpreters’ ability to efficiently process and construe facts with logical
analysis and organization. It has been said that conference interpreters must be quick
learners with the ability and interest in analyzing facts, and organizing information,
which are cognitive activities preferred by ISTJ and ESTJ. It is therefore logical to
find a higher percentage of ISTJs and ESTJs attracted to the profession of conference
interpreting. Fourth, many authors have emphasized that conference interpreters must
be indomitable and hard-nosed to carry through the entire interpreting task. This is
again the sort of personality characteristics demonstrated by ISTJs and ESTJs:
perseverant, thorough, and driven to fulfill their duties, and therefore will more likely
follow projects through to completion.
We should bear in mind that the fact ISTJ and ESTJ types are most frequent
among subjects says nothing about their competence as conference interpreters. As
Myers suggested, “there are almost no studies yet to answer the question so important
to career counselors: Are the frequent types more competent than the rare type? Are
the more frequent types more satisfied (Myers, 1992)?” Myers argued that it is
extremely likely that there will be no data to say that any given type will fail in any
given occupation. In the context of conference interpreting, type should not be used to
tell people to stay out the profession. Rather, surveying personality types in different
trades, such as the types most attracted to the conference interpreting profession, can
be helpful in alerting people to occupations less chosen by their type, so that they can
investigate reasons for their interest, and make sure the reality of the occupation is
still appealing. Whether the frequent types’ work performance and job satisfaction
differ from that of the infrequent types requires further investigation.
Summary: Subjects’ Personality Profile
1. Subjects reported preference for Introversion (66.7%), Sensing (73.3%), Thinking
(77.7%), and Judging (70%) as evaluated by the four MBTI scales. Out of the 16
possible MBTI types, the most frequent ones among subjects were identified as
ISTJ (Introverted Sensing with Thinking, 43.3%) and ESTJ (Extraverted Thinking
with Sensing ,16.7%).
2. The three most frequent types among subjects are similar to the Taiwanese general
population and workers in other occupations. This refutes Hypothesis Two that the
three most prevalent types among participating interpreters are different from the
Taiwanese general population or workers in other occupational settings.
3. ISTJ and ESTJ accounted for 60% of the entire population. It is nevertheless
worthwhile to investigate the personality characteristics of the two types that were
more frequently attracted to the profession. High frequency of ISTJ and ESTJ
indicates that the field attracts practical and pragmatic individuals who rely on
their technical skills with objects and facts at work. They are usually perseverant
and thorough individuals who have an affinity for analyzing facts and organizing
information. Their strong sense of duty drives them to fulfill tasks, which puts
them at a career advantage. The forgoing psychological profile in fact conforms to
many descriptions regarding interpreters’ mental quality mentioned in literature
review.
4. No definitive conclusions can be drawn to determine whether ISTJ and ESTJ
types in this research truly represent the psychological characteristics of the
majority of conference interpreters in Taiwan. As Huang suggested, a focalized
type distribution could also be attributed to a small sample size which resulted in
the under-representation of the less dominant types in the research. (Huang, 1991)
It is obvious that more samples are needed before the research findings can be
generalized to explain the entire group of interests. Nevertheless, in this present
study, interpretation of the psychological characteristics of ISTJ and ESTJ is
worthwhile because it appears to be one of the only ways to shed light on the
types that were most frequently attracted to the profession.
4.4.2 Discussion of Anxiety Analysis Results
Section 4.4.1 presents an interpretation and discussion of the anxiety analysis
results in five parts. The section begins with a discussion of subjects’ Trait Anxiety
scores and its effect on subjects’ State Anxiety scores, followed by discussion and
analysis of the effect of experience on State Anxiety scores. The discussion then
moves on to the effect of Trait Anxiety, Experience, and Gender on State Anxiety. The
last discussion is dedicated to the effect of personality on State Anxiety scores. The
section ends by summarizing the interpretation of the various Anxiety analysis results.
4.4.2.1 Subjects’ Trait Anxiety Level and Its Effect on State Anxiety Scores
Trait anxiety refers to the “relatively stable individual differences in anxiety
proneness, i.e., differences among people in the tendency to perceive a situation as
threatening and respond to these situations with differential elevations in State anxiety.
Persons who are high in anxiety proneness are disposed to perceive greater danger in
a given situation, which causes the elevation in State Anxiety (Spielberger, 1975). As
a result, many has naturally assumed that interpreters benefit from a less
anxiety-prone personality, and many had suggested that conference interpreters may
have a higher stress tolerance, or lower Trait Anxiety scores, in the context of this
present study.
In the research, subjects’ Trait Anxiety scores were compared to that of the
normative data based on Taiwanese general population (Zhong and Long, 1984).
Analysis results demonstrated that the difference between subjects’ and the general
population’s Trait Anxiety scores is statistically insignificant (t=0.43732, p=0.05).
Research findings refuted Hypothesis two that Participating interpreters’ average Trait
Anxiety scores are statistically lower than the normative data.
To further investigate the effect of subjects Trait Anxiety on their anxiety level
at work, the Trait anxiety scores were analyzed along with their State Anxiety scores.
Pearson correlation (r=0.387, p= 0.051), linear regression analysis, stepwise
multivariable regression analysis (t=0.452, p=0.656) have again demonstrated a weak
relationship between subjects’ State Anxiety score (dependent) and Trait Anxiety
score (independent). In other words, contrary to State-Trait Anxiety Theory, subjects’
Trait Anxiety scores were found to have minimal effect on their State Anxiety score.
This research finding refuted Hypothesis Four that participating interpreters’ Trait
Anxiety scores positively correlate with their State Anxiety scores..
To explore the possible explanations of the two observations, it is worthwhile to
revisit the literature review on interpreters’ job stressors as presented in chapter two.
Empirical studies had led to the conclusions that sources of to job stress resulting in
interpreters’ elevated anxiety at work include tremendous amount of concentration
required on the job, inconsideration on the part of the delegates, incompetent speakers,
preparation of the sessions, poor organization, poor working condition, and frequent
travel. However, moderating factors, such as interpreters’ natural stress tolerance
(Trait anxiety), experience, competency and motivation, exist to decrease the negative
effect of the aforementioned stressors.
In this research, analysis results nevertheless failed to demonstrate a significant
difference between subjects and the general population’s Trait Anxiety Scores;
moreover, results failed to show a significant effect of subjects’ Trait Anxiety on State
Anxiety. This suggests that the aforementioned moderating facotrs such interpreters’
working experience, competency and motivation may excerxise greater influence in
reducing interpreters’ work anxiety. Effect of interpreters’ working experience on
their anxiety at work is discussed in the following paragraph. As for other moderating
factors such as competency and motivation, further researches are needed to
investigate how the factors help to decreases interpreters’ anxiety at work.
4.4.2.2 Effect of Experience on State Anxiety Scores
State anxiety is an unpleasant emotional arousal in face of threatening demands
or dangers (Lazarus, 1991), and State anxiety, as reported by the same subject, can
vary according to the extent to which a situation is perceived as dangerous or
threatening by the person. In the this research, subjects’ State Anxiety is defined as the
temporarily elevated anxiety level measured by the self-report State-Trait Anxiety
Tests no earlier than one hour before subjects start interpreting simultaneously for a
conference. After subjects’ State Anxiety scores were obtained, statistical analysis
such as Pearson correlation, linear regression, multivariable regression, and stepwise
analysis were used to examine the relationship between subjects’ State Anxiety scores
and years of experience.
Pearson correlation (r=-0.590, p=0.002), linear regression (y= -0.8851x+ 50.25;
R2 = 0.3477), multivariable regression (t= -2.758, p= 0.011), and stepwise analysis (t=
-3.577, p=0.002) all demonstrated that subjects’ State Anxiety scores were
significantly influenced by years of experience; i.e., subjects’ experience in
conference interpreting was found to negatively correlate with their state anxiety
score.
The results conform to statements by several authors in the field that
anxiety can be viewed as a “state of apprehension, uneasiness and uncertainty
resulting from the anticipation of a threatening event,” it can also be said, based on
research findings, that the more subjects’ experience is, the less anxious, nervous, or
worried they feel when interpreting. The results confirmed Hypothesis Three that
participating interpreters’ State Anxiety scores negatively correlate with their years of
experience..
The findings of this research have led to the conclusions that subjects’ working
experience helps to decrease their anxiety level at work, but subjects’ Trait Anxiety
scores were found to have minimal effect in reducing State Anxiety scores. This
highlights the importance of interpreters’ acquired aptitude rather than their natural
abilities. For veteran or novice interpreters who are seeking ways to manage job stress
at work, the research findings demonstrated the benefit of accumulation of working
experience. For recruiters of interpreting students, the finding suggests an evaluation
approach from a long-term perspective. Instead of emphasizing candidates’ natural
anxiety proneness, it is more reasonable to evaluate whether the candidates in
question will be able to build up a reasonable stress tolerance level below which they
will not drop in the long run.
It’s worthy to note that despite the significant effect of experience on State
Anxiety level, there is currently no evidence that interpreters who are less anxious or