doi:10.6342/NTU201801250
國立臺灣大學工學院化學工程學研究所 碩士論文
Graduate Institute of Chemical Engineering College of Engineering
National Taiwan University Master Thesis
鹽類價數與奈米通道之幾何形狀對其整流行為的影響 Influences of Salt Valence and Geometric Shape of a
Nanochannel on Its Rectification Behavior
陳俞閔 Yu-Min Chen
指導教授:徐治平 博士 Advisor: Jyh-Ping Hsu, Ph.D.
中華民國 107 年 7 月 July, 2018
doi:10.6342/NTU201801250 I
中文摘要
在奈米流體尺度下,電雙層重疊效應顯著,使奈米通道可引起許多有趣的電動 力學現象,如離子濃度極化(ICP)和離子電流整流(ICR),也因而製備與合成奈米通
道成為奈米科技上的一股熱潮。在第一章節中,我們利用數值模擬的方法,考慮不
同電解質溶液LaCl3、CaCl2、KCl、KNO3、K2SO4,研究其離子價數比之不對稱性
對圓錐形奈米通道的離子整流效應所造成的影響。改變價數比時有兩種方式,第一
種方式是固定陰離子的價數,改變陽離子的價數;而第二種則是固定陽離子的價數
,改變陰離子的價數。我們發現,離子強度與離子擴散係數對其電動力學現象扮演
著舉足輕重的角色。另外,定性上帶正電的奈米通道之整流行為與帶負電的奈米通
道相似。
第二章節中,我們則是討論一表面具有pH 可調節電荷之兩性離子基團的仿生
雪茄形奈米通道。考慮在外加電場作用下,溶液酸鹼值pH、溶液鹽濃度、底端的
開口半徑以及奈米通道形狀對離子傳輸行為的影響。藉由調節孔口半徑與表面曲
率以得到雪茄形奈米通道的最佳整流表現與離子選擇性。除了能夠解釋相關電動
力學現象之外,所獲得的結果還為相關設備的複雜設計提供了必要的資訊。
關鍵字:電雙層;離子電流整流;圓錐形奈米通道;離子價數;兩性離子基團;雪 茄形奈米通道;形狀效應
doi:10.6342/NTU201801250 II
Abstract
The overlapping of electric double layer in a nano-scaled system is usually significant,
rendering it having profound and interesting electrokinetic phenomena, such as ion
concentration polarization (ICP) and ion current rectification (ICR), and thus fabrication
of nanodevices becomes a trend of nanotechnology. In Chapter 1, by taking account of various electrolyte solution LaCl3、CaCl2、KCl、KNO3, and K2SO4, a thorough numerical
simulation is conducted to illustrate the influence of asymmetry of various ionic valence
ratio on the ICR behavior in a conical nanochannel. We show that the electrokinetic
phenomena depend highly on ionic strength and ion diffusivity.The qualitative behavior
of the ion current rectification of a positively charged conical nanochannel is similar to
that of a negatively charged one.
In Chapter 2, we consider a bioinspired cigar-shaped nanochannel where its surface
is pH-regulated, and has zwitterionic groups. The influences of the solution pH, the bulk
concentration, the base opening radii, and the nanochannel shape on the associated ICR
behavior and ionic selectivity are examined, focusing on discussing the underlying mechanisms in detail. We show that the best nanochannel performance can be achieved
doi:10.6342/NTU201801250 III
by adjusting the base orifice radii and surface curvature appropriately. In addition to
proposing underlying mechanisms for the phenomena observed, the results gathered in
this study also provide necessary information for designing relevant devices.
Keywords: electric double layer; ion current rectification; conical nanochannel; ionic valence; zwitterionic groups; cigar-shaped nanochannel; shape effect
doi:10.6342/NTU201801250 IV
Contents
中文摘要………...I English Abstract………...II Contents………..IV List of Figures………..V List of Tables………....XII Chapter 1: Influence of Salt Valence on the Rectification Behavior
of Nanochannels………...1 Reference………20 Chapter 2: Electrokinetic Ion Transport in Cigar-Shaped Nanochannels
Functionalized with a pH-Tunable Zwitterionic Surface…...42 Reference………65 Conclusion ………...99
doi:10.6342/NTU201801250 V
List of Figures
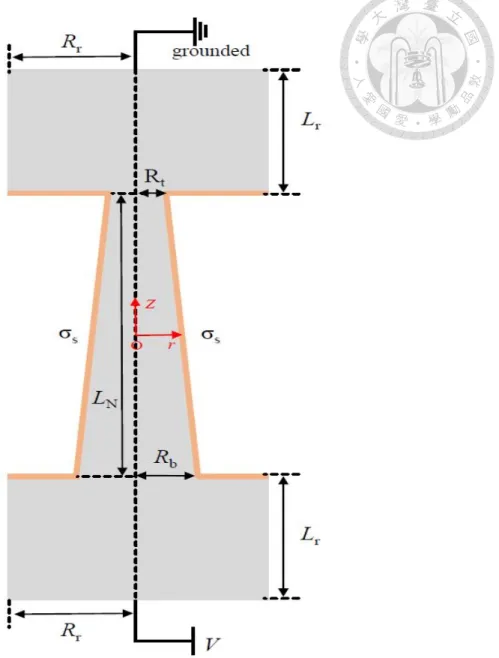
Figure 1-1. A conical nanochannel of axial length LN, tip radius Rt,,base radius Rb and
opening angle θ connecting two large, identical reservoirs of axial length Lr and radius Rr. The nanochannel surface and the reservoir side walls are homogeneously charged with density . A potential bias V is applied on one reservoir, and the other reservoir grounded
(0 V)………... ………….29
Figure 1-2. Variation of the I-V curve of various types of salt having the same anions
with the applied potential bias V at σs = −1 e/nm2,θ=6. (a): C0=300 mM; (b): C0=3
mM...30
Figure 1-3. Variation of the I-V curve of various types of salt having the same cations
with the applied potential bias V at σs = −1 e/nm2,θ=6. (a): C0=300 mM; (b): C0=3
mM………...31
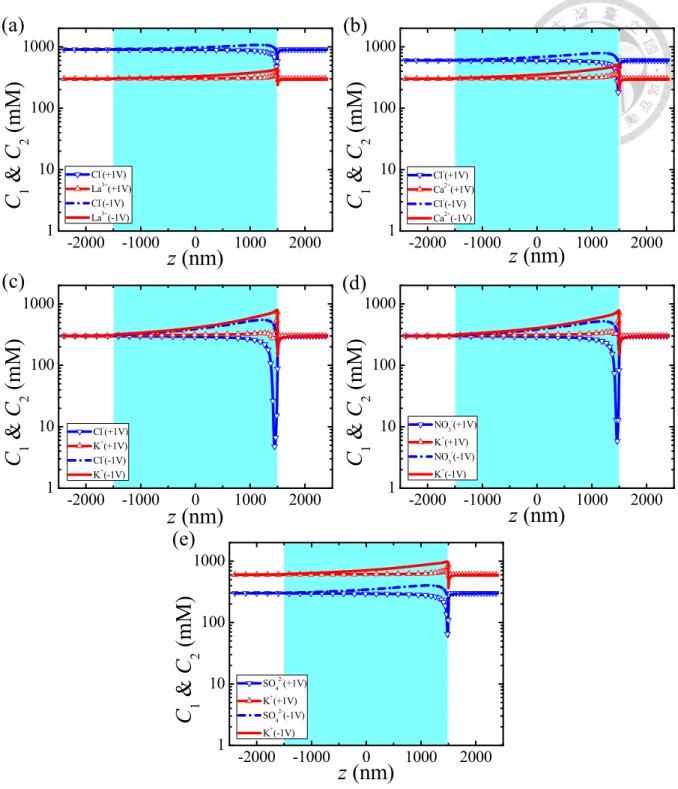
Figure 1-4. Axial variation in the cross sectional averaged concentration of cations
(anions) C1 (C2) for various types of salt at V=±1 V and C0=300 mM. (a) LaCl3, (b) CaCl2,
(c) KCl, (d) KNO3, (e) K2SO4. Red curves: C1; blue curves: C2………...32
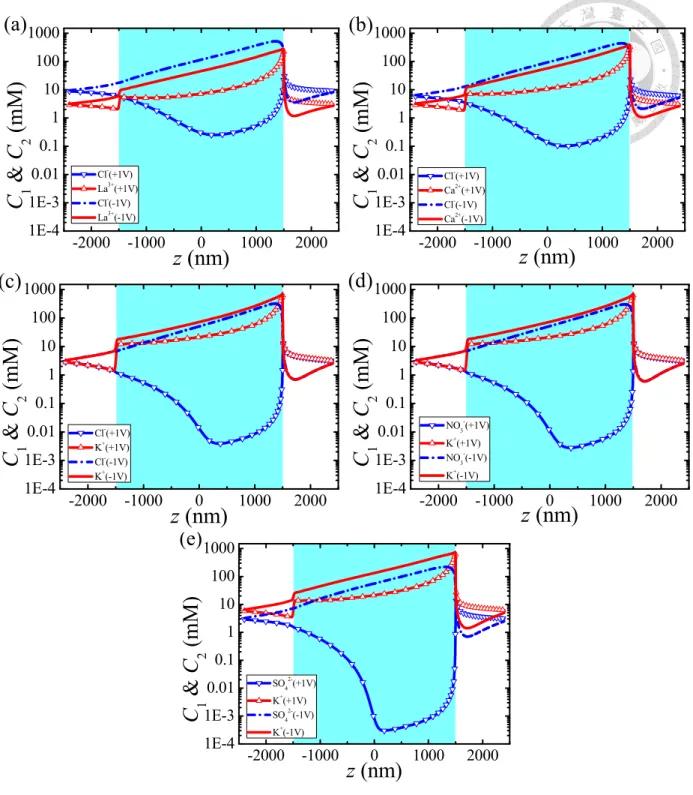
Figure 1-5. Axial variation in the cross sectional averaged concentration of cations (anions) C1 (C2) for various types of salt at V=±1 V and C0=3 mM. (a) LaCl3, (b) CaCl2,
doi:10.6342/NTU201801250 VI
(c) KCl, (d) KNO3, (e) K2SO4. Red curves: C1; blue curves: C2………....33
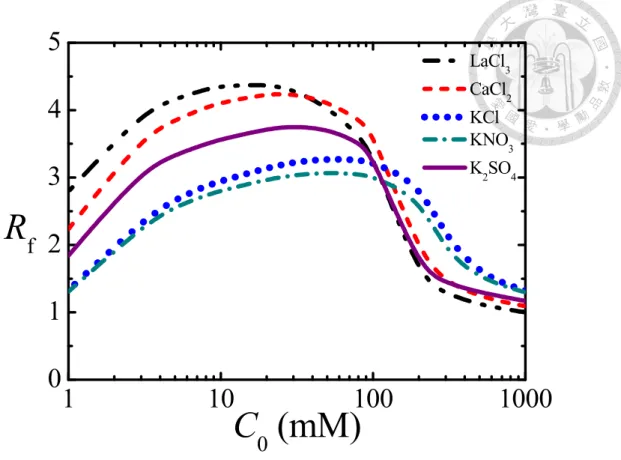
Figure 1-6. Variation in the rectification factor Rf with the bulk salt concentration C0 for
various types of salt at V=±1 V………..34
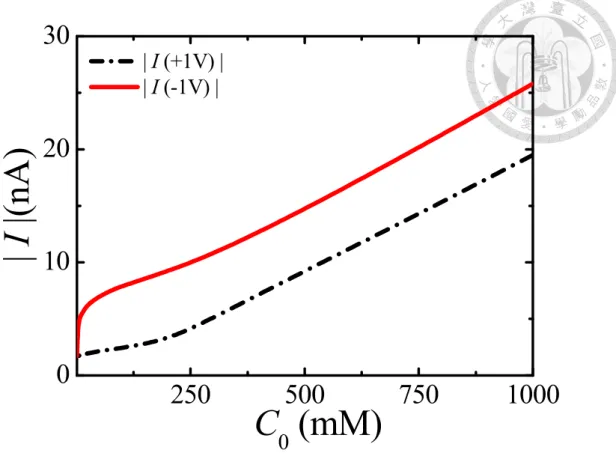
Figure 1-7. Variation in the magnitude of the ionic current |I| with the bulk salt
concentration C0 at V=±1 V for the case of KCl. Solid red curve: I(-1V); dashed black
curve: I(+1V)………..35
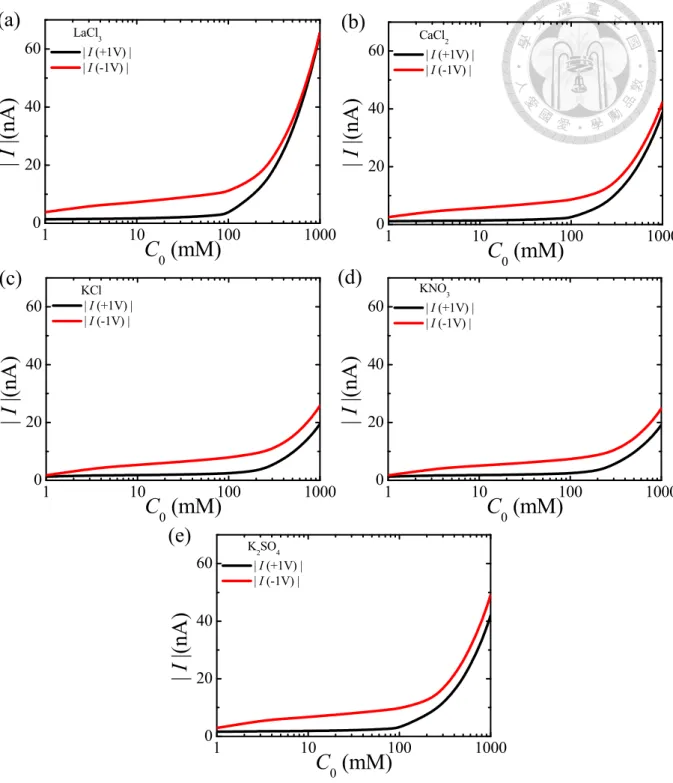
Figure 1-8. Variation in the magnitude of the ionic current |I| with the bulk salt
concentration C0 at V=±1 V for various types of salt………...36
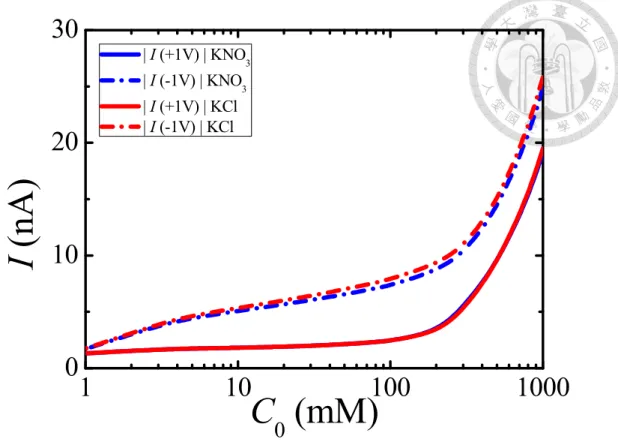
Figure 1-9.Ionic current I vs bulk salt concentration C0 at V=±1 V for KCl and KNO3.
Red curve: KCl; blue curve: KNO3; solid curve: V=+1V; short dash dot curve: V=-1V.
………....37
Figure 1-10.Variations of Rf (dashed curves) and (1/Rf) (solid curves) as a function
of C0 for various types of salt at V=±1 V and σs=+e/nm2. Black curve: LaCl3; red
curve: CaCl2; blue curve: KCl; green curve: KNO3; purple curve: K2SO4. …………..38
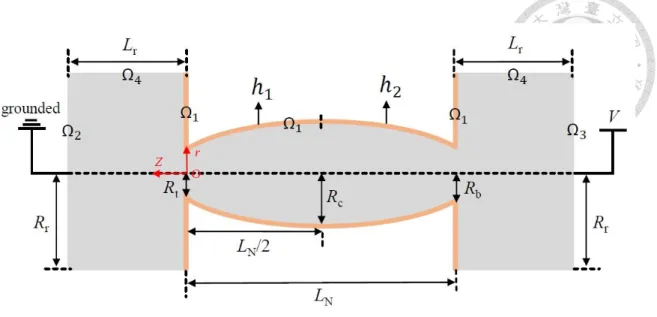
Figure 2-1. Schematic representation of the cigar-like nanochannel considered. r, θ, z, are the cylindrical coordinates adopted with the origin at the tip end center of the nanochannel, which is axial symmetry. Ω1 denotes the inner and outer surface of the
doi:10.6342/NTU201801250 VII
nanochannel, Ω2 ( Ω3) the surface of a computational domain perpendicular to the
nanochannel axis in the tip (base) end reservoir, and Ω4 the surface of the computational
domain parallel to the nanochannel axis in both reservoirs. A potential bias V is applied
on one reservoir, and the other reservoir grounded (0 V). ... 75
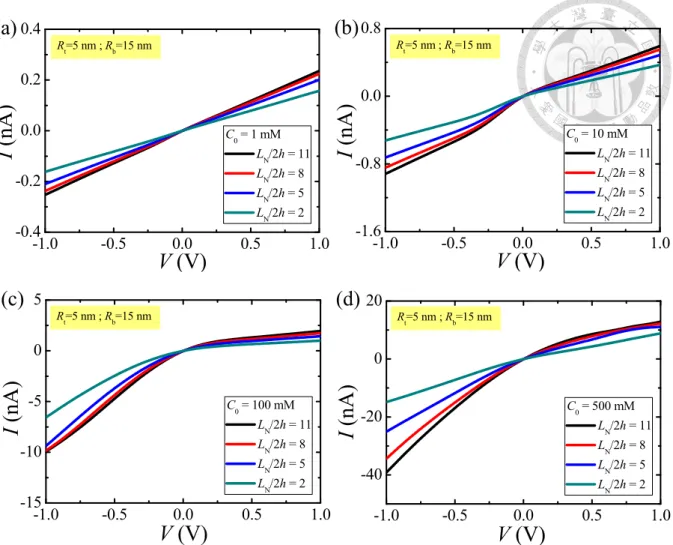
Figure 2-2(a)-(d). Simulated I−V curves for various combinations of C0 and (LN/2h) at
pH 10 and Rt=5 nm. Rb is 15 nm in (a)-(d).C0=1 mM in (a), C0=10 mM in (b), C0=100
mM in (c), and C0=500 mM in (d). ... 76
Figure 2-2(e)-(h). Simulated I−V curves for various combinations of C0 and (LN/2h) at
pH 10 and Rt=5 nm. Rb is 25 nm in (e)-(h).C0=1 mM in (e), C0=10 mM in (f), C0=100
mM in (g), and C0=500 mM in (h)……….77
Figure 2-3(a)-(d). Variation of Rf with (LN/2h) for various combinations of C0 and Rb at
pH 10 and Rt=5 nm. (a) C0=1 mM, (b) C0=10 mM, (c) C0=100 mM, and (d) C0=500
mM. ... 78
Figure 2-4(a)-(d). Axial variation in the cross sectional averaged ionic conductivity G at
pH 10, Rt=5 nm and Rb=25 nm for various levels of bulk salt concentration C0. (a) C0=1
mM, (b) C0=10 mM, (c) C0=100 mM, and (d) C0=500 mM. Solid curves: V=+1 V; solid
curves with discrete symbols: V=−1 V. Shaded region denotes the nanochannel interior.
doi:10.6342/NTU201801250 VIII
... 79
Figure 2-5. Variation in the selectivity S with the surface curvature (LN/2h) at pH 10 and
Rt=5 nm for Rb=15 nm, (a), and Rb=25 nm, (b). Solid curve: V=+1 V; solid curve with
discrete symbols: V=−1 V. ... 80
Figure 2-6(a)-(d). Simulated I−V curves for various combinations of C0 and (LN/2h) at
pH 4 and Rt=5 nm. Rb is 15 nm in (a)-(d).C0=1 mM in (a), C0=10 mM in (b), C0=100
mM in (c), and C0=500 mM in (d)………. ... 81
Figure 2-6(e)-(h). Simulated I−V curves for various combinations of C0 and (LN/2h) at
pH 4 and Rt=5 nm. Rb is 25 nm in (e)-(h).C0=1 mM in (e), C0=10 mM in (f), C0=100
mM in (g), and C0=500 mM in (h). ... 82
Figure 2-7(a)-(d). Variation of Rf with (LN/2h) for various combinations of C0 and Rb at
pH 4 and Rt=5 nm. (a) C0=1 mM, (b) C0=10 mM, (c) C0=100 mM, and (d) C0=500 mM.
... 83
Figure 2-8(a)-(d). Axial variation in the cross sectional averaged ionic conductivity G at
pH 4, Rt=5 nm and Rb=25 nm for various levels of bulk salt concentration C0. (a) C0=1
mM, (b) C0=10 mM, (c) C0=100 mM, and (d) C0=500 mM. Solid curves: V=+1 V; solid
curves with discrete symbols: V=−1 V. Shaded region denotes the nanochannel interior.
doi:10.6342/NTU201801250 IX
... 84
Figure 2-9. Variation in the selectivity S with the surface curvature (LN/2h) at pH 4 and
Rt=5 nm for Rb=15 nm, (a), and Rb=25 nm, (b). Solid curve: V=+1 V; solid curve with
discrete symbols: V=−1 V. ... 85
Figure 2-10. Variation in the Rf with pH for various combinations of C0 and (LN/2h) at
Rt=5 nm and Rb=25 nm. C0=10 mM in (a), C0=100 mM in (b)... ….86
Figure 2-11. Variation in the selectivity S with pH for various combinations of C0 and
(LN/2h) at Rt=5 nm and Rb=25 nm. C0=10 mM in (a), C0=100 mM in (b). Solid curve:
V=+1 V; solid curve with discrete symbols: V=−1 V ... ..87
Figure S1. Axial distribution of the cross sectional averaged electric field Ez,avg at pH 10,
Rt=5 nm, Rb=25 nm and C0=1 mM for V=+1 V (blue curve) and V=−1 V (red curve).
(LN/2h) is 2, (a), 5, (b), 8, (c), and 11, (d). Shaded area denotes nanochannel interior..88
Figure S2. Axial distribution of the cross sectional averaged electric field Ez,avg at pH 10,
Rt=5 nm, Rb=25 nm and C0=10 mM for V=+1 V (blue curve) and V=−1 V (red curve).
(LN/2h) is 2, (a), 5, (b), 8, (c), and 11, (d). Shaded area denotes nanochannel interior..89
Figure S3. Axial distribution of the cross sectional averaged electric field Ez,avg at pH 10,
Rt=5 nm, Rb=25 nm and C0=100 mM for V=+1 V (blue curve) and V=−1 V (red curve).
doi:10.6342/NTU201801250 X
(LN/2h) is 2, (a), 5, (b), 8, (c), and 11, (d). Shaded area denotes nanochannel interior..90
Figure S4. Axial distribution of the cross sectional averaged electric field Ez,avg at pH 10,
Rt=5 nm, Rb=25 nm and C0=500 mM for V=+1 V (blue curve) and V=−1 V (red curve).
(LN/2h) is 2, (a), 5, (b), 8, (c), and 11, (d). Shaded area denotes nanochannel interior..91
Figure S5. (a) Simulated I−V curve for various levels of (LN/2h) and (b) variation in Rf
with (LN/2h) at pH 4, Rt=5 nm, Rb=25 nm and C0=0.5 mM. ... 92
Figure S6. Axial distribution of the cross sectional averaged electric field Ez,avg at pH 4,
Rt=5 nm, Rb=25 nm and C0=1 mM for V=+1 V (blue curve) and V=−1 V (red curve).
(LN/2h) is 2, (a), 5, (b), 8, (c), and 11, (d). Shaded area denotes nanochannel interior..93
Figure S7. Axial distribution of the cross sectional averaged electric field Ez,avg at pH 4,
Rt=5 nm, Rb=25 nm and C0=10 mM for V=+1 V (blue curve) and V=−1 V (red curve).
(LN/2h) is 2, (a), 5, (b), 8, (c), and 11, (d). Shaded area denotes nanochannel interior..94
Figure S8. Axial distribution of the cross sectional averaged electric field Ez,avg at pH 4,
Rt=5 nm, Rb=25 nm and C0=100 mM for V=+1 V (blue curve) and V=−1 V (red curve).
(LN/2h) is 2, (a), 5, (b), 8, (c), and 11, (d). Shaded area denotes nanochannel interior..95
Figure S9. Axial distribution of the cross sectional averaged electric field Ez,avg at pH 4,
Rt=5 nm, Rb=25 nm and C0=500 mM for V=+1 V (blue curve) and V=−1 V (red curve).
doi:10.6342/NTU201801250 XI
(LN/2h) is 2, (a), 5, (b), 8, (c), and 11, (d). Shaded area denotes nanochannel interior..96
Figure S10. Axial variation in the cross sectional averaged ionic conductivity G at pH
7.5, Rt=5 nm and Rb=25 nm for various levels of bulk salt concentration C0. (a) C0=10
mM, (b) C0=100 mM. Solid curves: V=+1 V; solid curves with discrete symbols: V=−1
V. Shaded region denotes the nanochannel interior. ... 97
Figure S11. Axial variation in the cross sectional averaged ionic conductivity G at pH 2,
Rt=5 nm and Rb=25 nm for various levels of bulk salt concentration C0. (a) C0=10 mM,
(b) C0=100 mM. Solid curves: V=+1 V; solid curves with discrete symbols: V=−1 V.
Shaded region denotes the nanochannel interior. ... 98
doi:10.6342/NTU201801250 XII
List of Tables
Table 1-1. Percentage selectivity of anions, S= I−/I ×100%, at | V=±1 V, the ionic current
contributed by anions, I−, and the total ionic current, I, at V=-1V for KCl and KNO3 at two levels of C0.………...39
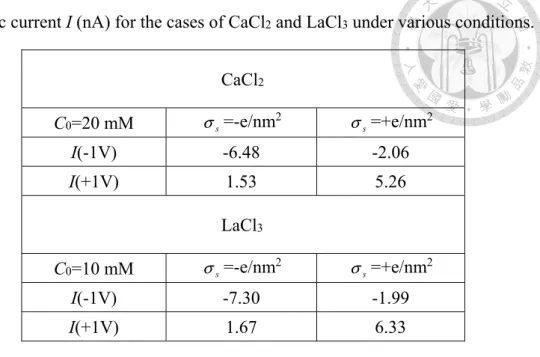
Table 1-2. Ionic current I (nA) for the cases of CaCl2 and LaCl3 under various conditions.
………..40
Table 1-3.Ionic current (nA) contributed by major and minor species for the cases of CaCl2
and LaCl3 under various conditions when ion enrichment occurs. …...40
Table 1-4.Ionic current I (nA) for the case of K2SO4 at C0=20 mM. ………...41
Table 1-5.Ionic current (nA) contributed by major and minor species for the case of K2SO4
at C0=20 mM when ion enrichment occurs……….….41
doi:10.6342/NTU201801250 1
Chapter 1
Influence of Salt Valence on the Rectification
Behavior of Nanochannels
doi:10.6342/NTU201801250 2
1-1. Introduction
Recent advances in nanoscience and nanotechnology lead to a considerable progress in preparing nanomaterials including, for instance, nanowires and quantum dots, and fabricating
nanodevices such as nanopores/nanochannels [1], nanopipettes, and nanoelectrodes. These
devices and associated techniques have been applied successfully in various areas such as control
of ionic transport [2-10] and detection, analysis, and separation of single nanoparticles [11-15].
The former includes, for instance, ionic gate [16-20], nanofluidic diode [21-26], and energy
storage [27-29]. The nanoparticles in the latter include, for example, DNA [30-32], proteins [33],
and biomolecules [34,35].
The overlapping of electrical double layer (EDL) in a nano-scaled system is usually
significant, rendering it having profound and interesting electrokinetic phenomena. For example,
the ionic current coming from the transport of ions in a nanopore may not obey Ohm's law [36]:
the magnitude of this current at a negatively applied potential bias can be different from that at a
positively applied potential bias. This yields a diode-like behavior, known as ion current
rectification (ICR) [36-45], first observed in a conical quartz nanopipette [36]. ICR resembles the
behavior of the ionic transport through the ion channels of a biological membrane.
It is generally accepted that ICR occurs to a conical nanopore if its diameter is comparable to
the associated Debye screening length (or thickness of EDL) [4]. The diameter of a conical
doi:10.6342/NTU201801250 3
nanopore varies along its axis, so is the degree of EDL overlapping. That is, the asymmetric
geometry of a conical nanopore leads to a non-uniform ionic distribution along its axis, resulting
in the ICR behavior. Several mechanisms are proposed to explain this behavior including, for
example, electric potential barrier inside a nanopore [37], electrochemical properties of the
nanopore tip [46,47], and ion enrichment/depletion inside a nanopore [48,49]. In addition to the
asymmetric geometry of a nanopore [50-52], ICR might also arise from several other factors,
such as the asymmetric charge distribution on the nanopore surface [26,53-56], an imposed salt
gradient [41,57], and nanoparticle blocking [58].
Recently, the ICR behavior of a conical nanopore has drawn the attention of many researches.
It is found that this behavior can be influenced by parameters including bulk salt concentration
[59], surface charge density [51,60], orifice diameter [51,59], cone angle [51,59], tip shape
[28,51,59], and pH [61-63]. However, most of the reported results focused on an aqueous KCl
solution; only few on other types of salt. Note that both the hydrated radius of ions and Debye
screening length depend upon the type of salt, so is the associated electrokinetic behavior. Several
efforts were made on analyzing the ICR for the case of divalent salts [64,65]. Neglecting the
effect of electroosmotic flow and adopting KCl and K2SO4 as representative salts, Perez-Mitta et
al. [64] studied the influence of the type of salt on the ionic current in an asymmetric nanopore.
They showed that the higher the valence of ions the larger the ionic current and the corresponding
doi:10.6342/NTU201801250 4
rectification factor. Wei et al. [65] investigated the electrokinetic behavior of a conical PET
nanopore by considering MgCl2, CaCl2, LiCl, NaCl, and KCl. They observed that as the bulk salt
concentration varies from 0.0001 to 1 M the rectification factor shows a local maximum. The
bulk salt concentration at which the rectification factor reaches its local maximum for bi-valent
cations is lower than that for mono-valent cations. In addition, the local maximum of the former
is larger than that of the latter. While these observations are interesting, the role that the ionic
valence plays has not been elaborated comprehensively. Extending their analysis, we examine
the electrokinetic behavior of a conical nanochannel by considering mono-, bi-, and tri-valent
ions in this study. In addition to a thorough simulation of the behavior of the system under various
conditions, the underlying mechanisms are discussed comprehensively.
1-2. Theory
As shown in Figure 1-1, we consider a conical nanochannel of axial length LN, tip radius Rt,
base radius Rb and opening angle θ (=tan-1(Rb-Rt)/LN) connecting two large, identical reservoirs of axial length Lr and radius Rr. The nanochannel and the two reservoirs are filled with an aqueous
salt solution. The nanochannel surface and the reservoir side walls are homogeneously charged with the charge densityσs. A potential bias V is applied on one reservoir, and the other reservoir
grounded (0 V). The electric field thus established drives the ions from one reservoir to the other,
doi:10.6342/NTU201801250 5
yielding an electroosmotic flow (EOF) through the nanochannel. We adopt the cylindrical
coordinates (r,θ, z) with its origin at the nanochannel center, and the system is axial symmetric.
Letting zj, Cj, vj, Dj,andu be the valence, the molar concentration, the velocity, the diffusion
coefficient of ionic species j, and the fluid velocity, respectively, the ionic flux Nj can be
expressed by Nernst-Planck equation,
( j j )
j j j j j j
C C D C z FC
RT φ
= = − ∇ + ∇
N v u , j=1, cations, 2, anions (1.1)
F, R, T, and φ are Faraday constant, gas constant, the absolute temperature, and the electric
potential, respectively. The conservation of ions yields
j 0
∇⋅N = (1.2)
If ρe is the space charge density of mobile ions, and ε the permittivity of the liquid phase,
the electrical potential φ can be described by Poisson equation
2 2
1
j j
e j
ρ z FC
φ ε = ε
∇ = − = − (1.3)
In our case, the Reynolds number of the EOF in a nanochannel is much smaller than unity,
that is, the fluid flow is in the creeping flow regime, and the flow field at steady state can be
described by the equation of continuity and the modified Navier-Stokes equation.
∇⋅ =u 0 (1.4)
2
p e
μ∇ −∇ − ∇ =u ρ φ 0 (1.5)
μ and p are the fluid viscosity and the hydrodynamic pressure, respectively.
doi:10.6342/NTU201801250 6
The following boundary conditions are assumed for Eqs. (1.1)-(1.5): (i) The two reservoirs
are large, so that the ionic concentration reaches the corresponding bulk value at a point sufficiently away from the nanochannel opening, Cj=Cj0, and the electric potentials are φ (z=-
(LN/2)-Lr)=V and φ (z=(LN/2)+Lr)=0. In addition, n⋅∇ =φ 0 and n N⋅ j =0 are assumed there,
where n is the unit outer normal vector. (ii) The nanochannel surface and the reservoir wall are ion-impenetrable so that n N⋅ j=0, and has the constant surface charge density σs = − ⋅∇εn φ.
This assumption is reasonable when the solution pH significantly deviates from the pKa of the
dissociable functional groups on the channel surface. In this case, the dissociation of the
functional groups on the nanochannel surface is almost complete so that the charge regulation
nature can be negligible [66]. (iii) The nanochannel surface and the reservoir walls are non-slip,
so that u=0. (iv) No external pressure gradient is applied. (v) Slip boundary condition for the
flow field are specified on the side boundaries of two reservoirs, which are far away from the
nanochannel.
If Ω is the surface of either reservoir end normal to the nanochannel axis, the ionic current I through the nanochannel is
1 1 2 2
( )
I F z z d
=Ω N + N ⋅n Ω (1.6)
1-3. Results and Discussion
doi:10.6342/NTU201801250 7
The set of nonlinear, coupled equations, Eqs. (1.1)-(1.5), are solved numerically by
COMSOL (version 4.3a, http://www.comsol.com), operated in a high-performance cluster. The
computational domain shown in Figure 1-1 is discretized into quadratic triangular elements, and
non-uniform elements are employed. Greater number of elements is assigned locally as necessary.
Typically, using a total number of 183640 elements is sufficient for recovering convergent result.
The behavior of the system under consideration is examined under various conditions through
numerical simulation. For illustration, we assume LN=3000 nm, Rt=5 nm, Lr=Rr=1000 nm [66], 6.95 1010F/m
ε= × − , and μ=10 Pa s−3 ⋅ . Five types of salt are considered: KCl, CaCl2, LaCl3,
KNO3, and K2SO4. At T=298.15 K, +
9 2
K 1.96 10 m /s
D = × − , 2+
10 2 Ca 7.93 10 m /s
D = × − ,
3+
10 2 La 6.17 10 m /s
D = × − , -
9 2
Cl 2.03 10 m /s
D = × − , -
3
9 2
NO 1.90 10 m /s
D = × − , and
2-4
9 2
SO 1.07 10 m /s
D = × − . The ionic size effect is negligible because the hydration radius for all ions
examined are less than 0.4 nm [67], which are much smaller than the smallest length scale of the
considered system (i.e., 5 nm). Moreover, the present continuum-based model is valid for
capturing the ion transport phenomena in the nanochannel as long as the length scale is larger
than 5 nm [68].
1-3.1 Influence of Cation Valence on the ICR Behavior
The influence of the valence of cations on the ICR behavior of a negatively charged
doi:10.6342/NTU201801250 8
nanochannel is illustrated in Figure 1-2, where the simulated I-V curves of various types of salt
having the same anions are shown for two levels of the bulk salt concentration C0.
Since the potential bias V is applied to the base-end reservoir and the tip-end reservoir
grounded, the ionic current I is directed from the based end of the nanochannel to its tip end (i.e.,
I>0) when V>0, and reversed when V<0 (i.e., I<0). Because the nanochannel is negatively
charged, |I(V<0)|>|I(V>0)|, yielding a diode-like or ICR behavior. Since the lower the bulk salt
concentration the thicker the double layer, this behavior is enhanced if C0 is low.
As seen in Figure 1-2(a), the magnitudes of the ion current rank as I(LaCl3)>I(CaCl2)>I(KCl),
regardless of the sign of the applied potential bias. This is because the ionic strength ranks as
LaCl3>CaCl2>KCl, so is the associated ionic current. In this case, because the bulk salt
concentration is high (300 mM), the overlapping of electric double layer is unapparent, and
therefore, ICR phenomenon is insignificant. However, if the bulk salt concentration is low (3
mM), ion depletion (enrichment) occurs in the conical nanochannel when the applied potential
bias is positive (negative). The depletion of ions not only leads to a decrease in the concentration
of mobile ions but also an increase in the Debye length (or electric double layer thickness), which
is the screening length of the surface charge produced by the counterions. In the extreme case
where anions are completely excluded by the negatively charged nanochannel, the ionic current
is contributed solely by cations (counterions), so that it depends upon their concentration, valence,
doi:10.6342/NTU201801250 9
and diffusion coefficient due to Nernst-Planck equation. Therefore, I(KCl)>I(LaCl3)>I(CaCl2)
for the same bulk salt concentration. Similarly, if ion enrichment occurs in the nanochannel (V<0),
the concentration of mobile ions increases and Debye length decreases. For the same bulk salt
concentration, the concentration of Cl− ranks as LaCl3>CaCl2>KCl, so that I(LaCl3)>I(CaCl2)>I(KCl).
1-3.2 Influence of Anion Valence on the ICR Behavior
Figure 1-3 illustrates the influence of anions valence on the ICR behavior of a negatively charged nanochannel, where the salts examined have the same cations.
As seen in Figure 1-3(a), the ionic currents associated with the salts examined rank as
I(K2SO4)>I(KCl)≅I(KNO3), regardless of the sign of the applied potential bias. If the bulk salt
concentration is sufficiently high (300 mM), the overlapping of electric double layer is
insignificant, so is the corresponding ICR behavior.In this case, because the ionic strength ranks
as K2SO4>KCl=KNO3, the associated ionic current should follow the same trend. However,
I(KCl) is slightly larger than I(KNO3) at a negative applied potential bias. This is because
- -
Cl NO3
D >D .
Table 1-1 summarizes the percentage selectivity of anions, S= I−/I ×100% with I− being
the ionic current contributed by anions, at two levels of salt concentration. The selectivity of
doi:10.6342/NTU201801250 10
anions at V=-1 V is seen to be much larger than that at V=+1 V. Table 1-1 implies that although
the nanochannel is negatively charged (i.e., cation selective) the ionic current is also influenced by the transport of anions, especially when V<0, because the selectivity of anions (Cl−andNO3−) is appreciable. Note that if V<0, since - -
Cl NO3
D >D , the amount of Cl−entering the nanochannel is
greater than that of NO3−, and therefore, the ionic current contributed byCl−is larger than that by
NO3−. To maintain electroneutrality, the amount of K+ coming from KCl is greater than that from KNO3, so that the ionic current contributed by the K+ from KCl is greater than that from KNO3.
Due to these two effects, I(KCl)>I(KNO3) when V<0, as is seen in Table 1-1. If V>0, the
selectivity of the cations of KCl and KNO3 (i.e., K+) exceeds 99 % so that the ionic current of
KCl is almost the same as that of KNO3. However, if the bulk salt concentration is low (3 mM),
the ionic concentration in the nanochannel for V>0 is lower than that for V<0, especially for
anions. If V>0, the depletion of ions leads to a decrease in the concentration of mobile ions, and
therefore, an increase in the thickness of electric double layer. At the low level of C0 (3 mM),
anions are almost completely excluded from the nanochannel so that the mobile ions inside it are
essentially cations, the concentration of which is governed by its surface charge. Therefore, the
concentrations of cations at V>0 for the types of salt examined are almost the same. In this case,
since the ionic current is contributed mainly by cations (K+), the ionic current is insensitive to the
type of salt, as seen in Figure 1-3(b). Similarly, if V<0, the enrichment of ions in the nanochannel
doi:10.6342/NTU201801250 11
yields a decrease in the thickness of electric double layer. In this case, because the ionic current
is governed by the ionic strength and the diffusion coefficient of ions, I(K2SO4)>I(KCl)
≅
I(KNO3).
To further explain the results shown in Figure 1-2 and Figure 1-3, we plot the axial variation
in the cross sectional averaged concentration of cations, C1, and that of anions, C2, under various
conditions in Figure 1-4 and Figure 1-5. Here, the concentration profile of KNO3 is similar to
that of KCl, except that the latter is slightly higher than the former. As can be seen in Figure 1-4
and Figure 1-5, the concentration of anions correlates with that of cations, which originates from
the ratio of the salt valence in the bulk phase. For example, in the case of K2SO4 the bulk concentration of K+ is twice that of SO24−. Due to ion enrichment/depletion, the concentration of
anions inside the negatively charged nanochannel for V <0 is much higher than that for V>0.
If V<0, the induced negative axial electric field inside the nanochannel attracts the cations in
the tip-end reservoir towards the nanochannel tip. These ions tend to accumulate there due to the
attraction of the fixed charge, yielding a local maximum in the concentration profile. To maintain
electroneutrality, the anions of the tip-end reservoir are also driven towards the nanochannel tip
so that its concentration profile is similar to that of cations. The accumulation of ions near the
nanochannel tip leads to a higher current. On the other hand, if V>0, cations are driven out of the
nanochannel by the induced electric field, so are anions to maintain electroneutrality. The
doi:10.6342/NTU201801250 12
decrease in the ion concentration makes the ionic current smaller than that for V<0. Therefore,
Rf=|I(V=-1 V)/I(V=+1 V)|>1, and the nanochannel exhibits an ICR behavior. Note that the
concentration of cations near the nanochannel tip for V>0 is still appreciable. This is because the
decrease in the concentration of mobile ions makes the overlapping of electric double layer
significant, especially when the bulk salt concentration is low.
1-3.3 Influence of Bulk Salt Concentration on the ICR Behavior
Figure 1-6 reveals that for all the types of salt examined the rectification factor Rf has a local maximum as the bulk salt concentration C0 varies. We choose the case of KCl as an example to
explain this behavior.
As shown in Figure 1-7, since the nanochannel is negatively charged, the ionic current at a
negatively applied potential bias is larger than that at the corresponding positively applied
potential bias (i.e., |I(V<0)|>|I(V>0)|). Differentiating |I(V<0)/I(V>0)| with respect to C0 yields
0 0
2 0
| ( 0) | ( | ( 0) | / ) | ( 0) | ( | ( 0) | / )
| ( 0) / ( 0) |
| ( 0) |
I V d I V dC I V d I V dC
d I V I V
dC I V
> < − < >
< > =
> (1.7)
Figure 1-7 shows that the slopes of the curves are positive, that is, d|I(V<0)|/dC0>0 and
d|I(V>0)|/dC0>0. If C0 is low (<60 mM), d|I(V<0)|/dC0>>d|I(V>0)|/dC0, and although
|I(V<0)|>|I(V>0)|, d|I(V<0)/I(V>0)|/dC0>0, implying that |I(V<0)/I(V>0)| increases with
increasing C0. This is consistent with the results seen in Figure 1-6. In contrast, if C0 is high (>60
doi:10.6342/NTU201801250 13
mM), d I V| ( <0) | /dC0 ≅d I V| ( >0) | /dC0. In this case, because |I(V<0)|>|I(V>0)|,
d|I(V<0)/I(V>0)|/dC0<0, implying that |I(V<0)/I(V>0)| decreases with increasing C0. This also
agrees with the results seen in Figure 1-6. These explain the presence of the local maximum of
Rf at C0≅60 mM for the case of KCl. A similar reasoning was given by Cervera et al. [59]. In fact,
if the bulk salt concentration C0 is adjusted from high C0 to moderate C0, because the electric
double layer (EDL) becomes thicker, the EDL overlapping is more significant, and thus the ICR
effect is more appreciable, yielding a larger Rf. However, if the bulk salt concentration C0 is
further adjusted from moderate C0 to lower C0, because the transport ion amounts are too
insufficient to generate enough ionic flux, and although the EDL overlapping is quite obvious,
the ICR behavior gradually disappears, leading to a decline of Rf. This is why the Rf shows a
local maximum as C0 varies.
When the negative charge on the nanochannel surface is balanced by an excess amount of
cations in the electric double layer, the rectification factor Rf reaches its maximum value Rf(max).
Since multivalent cations carry more amount of charge than monovalent ions, the former has a
stronger shielding effect than the latter, and therefore, the Rf(max)of the former is reached at a
lower salt concentration. In our case, the salt concentrations of KCl, CaCl2, and LaCl3 at which
Rf(max) occurs are ca. 60 mM, 20 mM, and 10 mM, respectively. Note that, however, regardless
of the type of salt, Rf(max) occurs at about the same ionic strength or double layer thickness. This
doi:10.6342/NTU201801250 14
explains the shift in the salt concentration at which Rf(max) occurs with increasing cation valence,
which was observed experimentally by Wei et al. [65]. Similarly, the salt concentration at which
Rf(max) occurs also shifts to a lower level as the valence of anions increases. For instance, the Rf(max)
for the case of KCl occurs at C0≅60 mM, but at C0≅20 mM for the case of K2SO4. Again,
they occur at about the same ionic strength or electric double layer thickness. If two salts have
the same valences in cations and anions, the levels of the salt concentration at which Rf(max) occurs
are the same, but the value of Rf(max) depends upon ionic diffusivity. For example, because the
diffusivity of Cl− is larger than that of NO3−, Rf(KCl)>Rf(KNO3). We conclude that the salt
concentration at which Rf(max) occurs depends mainly on the asymmetry of ionic valence ratio.
For the cases of K2SO4 (1:2) and CaCl2 (2:1), the salt concentrations (or ionic strength) at which Rf(max) occur are also about the same (C0≅20 mM). It can be shown that the ionic strength (or
electric double layer thickness) at which Rf(max) occurs is independent of the type of salt. In
addition, the Rf(max) of the multi-valent salt is larger than that of the mono-valent salt, as observed
experimentally by Wei et al. [65]
As seen in Figure 1-8, since the nanochannel is negatively charged, |I(V<0)|>|I(V>0)|. Note that the greater the difference between |I(V<0)| and |I(V>0)| the larger the Rf, and the smaller the
difference between them the closer the Rf to unity. Figure 1-8 also reveals that if C0 is sufficiently
high, the higher the valence of ions the faster the rate of increase of I with increasing C0 at V>0,
doi:10.6342/NTU201801250 15
and I(V>0) approaches I(V<0). This is because the higher the ionic strength the thinner the electric
double layer, and therefore, less significant the rectification behavior of the nanochannel.
Figure 1-6 also indicates that if C0 is low, the rectification factor of the salts having common
anions ranks as Rf(LaCl3)>Rf(CaCl2)>Rf(KCl), but this order is reversed if C0 is high. This is
because if C0 is low, the difference between |I(V<0)| and |I(V>0)| for the types of salt examined
ranks as LaCl3>CaCl2>KCl, but becomes KCl>CaCl2>LaCl3 if C0 is high. If C0 is low, the Rf for
the salts having the same cations in Figure 1-6 ranks as Rf(K2SO4)>Rf(KCl)≅ Rf(KNO3), but this
order becomes reversed if C0 is high. Again, this can be explained by the difference between
|I(V<0)| and |I(V>0)|. Therefore, we conclude that if the bulk salt concentration is low, the
rectification factor ranks as Rf(multi-valent salt)>Rf(mono-valent salt). However, if it is high,
then Rf(mono-valent salt)>Rf(multi-valent salt). This behavior was observed experimentally by
Wei et al. [65]
If two types of salt have the same cations and the same valence ratio, the relative magnitude
of the corresponding rectification factors depends upon the diffusivity of anions. For example,
because the diffusivity of Cl− is larger than that of NO3−, Rf(KCl)>Rf(KNO3). Note that the
concentration of anions in a negatively charged nanochannel for V<0 is much higher than that for
V>0. In addition, as shown in Table 1-1, the selectivity of anions for V<0 is much larger than that for V>0. Because the selectivity of anions (Cl−and NO3−) is appreciable, they contribute
doi:10.6342/NTU201801250 16
appreciably to the ionic current I, especially when V<0, although I is contributed mainly by
cations. As mentioned previously, if V<0, because the diffusivity of Cl− is larger than that of
NO3− the amount of Cl− entering the nanochannel is greater than that of NO3− so that the ionic current contributed by Cl− is larger than that byNO3−. To maintain electroneutrality, the amount
of K+ coming from KCl is greater than that from KNO3, implying that the ionic current
contributed by the former is larger than that by the latter. Therefore, if V<0, I(KCl)>I(KNO3), as
seen in Table 1-1.
If V>0, the selectivity of cations in the cases of KCl and KNO3 exceeds 99 %. Since the
cations in these two cases are the same, the corresponding ionic currents are almost the same.
However, Figure 1-6 shows that the values of Rf in those two cases are different appreciably. As
illustrated in Figure 1-9, this is because the associated ionic currents are different if V<0. Note
that if V<0, since the diffusivity of Cl− is larger than that of NO3−, I(KCl)>I(KNO3).
1-3.4 Influence of the Charged Nature of Nanochannel on the ICR Behavior
The rectification factor of a positively charged nanochannel needs be defined as |I(+V)/I(- V)|=(1/Rf) so that it can be compared with that of a negatively charged nanochannel. The profile
of (1/Rf) for a positively charged nanochannel presented in Figure 1-10 is similar to that of Rf for
the corresponding negatively charged nanochannel. If C0 is low, the (1/Rf) for the salts having
doi:10.6342/NTU201801250 17
the same anions ranks as LaCl3>CaCl2>KCl, and for the salts having the same cation as
K2SO4>KCl≅KNO3. In contrast, if C0 is high, the (1/Rf) for the salts having the same anion ranks
as KCl>CaCl2>LaCl3, and KCl≅KNO3>K2SO4 for the salts having the same cation. In addition,
the level of C0 at which the local maximum of (1/Rf) occurs depends upon the salt valence: the
higher the valence the lower that level is. We conclude that the qualitative behavior of the ionic
current rectification of a positively charged conical nanochannel is similar to that of a negatively
charged one. Note that, however, the values of (1/Rf) for both CaCl2 and LaCl3 at σs=+e/nm2
are much smaller than the corresponding values of Rf at σs=-e/nm2.
Table 1-2 reveals that if σs=+e/nm2, ion depletion occurs when V<0, and if σs=-e/nm2, ion
depletion occurs when V>0. This can be explained by that if ion depletion occurs to a positively
charged nanochannel, the ionic current is contributed mainly by anions, that is, anions (cations)
are the major (minor) species. In contrast, cations (anions) are the major (minor) species for a
negatively charged nanochannel. In the case of Table 1-2 if σs=+e/nm2, Cl− is the major
species and other cations are the minor species; if σs=-e/nm2, Cl− becomes the minor species
and other cations are the major ionic species. Since the concentration of Cl− is higher than that of the other cations, and the diffusivity of Cl− larger than those of the other cations, I
(
+e/nm2)
> I
(
-e/nm2)
and the observed behavior in the ionic current is reasonable.If σs=+e/nm2, ion enrichment occurs when V>0, and if σs=-e/nm2, ion enrichment occurs
doi:10.6342/NTU201801250 18
when V<0. As shown in Table 3, because the ionic currents contributed by the major species of
the salts examined are almost the same, the relative magnitude of the ionic current depends mainly upon the types of coions (i.e., minor species). If σs=-e/nm2, Cl− is coion, and if σs
=+e/nm2, Ca2+ and La3+ are coion. Because the concentration of Cl− is higher that of Ca2+ and
La3+ and the diffusion coefficient of Cl− larger than that of Ca2+ and La3+, the magnitude of the ionic current at σs=-e/nm2 is greater than that at σs=+e/nm2. Therefore, for both CaCl2 and
LaCl3 the Rf at σs=-e/nm2 is larger than the corresponding (1/Rf) at σs=+e/nm2.
However, for the case of K2SO4, 1/Rf(σs=+e/nm2)>Rf(σs=-e/nm2). This is because if σs
=+e/nm2, ion depletion occurs when V<0, and if
σ
s=-e/nm2, ion depletion occurs when V>0.The major species is SO24− at σs=+e/nm2, and K+ at σs=-e/nm2. Since the concentration of
2
SO4− is lower than that of K+ and the diffusion coefficient of SO24− is smaller than that of K+,
(
+e/nm2)
I < I
(
-e/nm2)
, as seen in Table 1-4.If
σ
s=+e/nm2, ion enrichment occurs when V>0, and if σs=-e/nm2, ion enrichment occurs when V<0. As shown in Table 1-5, the magnitude of the ionic current contributed by majorspecies at σs=+e/nm2 is almost the same as that at σs=-e/nm2, the relative magnitude of the
ionic currents depends mainly on minor species (coion). In the present case SO24− is coion at σs
=-e/nm2, and it is K+ at
σ
s=+e/nm2. Because the concentration of SO24− is lower than that of K+ and the diffusion coefficient of SO24− smaller than that of K+, the magnitude of the ionic currentdoi:10.6342/NTU201801250 19
at σs=-e/nm2 is smaller than that at σs=+e/nm2. Therefore, the Rf at σs=-e/nm2 is smaller than
the (1/Rf) at σs=+e/nm2.
1-4. Conclusions
We analyze theoretically the influence of the ionic valence on the electrokinetic behavior of
a conical nanochannel, in particular, its current-voltage characteristics and ionic current
rectification (ICR) phenomenon. Typical salts including KCl, KNO3, K2SO4, CaCl2, and LaCl3
are considered, for illustration. Due to the difference in the ionic strength and the diffusivity of
ions, the behaviors of the current-voltage curves for the types of salt examined are different both
quantitatively and qualitatively. The rectification factor has a local maximum as the salt
concentration increases. In addition, the local maximum position is related to the asymmetry of
salt valence ratio: the higher the ionic valence the lower the salt concentration at which the
rectification factor has the local maximum. However, the maximal rectification factor occurs at
the same ionic strength, regardless of the type of salt, implying that the thickness of electric
double layer plays the key role.The ICR behavior of a positively charged conical nanochannel
is qualitatively similar to that of a negatively charged nanochannel.
doi:10.6342/NTU201801250 20
References
[1] Z. Siwy, A. Fulinski, Fabrication of a synthetic nanopore ion pump, Phys. Rev. Lett., 89 (2002)
198103.
[2] X. Hou, W. Guo, L. Jiang, Biomimetic smart nanopores and nanochannels, Chem. Soc. Rev.,
40 (2011) 2385-2401.
[3] W. Guo, Y. Tian, L. Jiang, Asymmetric ion transport through ion-channel-mimetic solid-state
nanopores, Acc. Chem. Res., 46 (2013) 2834-2846.
[4] R.B. Schoch, J.Y. Han, P. Renaud, Transport phenomena in nanofluidics, Rev. Mod. Phys., 80
(2008) 839-883.
[5] D.G. Haywood, A. Saha-Shah, L.A. Baker, S.C. Jacobson, Fundamental studies of
nanofluidics: nanopores, nanochannels, and nanopipets, Anal. Chem., 87 (2015) 172-187.
[6] Z.D. Harms, D.G. Haywood, A.R. Kneller, S.C. Jacobson, Conductivity-based detection
techniques in nanofluidic devices, Analyst, 140 (2015) 4779-4791.
[7] L. Luo, S.R. German, W.J. Lan, D.A. Holden, T.L. Mega, H.S. White, Resistive-pulse analysis
of nanoparticles, Annu. Rev. Anal. Chem., 7 (2014) 513-535.
[8] Y.H. He, M. Tsutsui, C. Fan, M. Taniguchi, T. Kawai, Controlling DNA translocation through
gate modulation of nanopore wall surface charges, ACS Nano, 5 (2011) 5509-5518.
[9] J.P. Hsu, T.W. Lin, C.Y. Lin, S.J. Tseng, Salt-dependent ion current rectification in conical
doi:10.6342/NTU201801250 21
nanopores: impact of salt concentration and cone angle, J. Phys. Chem. C, 121 (2017) 28139-
28147.
[10] J.P. Hsu, S.T. Yang, C.Y. Lin, S. Tseng, Ionic current rectification in a conical nanopore:
influences of electroosmotic flow and type of salt, J. Phys. Chem. C, 121 (2017) 4576-4582.
[11] C. Dekker, Solid-state nanopores, Nature Nanotech., 2 (2007) 209-215.
[12] S. Howorka, Z. Siwy, Nanopore analytics: sensing of single molecules, Chem. Soc. Rev., 38
(2009) 2360-2384.
[13] S. Lee, Y.H. Zhang, H.S. White, C.C. Harrell, C.R. Martin, Electrophoretic capture and
detection of nanoparticles at the opening of a membrane pore using scanning electrochemical
microscopy, Anal. Chem., 76 (2004) 6108-6115.
[14] J.E. Wharton, P. Jin, L.T. Sexton, L.P. Horne, S.A. Sherrill, W.K. Mino, C.R. Martin, A
method for reproducibly preparing synthetic nanopores for resistive-pulse biosensors, Small,
3 (2007) 1424-1430.
[15] Y.H. Qiu, C.Y. Lin, P. Hinkle, T.S. Plett, C. Yang, J.V. Chacko, M.A. Digman, L.H. Yeh, J.P.
Hsu, Z. Siwy, Highly charged particles cause a larger current blockage in micropores
compared to neutral particles, ACS Nano, 10 (2016) 8413-8422.
[16] W. Guo, H.W. Xia, L.X. Cao, F. Xia, S.T. Wang, G.Z. Zhang, Y.L. Song, Y.G. Wang, L. Jiang,
D.B. Zhu, Integrating ionic gate and rectifier within one solid-state nanopore via modification
doi:10.6342/NTU201801250 22
with dual-responsive copolymer brushes, Adv. Funct. Mater., 20 (2010) 3561-3567.
[17] A.E. Abelow, O. Schepelina, R.J. White, A. Vallee-Belisle, K.W. Plaxco, I. Zharov,
Biomimetic glass nanopores employing aptamer gates responsive to a small molecule, Chem.
Commun., 46 (2010) 7984-7986.
[18] M. Ali, S. Mafe, P. Ramirez, R. Neumann, W. Ensinger, Logic gates using nanofluidic diodes
based on conical nanopores functionalized with polyprotic acid chains, Langmuir, 25 (2009)
11993-11997.
[19] K. Xiao, G.H. Xie, P. Li, Q. Liu, G.L. Hou, Z. Zhang, J. Ma, Y. Tian, L.P. Wen, L. Jiang, A
biomimetic multi-stimuli-response ionic gate using a hydroxypyrene derivation-
functionalized asymmetric single nanochannel, Adv. Mater., 26 (2014) 6560-6565.
[20] Q. Liu, K. Xiao, L.P. Wen, H. Lu, Y.H. Liu, X.Y. Kong, G.H. Xie, Z. Zhang, Z.H. Bo, L.
Jiang, Engineered ionic gates for ion conduction based on sodium and potassium activated
nanochannels, J. Am. Chem. Soc., 137 (2015) 11976-11983.
[21] H. Daiguji, Y. Oka, K. Shirono, Nanofluidic diode and bipolar transistor, Nano Lett., 5 (2005)
2274-2280.
[22] R. Karnik, C.H. Duan, K. Castelino, H. Daiguji, A. Majumdar, Rectification of ionic current
in a nanofluidic diode, Nano Lett., 7 (2007) 547-551.
[23] I. Vlassiouk, Z.S. Siwy, Nanofluidic diode, Nano Lett., 7 (2007) 552-556.
doi:10.6342/NTU201801250 23
[24] R.X. Yan, W.J. Liang, R. Fan, P.D. Yang, Nanofluidic diodes based on nanotube
heterojunctions, Nano Lett., 9 (2009) 3820-3825.
[25] M. Ali, P. Ramirez, S. Mafe, R. Neumann, W. Ensinger, A pH-tunable nanofluidic diode
with a broad range of rectifying properties, ACS Nano, 3 (2009) 603-608.
[26] C.Y. Li, F.X. Ma, Z.Q. Wu, H.L. Gao, W.T. Shao, K. Wang, X.H. Xia, Solution-pH-
modulated rectification of ionic current in highly ordered nanochannel arrays patterned with
chemical functional groups at fesigned positions, Adv. Funct. Mater., 23 (2013) 3836-3844.
[27] J. Gao, W. Guo, D. Feng, H.T. Wang, D.Y. Zhao, L. Jiang, High-performance ionic diode
membrane for salinity gradient power generation, J. Am. Chem. Soc., 136 (2014) 12265-
12272.
[28] J. Cervera, P. Ramirez, S. Mafe, P. Stroeve, Asymmetric nanopore rectification for ion
pumping, electrical power generation, and information processing applications, Electrochim.
Acta, 56 (2011) 4504-4511.
[29] J.P. Hsu, S.C. Lin, C.Y. Lin, S. Tseng, Power generation by a pH-regulated conical nanopore
through reverse electrodialysis, J. Power Sources, 366 (2017) 169-177.
[30] J. Clarke, H.C. Wu, L. Jayasinghe, A. Patel, S. Reid, H. Bayley, Continuous base
identification for single-molecule nanopore DNA sequencing, Nat. Nanotechnol., 4 (2009)
265-270.
doi:10.6342/NTU201801250 24
[31] W. Vercoutere, S. Winters-Hilt, H. Olsen, D. Deamer, D. Haussler, M. Akeson, Rapid
discrimination among individual DNA hairpin molecules at single-nucleotide resolution using
an ion channel, Nat. Biotechnol., 19 (2001) 248-252.
[32] L.J. Steinbock, A. Lucas, O. Otto, U.F. Keyser, Voltage-driven transport of ions and DNA
through nanocapillaries, Electrophoresis, 33 (2012) 3480-3487.
[33] R. de la Rica, H. Matsui, Applications of peptide and protein-based materials in
bionanotechnology, Chem. Soc. Rev., 39 (2010) 3499-3509.
[34] L.H. Yeh, M.K. Zhang, S.Z. Qian, J.P. Hsu, Regulating DNA translocation through
functionalized soft nanopores, Nanoscale, 4 (2012) 2685-2693.
[35] L.H. Yeh, M.K. Zhang, S.W. Joo, S. Qian, J.P. Hsu, Controlling pH-regulated
bionanoparticles translocation through nanopores with polyelectrolyte brushes, Anal. Chem.,
84 (2012) 9615-9622.
[36] C. Wei, A.J. Bard, S.W. Feldberg, Current rectification at quartz nanopipet electrodes, Anal.
Chem., 69 (1997) 4627-4633.
[37] Z. Siwy, Y. Gu, H.A. Spohr, D. Baur, A. Wolf-Reber, R. Spohr, P. Apel, Y. E. Korchev,
Rectification and voltage gating of ion currents in a nanofabricated pore, Europhys. Lett., 60
(2002) 349-355.
[38] D. Constantin, Z.S. Siwy, Poisson-Nernst-Planck model of ion current rectification through
doi:10.6342/NTU201801250 25
a nanofluidic diode, Phys. Rev. E, 76 (2007) 041202.
[39] W. Guo, H.W. Xia, F. Xia, X. Hou, L.X. Cao, L. Wang, et al., Current rectification in
temperature-responsive single nanopores, Chemphyschem, 11 (2010) 859-864.
[40] W.J. Lan, D.A. Holden, H.S. White, Pressure-dependent ion current rectification in conical-
shaped glass nanopores, J. Am. Chem. Soc., 133 (2011) 13300-13303.
[41] L.X. Cao, W. Guo, Y.G. Wang, L. Jiang, Concentration-gradient-dependent ion current
rectification in charged conical nanopores, Langmuir, 28 (2012) 2194-2199.
[42] T. Yamamoto, M. Doi, Electrochemical mechanism of ion current rectification of
polyelectrolyte gel diodes, Nat. Commun., 5 (2014) 4162.
[43] A.E.P. Schibel, E.N. Ervin, Antigen detection via the rate of ion current rectification change
of the antibody-modified glass nanopore membrane, Langmuir, 30 (2014) 11248-11256.
[44] H.J. Yao, J. Zeng, P.F. Zhai, Z.Z. Li, Y.X. Cheng, J.D. Liu, D. Mo, J.L. Duan, L.X. Wang,
Y.M. Sun, J. Liu, Large rectification effect of single graphene nanopore supported by PET
membrane, ACS Appl. Mater. Inter., 9 (2017) 11000-11008.
[45] M. Miansari, J.R. Friend, L.Y. Yeo, Enhanced ion current rectification in 2D graphene-based
nanofluidic devices, Adv. Sci., 2 (2015) 1500062.
[46] D. Woermann, Electrochemical transport properties of a cone-shaped nanopore: high and
low electrical conductivity states depending on the sign of an applied electrical potential
doi:10.6342/NTU201801250 26
difference, Phys. Chem. Chem. Phys., 5 (2003) 1853-1858.
[47] D. Woermann, Electrochemical transport properties of a cone-shaped nanopore: revisited,
Phys. Chem. Chem. Phys., 6 (2004) 3130-3132.
[48] J.Y. Jung, P. Joshi, L. Petrossian, T.J. Thornton, J.D. Posner, Electromigration current
rectification in a cylindrical nanopore due to asymmetric concentration polarization, Anal.
Chem., 81 (2009) 3128-3133.
[49] L.J. Cheng, L.J. Guo, Rectified ion transport through concentration gradient in homogeneous
silica nanochannels, Nano Lett., 7 (2007) 3165-3171.
[50] Z.S. Siwy, Ion-current rectification in nanopores and nanotubes with broken symmetry, Adv.
Funct. Mater., 16 (2006) 735-746.
[51] P. Ramirez, P.Y. Apel, J. Cervera, S. Mafe, Pore structure and function of synthetic nanopores
with fixed charges: tip shape and rectification properties, Nanotechnol., 19 (2008) 315707.
[52] H.C. Zhang, Y. Tian, J. Hou, X. Hou, G.L. Hou, R.W. Ou, et al., Bioinspired smart gate-
location-controllable single nanochannels: experiment and theoretical simulation, ACS Nano,
9 (2015) 12264-12273.
[53] C.Y. Lin, L.H. Yeh, J.P. Hsu, S. Tseng, Regulating current rectification and nanoparticle
transport through a salt gradient in bipolar nanopores, Small, 11 (2015) 4594-4602.
[54] S. Nasir, M. Ali, P. Ramirez, V. Gomez, B. Oschmann, F. Muench, M.N. Tahir, R. Zentel, S.