行政院國家科學委員會專題研究計畫 成果報告
超臨界抗溶劑沉析程序之相行為效應(2/2) 研究成果報告(完整版)
計 畫 類 別 : 個別型
計 畫 編 號 : NSC 95-2221-E-011-122-
執 行 期 間 : 95 年 08 月 01 日至 96 年 10 月 31 日 執 行 單 位 : 國立臺灣科技大學化學工程系
計 畫 主 持 人 : 林河木
計畫參與人員: 博士班研究生-兼任助理:吳弦聰、張善鈞 教授:李明哲
報 告 附 件 : 出席國際會議研究心得報告及發表論文
處 理 方 式 : 本計畫可公開查詢
中 華 民 國 97 年 01 月 31 日
本研究在兩年期間探討相行為對由超臨界抗溶劑法製備固體樣品之特性的影 響,本計畫共探討三個主題:在超臨界二氧化碳協助下 red 177 顏料微粒分散液的 製備、以超臨界抗溶劑法製備 Green 36 顏料微粒、奈米級 m-COC 高分子微粒的 研製。實驗的結果顯示超臨界流體處理階段高壓槽內混合物的相行為是影響晶析 產品之外觀與平均粒徑的關鍵因素之一。如果超臨界流體處理程序操控於超臨界 區與壓縮液體區,可製得奈米或次微米級的超微細顆粒;在過熱蒸汽區可製得微 米級的晶粒產品;在汽液兩相共存區所製得的產品,一次粒子的聚集非常嚴重,
甚至形成餅狀膜。本研究各研究主題所獲致的成果分別發表於 SCI 所收錄的期 刊,此三篇論文均彙集在本期末報告中。
關鍵字:相行為、超臨界抗溶劑程序、分散、超細微粒形成、red 177 顏料、green 36 顏料、m-COC、二氧化碳
英文摘要
Abstract:
In this two-year project, we investigated the phase behavior effects on the characteristics of particulate samples, which were produced from the supercritical anti-solvent (SAS) processes. Three major topics have been studied which include dispersiods preparation of pigment red 177 particles with the aid of supercritical carbon dioxide, ultra-fine particles preparation for pigment green 36 via supercritical anti-solvent treatment, and nanoparticle formation of metallocene catalyzed cyclic olefin copolymer (mCOC). According to our experimental results, it was found that the phase behavior of mixture in the high pressure vessel during the supercritical fluid processing is one of crucial factors to govern the morphology and the mean particles size of the particulate products taken from experimental runs. Nano-metric or sub-micron particles can be obtained as the supercritical fluid treatments were operated in supercritical phase region or compressed liquid phase region. Mirco-metric particles may be formed in the superheated vapor phase region, while serious aggregation of primary particles was found and even dense cake-like films may be generated in the vapor-liquid coexistence region. The results of each studied topic have been published in the SCI journal. These three journal papers are compiled in this final report.
Keywords: Phase behavior; supercritical anti-solvent process; dispersion; ultra-fine
particles formation; pigment red 177; pigment green 36; m-COC; carbon dioxide目 錄
中文摘要 ……….. 1
英文摘要 ……….. 2
目錄 ……….. 3
第一章 在超臨界流體協助下以超細紅色 177 微粒的分散研究 ……… 4
第二章 在不同相區以超臨界抗溶劑法製備綠色 36 顏料微粒的研究… 26
第三章 以連續式超臨界抗溶劑法製備 mCOC 奈米微粒的研究………. 45
計畫成果自評 ………... 77
可供推廣之研發成果資料表 ………... 78
第一章
在超臨界流體協助下以超細紅色 177 微粒的分散研究
<<本文發表於 Journal of Supercritical Fluids, Vol. 39, pp. 127-134 (2006)>>
Supercritical fluid-assisted dispersion of ultra-fine pigment red 177 particles with blended dispersants
Hsien-Tsung Wu, Ming-Jer Lee
*
, Ho-mu Lin Department of Chemical EngineeringNational Taiwan University of Science and Technology 43 Keelung Road, Section 4, Taipei 106-07, Taiwan
Tel.: +886-2-2737-6626; fax: +886-2-2737-6644; E-mail address:
[email protected]
(M. J. Lee)Abstract
A series of experiments was conducted to investigate the dispersion of 1 wt % of pigment red 177 particles in propylene glycol monomethyl ether acetate (PGMEA). It was found that 40 wt % of Hypermer PS3 dispersant could provide better dispersion and could stabilize the pigment particles in PGMEA at ambient condition. With the aid of supercritical carbon dioxide (CO
2
), additional 1 wt % of CO2
-philic dispersant, Zonyl FSO-100, could further enhance the dispersion. Holding the mixtures in dispersion chamber at higher temperatures and pressures for a sufficient period of time was also favorable to improve the dispersion. The size of the dispersed particles appeared to have a correlation with the phase behavior of the mixtures in the dispersion chamber. The preferable operating conditions are at 348.2 K and 20 MPa, and 20 min of holding time was long enough before rapidly releasing chamber’s pressure. Under the recommended operating conditions, the mean sizes of the dispersoids could be as small as 148 nm, which met the required range of 100 nm to 200 nm in industrial applications. The TEM images have proven that the supercritical carbon dioxide-assisted dispersion method could efficiently disperse the pigment particles in PGMEA.Pigments are the essential materials in the preparation of photo resists for fabricating color filters, which is one of key components to assembly color liquid crystal displays (color-LCD). For industrial applications, the mean sizes of pigment dispersoids are required to be in a range of 100 nm to 200 nm. Using smaller sizes of pigment particles is capable of increasing the color strength, contrast, and transmittance of color-LCD products [1-3]. Wu et al. [4] systematically studied the preparation of nanometric particles of pigment red 177 via a continuous supercritical anti-solvent (SAS) method. The study found the favorable operating conditions to produce the particles as small as 46 nm. However, it deems necessary to further disperse these ultra-fine particles in suitable liquid media for practical use.
Conventional dispersion apparatuses, such as a roll mill, a medium-dispersion machine, or a homogenizer, are often adopted to disperse fine particles into liquids, but it is a time-consuming process [5]. Alternatively supercritical fluid technique could be applied to efficient dispersion of fine particles into liquid media. Kamiwano et al. [5]
developed a supercritical dispersing method, which has been successfully utilized to disperse micrometric carbon black particles into pure water without using any dispersants. With the assistance of supercritical carbon dioxide, pure water and 2 wt % of carbon black powder were pressurized and heated stepwise from ambient condition up to 10 MPa and 333 K. The mixture was then diverted to an explosion-crashing tank.
The resulting sample was still uniformly dispersed after 100 hours and the sizes of the dispersed particles were less than 5 m. Cheng et al. [6] used a similar method to disperse the ultra-fine particles of pigment red 177, green 36 and blue 15:6 in PGMEA, respectively. In their series of experiments, the pigment concentration was as dilute as 0.002 wt % and no dispersants were applied in the dispersion process.
Among several others, those previous experimental results revealed that supercritical carbon dioxide was an excellent agent, which could quickly penetrate into the spaces of the aggregates of fine particles and then effectively disrupt the agglomerated particles via a rapid expansion. The stabilization of dispersed particles could be achieved by using some proper dispersants in the dispersing process. It is
helpful in the dispersion process, since the surfactants are possibly carried by supercritical carbon dioxide and then penetrate into the vacancies of the aggregated particles. Consani et al. [7] measured the solubility of 130 surfactants in carbon dioxide at 323 K and pressures from 10 MPa to 50 MPa. Among these investigated surfactants, fluorinated hydrocarbons were found to be highly CO
2
-philic. Such surfactants are potential candidates for the supercritical dispersion process.In the present study, a supercritical carbon dioxide-assisted dispersion process with blended dispersants was developed to produce the pigment dispersoids whose mean sizes were ranging from 100 nm to 200 nm. This size range is generally acceptable for preparing photo resists. A series of dispersion experiments was conducted to find the favorable formulations of the blended dispersants and the preferable operating conditions for dispersing 1 wt % of ultra-fine pigment red 177 particles into PGMEA. The pigment concentration of this study is higher than that of Cheng et al. [6] by about 500 folds. The supercritical carbon dioxide-assisted dispersion runs were made at temperatures from 318.2 K to 348.2 K and pressures up to 35 MPa. The mean sizes of dispersiod samples were determined with a dynamic laser scattering (DLS) particle analyzer, and the transmittances of dispersoid samples were measured with a UV/visible spectrophotometer.
2. Experimental section 2.1 Materials
Pigment red 177 (aminoanthraquinone red) was supplied by Ciba Special Chemicals Co., Hong Kong. Its molecular structure has been presented in Wu et al. [4]
Two commercially available dispersants were used in this study. One is a polyester/polyamine copolymeric dispersant, Hypermer PS3, weakly cationic, 100 % copolymer (ICI Americas Inc, USA) and the other is a CO
2
-philic dispersant, Zonyl FSO-100, F(CF2
CF2
)1-7
CH2
CH2
O(CH2
CH2
O)0-15
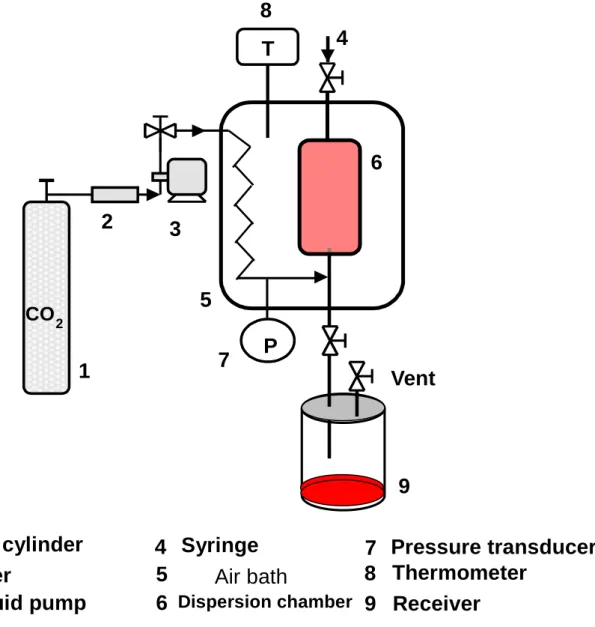
H, molecular weight about 725, nonionic, 100 % fluorosurfactant (du Pont de Nemours and Co., USA). Propylene glycol monomethyl ether acetate (PGMEA) (purity of 99.9 mass %), a suitable chemical for preparation of photo resists, was purchased from Aldrich, USA, and carbon dioxide (purity of 99.8 mass %) from Liu-Hsiang Gas Co., Taiwan. Thesemain parts: feeding, dispersion, and receiver. The feeding unit includes a carbon dioxide source (1), a filter (2), a high-pressure metering liquid pump (3) (model:
NPL-5000, Nihon Seimitsu Kagaku Co., Japan) and a disposable syringe (4) (internal volume of 20 cm
3
). The metering liquid pump was used for delivery of carbon dioxide and the syringe for injection of feeding mixtures of pigment red 177 + PGMEA + dispersants. A stainless steel high-pressure chamber (6) (P/N: CNLX1608-316, operable up to 75 MPa, Autoclave Engineering, USA) with the dimensions of 1.75 cm inside diameter, 20.32 cm length and 49 cm3
internal volume was served as the dispersion unit. The dispersion chamber was immersed in a thermostatic air bath (5).Its temperature was regulated to within 0.1 K. The bath temperature was measured with a precision platinum RTD sensor (8) (model: 1560, Hart Scientific Co., USA) to an accuracy of 0.02 K. A pressure transducer (7) (model: PDCR 4070, ranging 0-35 MPa, Druck, UK) with a digital display (model: DPI-280, Druck, UK) monitored the operating pressure of the dispersion vessel, accurate to 0.1 %. A sample cylinder with an internal volume of 1000 cm
3
(Swagelok, USA) was utilized as a receiver (9), which was connected to the bottom of the dispersion chamber for collecting the rapidly expanded dispersoid at atmospheric pressure.The experimental procedure is described as follows. A feeding mixture containing pigment red 177, PGMEA and the dispersants was prepared with an electronic balance. The concentration of pigment in the feeding mixture was kept at 1 wt % through all the runs of this study. The mixture was vigorously mixed with ultrasonic wave (Branson 5510 ultrasonic wave at 40 KHz, USA) for about 2 hours before loading to the dispersion chamber. At the beginning of dispersion process, about 15 cm
3
of well-mixed feeding mixture was injected into the dispersion vessel via the syringe, and carbon dioxide was then charged into the dispersion chamber by the liquid pump, under a given flow rate, until the vessel reaches to a pre-specified pressure. The dispersion chamber was maintained at constant temperature and pressure for a period of time, denoted as a holding time. After that, the chamber was depressurized rapidly, and the dispersoid expanded simultaneously into the receiver at atmospheric pressure.were calibrated with two standard samples (Latex Microsphere Suspensions 5016A, mean diameter = 160 nm and Nanosphere™ Size Standard3200A, 200 nm, mean diameter = 1996 nm, Duke Scientific Co., USA). All dispersion runs were repeated twice at each experimental condition. The mean sizes of the replicated samples could be reproduced to within about 5 %. Three representative samples were also analyzed with a Transmission Electron Microscopy (TEM, Hitachi H-7100, Japan) by depositing the dispersoids on 400 mesh carbon-coated copper grids. The transmittances of four diluted dispersoid samples were measured with a UV/visible spectrophotometer (JASCO V-530, Japan).
A volume-variable phase equilibrium analyzer has been installed to investigate the phase boundary of mixtures containing carbon dioxide + dimethyl sulfoxide (DMSO) with or without pigment blue 15:6 [8]. This apparatus was also employed in this study to measure the bubble and the dew points of carbon dioxide + PGMEA from which the critical points at the operating temperatures of dispersion process were estimated. The relationship between the dispersion of pigment particles and the phase behavior of mixtures in dispersion chamber will be discussed later. The volume-variable cell consists of a high-pressure generator (Model 62-6-10, High Pressure Equipment Co., USA), a sapphire window (Part No.: 742.0106, Bridgman closure, SITEC, Switzerland), a rupture disk and a circulation jacket. The internal volume of the cell is adjustable manually with a piston screw pump and the cell is operable up to 50 MPa and 473.2 K. The cell’s temperature was maintained by circulated thermostatic water to within
0.1 K. A pressure transducer (PDCR 407-01, Druck, UK) with a digital indicator (DPI 280, Druck, UK) displayed the cell’s pressure to within an accuracy of
0.04 %. Two precision syringe pumps (Model: 260D, Isco Inc., USA) were utilized to charge carbon dioxide and PGMEA, respectively, under constant-pressure mode. A magnetic stir bar was placed inside the cell to enhance the mixing of the loaded mixture. The weight of each loaded substance was calculated from the known charged volume (accurate to
0.01 cm3
) and the density value at the delivery pressure and temperature. While the densities of carbon dioxide were taken from the NIST Chemistry WebBook [9], the densities of PGMEA were determined
0.0001 g/cm . The uncertainty of the composition of the prepared mixtures was estimated to be
0.003 in mole fraction. The phase behavior of the loaded sample in the cell was observed via a digital camera (Model: DSC-F88/S, Sony, Japan) and a television (Model: PV-C2062, Panasonic, Japan). The bubble point or dew point of the loaded mixture can be determined visually by manipulating manually the position of piston screw pump. The uncertainty of the observed phase transition pressures at a given temperature is about
0.05 MPa.3. Results and discussion
The objective of this study is to find favorable formulations and operating conditions of the supercritical fluid-assisted dispersion process to produce the dispersoids whose mean sizes meet the required range of 100 nm to 200 nm in LCD industrial applications. The investigated operating variables of the dispersion process include pressurization rate, the holding time of pigment mixtures at elevated pressures in the dispersion chamber, the temperature and pressure during the holding stage.
3.1 Dispersion with Hypermer PS3 at ambient condition
Preliminary tests were conducted without supercritical carbon dioxide treatment to explore the favorable composition of dispersion agents for stabilizing pigment red 177 particles in PGMEA at ambient condition. The tested samples were prepared by adding different weight percents of dispersion agents, on the PGMEA-free basis, in the mixtures of pigment + PGMEA. The mean size of each sample, denoted as an initial mean size, was measured after well mixing with ultrasonic wave for 2 hours. The evolution of the mean sizes of the dispersoid samples was observed every other day.
Fig. 2 shows the histogram of the preliminary tests with or without using Hypermer PS3 dispersant up to seven days after preparation. The sample without the presence of dispersant (denoted as a blank case, shown as a symbol of solid circle in Fig. 2) exhibited the smallest initial mean size, 260 nm, but its size drastically increased up to a micrometric scale on the third day. It was suggested that ultrasonic mixing could temporarily break the original agglomerated pigment particles in PGMEA. However, the particles re-aggregated quickly due to the absence of any dispersants to stabilize the distributed particles in PGMEA. As also seen from the graph, the initial mean sizes
dispersion agent. The mean sizes grew much slower in the presence of dispersant, especially for the samples containing Hypermer PS3 greater than 10 wt %. Their sizes are substantially smaller than that of the blank case on the third day, implying that the dispersant effectively provided steric barrier to keep the dispersed particles from re-agglomeration. The mechanism of steric stabilization of the hydrocarbon-based dispersant suggested that the pigment-affinity groups (segments of the polyamines) absorbed onto the pigment particles’surface and the solvent-soluble chains (segments of the polyesters) stretching into the PGMEA liquid phase, and to establish a sufficient thickness to stabilize the dispersed pigment particles [3, 10]. Under lower concentrations of Hypermer PS3 (e.g., less than 10 wt %) the dispersant may not form enough thickness to prevent the particles from re-agglomeration, whereas high concentrations of Hypermer PS3 (e.g., equal to or greater than 60 wt %) may result in inevitable flocculation [2]. The experimental results disclosed that using 40 wt % of Hypermer PS3 (0.4 g Hypermer PS3 to 1 g pigment, on the PGMEA-free basis) yielded better dispersion. The mean size increased from about 300 nm to 390 nm after one day of preparation and maintained about the same size up to the 7
th
day.3.2 Dispersion with addition of Zonyl FSO-100 and supercritical carbon dioxide
A CO2
-philic dispersant Zonyl FSO-100 was tested in this study. It was found that the initial mean sizes increased monotonically from 335 nm to 750 nm while the concentrations of Zonyl FSO-100 increased from 3 wt % to 40 wt %. High concentrations of Zonyl FSO-100 appeared unfavorable to reduce the size of dispersed particles. Fig. 3 illustrates the results of the samples containing 10 wt % to 60 wt % of Hypermer PS3 and addition of Zonyl FSO-100 up to 3 wt % (0.03 g dispersant to 1 g pigment). It also shows that the presence of Zonyl FSO-100 did not significantly affect the mean sizes of the dispersoid samples as the dispersion process was achieved only by ultrasonic mixing at ambient condition. However, there are certain benefits by the addition of this CO2
-philic fluorosurfactant, Zonyl FSO-100, when the dispersion was operated with the aid of supercritical carbon dioxide [7, 11].More dispersion experiments were thus implemented with the treatment of supercritical carbon dioxide. Before the dispersoids were rapidly released from the
nm for the sample containing 40 wt % of Hypermer PS3 after supercritical carbon dioxide-assisted dispersion (run #1), whereas the size was about 298 nm without supercritical carbon dioxide treatment. It was evident that the supercritical fluid could assist the dispersion of the pigment particles due to, at least partly, the rapid expansion of carbon dioxide from the spaces of the aggregated pigment particles during the process of pressure release. As also seen from runs #2 and #3 in Table 1, the higher concentrations of Zonyl FSO-100 resulted in the larger mean sizes of the dispersed particles with using a single dispersant. The mean size, however, could be reduce effectively by applying the dispersant blends of Hypermer PS3 and Zonyl FSO-100 as shown in runs #4 and #5. In the case of run #4, the mean size decreased down to 201 nm with 40 wt % of Hypermer PS3 and addition of 1 wt % of Zonyl FSO-100. The improvement of particles dispersion is attributable to the fact that supercritical carbon dioxide may carry the CO
2
-philic Zonyl FSO-100 and penetrate into the inter-particles’vacancies. During the course of rapid release of the applied CO
2
pressure, the expansion of fluid disrupts the aggregated particles, and the dispersed particles are then isolated, mainly, by Hypermer PS3.The dispersant blend of 40 wt % of Hypermer PS3 and 1 wt % of Zonyl FSO-100 was used throughout all the following supercritical carbon dioxide-assisted dispersion experiments to find suitable operating conditions for preparing the dispersoids whose sizes are within the acceptable range of 100 nm to 200 nm in industrial applications.
3.3 Effects of pressurization rate and holding time
Table 2 lists the results of dispersion experiments (run #6 to run #13) operated at different pressurization rates (i.e., the volumetric charging rates of carbon dioxide at the conditions of 278 K and 6 MPa, F
CO2
,) and holding times. All the feeding pigment mixtures have the same composition, the mass ratio of pigment : Hypermer PS3 : Zonyl FSO-100 : PGMEA = 1 g : 0.4 g : 0.01 g : 98.59 g, and all these runs were maintained at 338.2 K and 30 MPa during the holding stage. Fig. 4 presents the mean size varying with the charging rate of carbon dioxide, indicating that the dispersion is only slightly affected by the pressurization rate as the feed rates of carbon dioxide areimprove the dispersion of the pigment particles in PGMEA. However, no obvious influence was found when the holding times were longer than 20 min. It was suggested that the penetration process of carbon dioxide with the dispersants into the spaces of agglomerated pigment particles was almost completed at about 20 min.
3.4 Effects of holding temperature and pressure
Table 3 reports the mean sizes of dispersoid samples prepared at different holding temperatures and pressures (run #14 to run #32). Throughout these 19 runs, the loaded pigment mixtures have same composition as mentioned in the above section, and the charging rate of carbon dioxide and the holding time were 2.0 cm
3
/min at 278 K/6 MPa and 20 min, respectively. Fig. 6 illustrates the effects of holding pressure and temperature on the mean sizes of dispersed samples. Higher holding temperatures are favorable to enhance dispersion. The temperature-effect, however, becomes minor as temperatures higher than 338.2 K, especially at elevated pressures. At a fixed temperature the mean size decreases with increasing pressure, but the effect sharply leveled-off as pressures exceeded about 10 MPa. As shown in Table 3, the mean size of dispersoid could be as small as 145 nm as the dispersion chamber was maintained at 348.2 K and 35 MPa during the holding stage (run #32). While the dispersion processes were operated at 338.2 K - 348.2 K and 20 MPa during the holding stage, the mean sizes of the resulting dispersoids were within a range of 148 nm to 160 nm, which satisfies the requirement (100 nm to 200 nm) for industrial applications.3.5 Effects of phase behavior
The influences of temperature and pressure on the particles’dispersion may be in accordance with the phase behavior of the mixtures in the dispersion chamber. To find this correlation, the vapor-liquid equilibrium (VLE) phase boundaries of carbon dioxide + PGMEA were measured with the volume-variable phase equilibrium analyzer. Since the concentrations of pigment and dispersants were very dilute in the dispersion mixtures during the holding stage (e.g., the mass ratio of pigment : dispersants : PGMEA: carbon dioxide was about 1 g : 0.41 g : 98.59 g : 218 g), the phase boundaries of the mixtures in the dispersion chamber could be approximately represented by those of carbon dioxide + PGMEA, similar to the observations of Wu et
region where the mole fractions of carbon dioxide are substantially high, e.g., greater than about 0.95 at 348.2 K. The critical pressure and the critical composition at each temperature were estimated from the smoothed isothermal phase boundary around the critical point as shown in Fig. 7. The determined critical locus was also mapped on Fig.
6. This critical locus divides the graph into two zones: subcritical region (left-hand side) and supercritical region (right-hand side). The mixtures of carbon dioxide + PGMEA formed a homogeneous phase in the supercritical region regardless of their compositions. In the subcritical region, the mixtures may exist as a compressed liquid, vapor-liquid coexistence, or a superheated vapor, depending on the composition range.
Because the mole fractions of carbon dioxide in the dispersion mixtures during the holding stage were well below 0.95, most of the subcritical cases were in the vapor-liquid coexistence region during the holding stage. As discussed in Section 3.4 the pressure-dependences of the mean size of dispersoids were obviously different at lower and higher pressures, whose boundary appeared coincidentally at the critical locus as shown in Fig. 6. As a consequence, the phase behavior could be a crucial factor to govern the pigment particles dispersion. It suggests that the existence of liquid phase during the holding stage is unfavorable to the dispersion. From the economical point of view, the favorable dispersion process should be operated in the supercritical region during the holding stage, but not too far beyond the critical region.
3.6 The performance of dispersoids
The performances of four representative samples were analyzed with a UV-visible spectrophotometer. These tested samples were prepared under the following dispersion conditions, respectively:
(case 1) The mass ratio of pigment red 177 to PGMEA = 1 g to 99 g, without any dispersants; dispersed with ultrasonic mixing; at ambient condition; after one day of preparation; mean size = 530 nm.
(case 2) The mass ratio of pigment red 177 : Hypermer PS3 : Zonyl FSO-100 :
PGMEA = 1 g : 0.4 g : 0.01 g: 98.59 g (i.e., 40 wt % of Hypermer PS3 and 1 wt % of Zonyl FSO-100); dispersed with ultrasonic mixing; at ambient
carbon dioxide; holding at 318.2 K and 5.0 MPa (at subcritical conditions) for 20 min; mean size = 332 nm (i.e., run #14)
(case 4) With 40 wt % of Hypermer PS3 and 1 wt % of Zonyl FSO-100; treated with carbon dioxide; holding at 348.2 K and 35.0 MPa (at supercritical conditions) for 20 min; mean size = 145 nm (i.e., run #32)
Each sample was diluted with PGMEA by 500 times before the analysis. Fig. 8 shows that the transmittances are 87.6 %, 91.3 %, 92.0 % and 95.8 % at the wavelength of 620 nm for the samples obtained from case (1) to case (4), respectively. It again illustrates the smaller sizes of dispersed pigment particles resulting in the higher transmittances.
Figs. 9(a) to 9(c) are the TEM images of dispersoid samples taken from cases (1), (2) and (4), respectively. Serious aggregation of pigment particles is shown in Fig. 9(a), in the case of no dispersants and without treatment of supercritical carbon dioxide. Fig.
9(b) indicates that better dispersion was obtained by adding appropriate amounts of dispersants with ultrasonic mixing at ambient condition. As evidenced from Fig. 9(c), the supercritical carbon dioxide-assisted method can effectively improve the dispersion of pigment red 177 particles in PGMEA, and the mean size of the produced dispersoid meets the requirement (between 100 nm and 200 nm) for industrial applications. Fig.
10 presents the evolution of the mean sizes of samples obtained from the experiments, whose initial mean sizes were smaller than 200 nm. As shown from the graph, higher holding temperatures and pressures are favorable to stabilization of the dispersed particles. The mean sizes of dispersoids prepared from run #27, run #29 - run #32 can be maintained to be smaller than 200 nm until about 16 to 18 hours after the preparation. Within this time period, the sizes of the dispersoids are acceptable for industrial applications.
4. Conclusions
A series of experiments has been conducted in a high-pressure dispersion apparatus to investigate the dispersion of 1 wt % of pigment red 177 particles in PGMEA with the aid of supercritical carbon dioxide. It was found that 40 wt % of Hypermer PS3 and 1 wt % of Zonyl PSO-100 could be a favorable formulation of
suitable holding time is about 20 min. Higher holding temperatures and pressures are also favorable to yield smaller mean sizes of dispersoids. The preferable condition was found to be 348.2 K and 20 MPa. Under this operating condition, the mean size of the dispersoid can be as small as 148 nm. Within 16 hours after preparation, the mean size of the dispersed particles can be maintained to be smaller than 200 nm, which is satisfactory for industrial applications.
Acknowledgement
The authors gratefully acknowledged the financial support from the National Science Council, Taiwan, through grant No. NSC94-2214-E011-009. The authors also thank Dr. J.T. Chen, Department of Chemical Engineering, Ming-Hsin University of Science and Technology, for valuable discussions. Thanks also to Mr. H.Y. Chiu for phase boundaries measurements and Dr. K.T. Lee, Department of Chemical Engineering, Mingchi University of Science and Technology, for kindly providing the DLS particle analyzer.
References
[1] W. Herbst, K. Hunger, Industrial Organic Pigments: Production, Properties, Applications, VCH, New York, 1993.
[2] T.C. Patton, Paint Flow and Pigment Dispersion, Wiley, New York, 1979.
[3] G.D. Parfitt, Dispersion of Powders in Liquids, with Special Reference to Pigments, Applied Science Publishers, London, 1981.
[4] H.T. Wu, M.J. Lee, H.M. Lin, Nano-particles formation for pigment red 177 via a continuous supercritical anti-solvent process, J. Supercrit. Fluids 33 (2005) 173-182.
[5] M. Kamiwano, K. Nishi, Y. Inoue, U.S. Patent 5,921,478, 1999.
[6] W.T. Cheng, C.W. Hsu, Y.W. Chih, Dispersion of organic pigments using supercritical carbon dioxide, J. Colloid Interf. Sci. 270 (2004) 106-112.
[7] K.A. Consani, R.D. Smith, Observations on the solubility of surfactants and related molecules in carbon dioxide at 50℃, J. Supercrit. Fluids 3 (1990) 51-65.
press).
[9] Isothermal properties for carbon dioxide, NIST Chemistry WebBook, NIST Standard Reference Database No. 69, March, 2003, Release, National Institute of Standard and Technology, USA (http://webbook.nist.gov/chemistry/).
[10] D.H. Everett, Basic Principles of Colloid Science, The Royal Society of Chemistry, Cambridge, 1988.
[11] K. Harrison, J. Goveas, K.P. Johnston, Water-in-carbon dioxide microemulsions with a fluorocarbon-hydrocarbon hybrid surfactant, Langmuir 10 (1994)
3536-3541.
combinations of dispersants
ambient a with CO 2 b
Hypermer PS3 Zonyl FSO-100
mean size mean size
size’ s reduction with CO 2
run (g/g pigment) (g/g pigment) (nm) (nm) (nm)
1 0.4 (40 %) 0 (0 %) 298 250 -48
2 0 (0 %) 0.40 (40 %) 750 545 -205
3 0 (0 %) 0.03 (3 %) 335 265 -70
4 0.4 (40 %) 0.01 (1 %) 360 201 -159
5 0.4 (40 %) 0.03 (3 %) 363 210 -153
a The samples were prepared with ultrasonic mixing at ambient conditio n.
b The samples were prepared with the aid of supercritical carbon dioxide; the charging rate of carbon dioxide was 2.0 cm 3 /min at 278 K and 6 MPa, and holding time was 20 min. The holding temperature and pressure were at 328.2 K and 20 MPa,
respectively.
Figure Captions
Fig. 1 Schematic diagram of dispersion apparatus.
Fig. 2 Histogram of mean particle sizes variation for the dispersed samples prepared from the operations using different amounts of Hypermer PS3 dispersant at ambient condition.
Fig. 3 Histogram of mean particle sizes variation for the dispersed samples prepared from the operations using various blended dispersants at ambient condition.
Fig. 4 The effect of charging rate of carbon dioxide on the mean size of the dispersoids prepared at 338.2 K, 30 MPa, and 20 min of holding time.
Fig. 5 The effect of holding time on the mean size of the dispersoids prepared at 338.2 K, 30 MPa, and 2.0 cm
3
/min of carbon dioxide charging rate.Fig. 6 The effects of pressure and temperature on mean size of dispersoids prepared with the aid of supercritical carbon dioxide. The charging rate of carbon dioxide and the holding time were 2.0 cm
3
/min and 20 min, respectively.Fig. 7 Vapor-liquid phase diagram of carbon dioxide + PGMEA around critical regions.
Fig. 8 UV-visible spectra from four representative samples.
Fig. 9 TEM images from three tested samples; (a) case 1, (b) case 2, (c) case 4.
Fig. 10 Histogram of mean particle sizes variation for the dispersed samples taken from runs #7, #26, #27, and #29 to #32.
Fig. 1
1 CO 2 cylinder 2 Filter
3 Liquid pump
4 5
Syringe 6
Air bath
7 Pressure transducer 8 Thermometer
9 Receiver CO 2
1
2 3
5 7 P
T
Vent
9 6 4
Dispersion chamber
0 2 4 6 8
Time (day)
200 400 600 800 1000 1200 1400
M e a n s iz e (n m )
0 % PS3 10 % PS3 20 % PS3 40 % PS3 60 % PS3
Fig. 2
Fig. 3
0 2 4 6 8
Time (day)
200 400 600 800 1000
M e a n s iz e (n m )
10 % PS3 & 1 % FSO
10 % PS3 & 3 % FSO
40 % PS3 & 0 % FSO
40 % PS3 & 1 % FSO
40 % PS3 & 3 % FSO
60 % PS3 & 1 % FSO
60 % PS3 & 3 % FSO
0 1 2 3 4 5 6 7
FCO 2 (cm 3 /min)
100 150
M e a n s iz e (n m )
Fig. 4
0 10 20 30 40 50 60 70
Holding time (min)
100 150 200 250 300
M e a n s iz e (n m )
Fig. 5
0 10 20 30 40
P (MPa)
100 200 300 400
M e a n s iz e (n m )
318.2 K 328.2 K 338.2 K 348.2 K critical locus
Fig. 6
0.8 0.84 0.88 0.92 0.96 1
x CO2 , y CO2
6 8 10 12 14
P (M P a )
318.2 K 328.2 K 338.2 K 348.2 K 358.2 K critical point critical locus
Fig. 7
400 500 600 700
Wavelength (nm)
20 40 60 80
T ra n s m it ta n c e (% )
case 1, 530 nm case 2, 360 nm case 3, 332 nm case 4, 145 nm
Fig. 8
(a)
(b)
Fig. 9
(c)
Fig. 9
0 12 24 36 48 60 72 84 96 108
Time (hr)
120 160 200 240 280 320
M e a n s iz e (n m )
run #7 run #26 run #27 run #29 run #30 run #31 run #32
Fig. 10
第二章
在不同相區以超臨界抗溶劑法製備綠色 36 顏料微粒的研究
<<本文發表於 Dyes and Pigments, Vol. 75, pp. 328-334 (2007))>>
Ultra-fine particles formation of pigment green 36 in different phase regions via a supercritical
anti-solvent process
Hsien-Tsung Wu, Ho-mu Lin, Ming-Jer Lee
*
Department of Chemical Engineering
National Taiwan University of Science and Technology 43 Keelung Road, Section 4, Taipei 106-07, Taiwan
Tel.: +886-2-2737-6626; fax: +886-2-2737-6644. E-mail address:
[email protected]
(M. J. Lee)Abstract
Ultra-fine particles of pigment green 36 were prepared with a continuous supercritical anti-solvent (SAS) apparatus by using quinoline as a solvent and supercritical carbon dioxide as an anti-solvent. A series of precipitation experiments was conducted at different temperatures, pressures, and the flow rates of the pigment solution. The vapor-liquid phase boundaries of carbon dioxide + quinoline mixtures were also measured with a volume-variable phase equilibrium analyzer at temperatures from 308.2 K to 328.2 K. Mapping the estimated compositions of mixtures in a model CSTR (continuously stirred tank reactor) precipitator at the end of pigment solution injection onto the phase diagram found that the morphology of prepared particles was mainly governed by the phase behavior of anti-solvent + solvent mixtures.
Nano-particles were obtained as the precipitation loci were manipulated within either supercritical or superheated vapor region through the SAS process, whereas micro-metric aggregated ball-like particles were produced as the precipitation loci passed by the vapor-liquid coexistence region.
Nano-metric or submicron pigment particles are essential materials to prepare photo resists, which are used for fabricating color filters and then for color liquid crystal display (color-LCD). The smaller sizes of pigment particles in the dispersion media yield the better color strength, contrast, and transmittance [1]. Therefore, searching for feasible methods and favorable process parameters to produce nano-metric pigment particles with narrow particle size distribution (PSD) is technically important for the industrial applications. Instead of traditional mechanical milling, supercritical anti-solvent (SAS) method may provide an innovative route to meet this demand [1, 2, 3]. Previous studies on pigment particle formation using supercritical techniques are rather limited. Gao et al. [4] prepared micro-metric particles of pigment red lake C, yellow 1, and blue 15 by using an SAS method.
Micro-metric pigment particles of bronze red were produced by Hong et al. [5] with a continuous SAS apparatus. Wu et al. [1, 6] extensively investigated the effects of the SAS process parameters on the PSD of pigment red 177 and pigment blue 15:6.
Nano-metric or submicron particles were obtained from these studies. The precipitation kinetic parameters of pigment blue 15:6 were determined with the aid of the population balance theory [6]. Reverchon et al. [7] investigated micronization of disperse red 60 with both the SAS and the supercritical assisted atomization (SAA) methods. They found that nano-metric particles could be formed using the SAS, whereas micro-metric particles were produced using the SAA. Wu et al. [8] developed a supercritical-assisted dispersion apparatus to disperse pigment red 177 in propylene glycol monomethyl ether acetate with blended dispersants.
In addition to Wubbolts et al. [9] and Wu et al. [1, 6], Reverchon et al. [10] found that the phase behavior of mixtures in precipitator, rather than the mass transfer, governed the SAS precipitation. As shown from their experimental results, submicron particles were produced when the mixtures of solvent + anti-solvent + solute in the precipitator were manipulated at supercritical homogeneous states during the particle formation stage. Micro-metric powders, however, were obtained as the precipitation was conducted in the vapor-liquid coexistence region. The vapor-liquid equilibrium
Pigment green 36 is one of coloring materials widely used in preparing photo resists. Nano-particles of this pigment were produced, in the present study, with a continuous SAS apparatus using quinoline as a solvent and supercritical carbon dioxide as an anti-solvent. The experiments were conducted at various flow rates of pigment solutions over temperatures ranging from 308.2 K to 328.2 K and pressures up to 31 MPa. The collected particles samples were analyzed with a field emission scanning electron microscope (FESEM), and the PSD and the mean sizes of particles were then determined with an image processing software. Since the phase behavior played an important role in the SAS precipitation, the vapor-liquid phase boundaries (bubble and dew points), including near critical region, were also measured in this study with the volume-variable phase equilibrium analyzer for carbon dioxide + quinoline at 308.2 K, 318.2 K, and 328.2 K over a wide range of pressures. The composition variations of fluid mixtures in the precipitator during the courses of injection and purge stages were estimated from a simple continuously stirred tank reactor (CSTR) model, and the calculated precipitation loci were mapped onto the phase diagram of carbon dioxide + quinoline to examine the influence of the phase behavior on the resultant pigment particles.
2. Experimental section
2.1. Materials
Pigment green 36 (Cu-phthalocyanine, halogenated) was supplied by Ciba Special Chemicals Co., Hong Kong. Its chemical structure is shown in Fig. 1. The particle sizes of the pigment as received distribute in the range of 1 m to 20 m.
Quinoline (purity of 99.9 %, spectrophotometric grade) was purchased from Aldrich (USA) and carbon dioxide (purity of 99.8 %) from Liu-Hsiang Gas Co., Taiwan. These chemicals were used without further purification.
2.2. Apparatus and operation
A volume-variable phase equilibrium analyzer was utilized to investigate the phase boundary (bubble and dew points) of the binary mixtures of carbon dioxide + quinoline. The apparatus and the experimental procedure have been detailed elsewhere [1]. The uncertainties of measurements are
0.1 K,
0.05 MPa, and
0.003 forprocedure of the experiment have also been reported in Wu et al. [1]. An HPLC pump was used for delivery of pigment solution and another high-pressure liquid pump for carbon dioxide. These two pressurized streams were pre-heated in a thermostatic air bath, and then diverted into the precipitator, from the top, through a coaxial injection tube. The coaxial injector was consist of a 0.3175 cm (outside diameter) stainless steel tube with an insert of PEEK capillary tube (63 m, inside diameter). The pigment solution injected into the precipitator via the capillary tube and carbon dioxide was delivered via the stainless steel tube (outside the capillary tube). The precipitation chamber was made of stainless steel with an internal volume of 49 cm
3
. A metal frit was mounted at the outlet (bottom) of the precipitator to retain the produced pigment particles. Four glass-plates were placed in the precipitator at different positions to collect the particulate samples. The pre-heaters, the coaxial injector, and the precipitator were placed in the thermostatic air bath, which was controlled to within
0.1 K. The bath temperature was measured by a precision platinum RTD sensor to an uncertainty of 0.02 K. A pressure transducer with a digital indicator measured the operating pressure in the precipitator, accurate to
0.1 %. A separator followed the precipitator to separate solvent and anti-solvent at near atmospheric pressure. The flow rate and the total volume of carbon dioxide passing through the precipitator were determined with a wet test meter to an uncertainty of
0.25 %. The mass flow rate of carbon dioxide was manipulated at about 0.03 g/s through the precipitation stage in each run. The total volume of the injected pigment solutions was about 8 cm3
. After the precipitation stage, carbon dioxide was kept continuously charging into the precipitator for about 150 min in order to remove the residual solvent in the chamber.At least 300 particles on an FESEM image were counted for determining the PSD and the mean particle size by using the software of the Sigma Scan Pro5. All precipitation runs were conducted twice at each experimental condition. The mean particle size of the replicated samples was reproducible to within about
3 nm.3. Results and Discussion
3.1. Vapor-liquid equilibrium phase diagram of anti-solvent + solvent system
the extremely minute solubility of pigment green 36 in supercritical carbon dioxide, the phase behavior of the mixtures in the precipitator should be very similar to that of the mixtures without containing the pigment, i.e., the binary mixtures of carbon dioxide + quinoline [6]. The vapor-liquid phase boundaries (including dew points and bubble points) of the binary system of carbon dioxide + quinoline were thus measured with the volume-variable phase equilibrium analyzer over a temperature range of 308.2 K to 328.2 K and up to critical pressures. Fig. 2 illustrates the experimental results in which x
CO2
stands for the mole fraction of carbon dioxide. This phase diagram is divided into four phase regions, including vapor-liquid coexistence (V-L), compressed liquid (L), superheated vapor (V), and supercritical (SC) regions. The critical pressure and composition at each temperature were estimated from the maximum point of the smoothed isothermal phase boundary near the critical region. The estimated critical points are located at 308.2 K/23.9 MPa/xCO2
= 0.843, 318.2 K/25.3 MPa/xCO2
= 0.842, and 328.2 K/26.9 MPa/xCO2
= 0.842, respectively.3.2. Influence of phase behavior on morphology of resultant particles
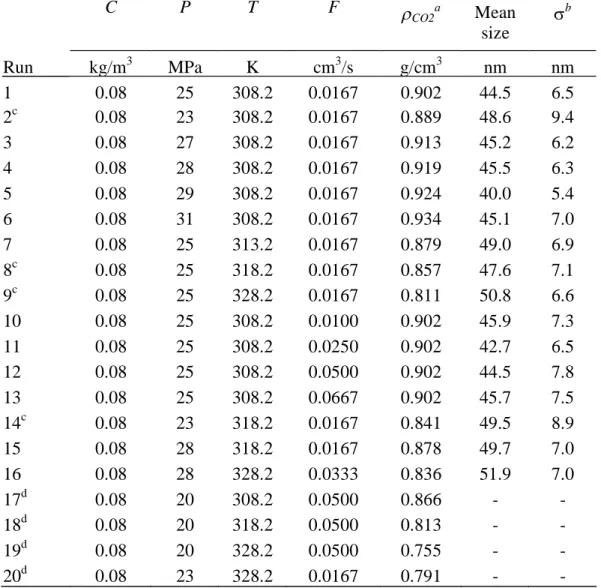
The precipitation experiments were conducted at different volumetric flow rates of pigment solution (F, from 0.0100 cm
3
/s to 0.0667 cm3
/s), precipitation temperatures (T, from 308.2 K to 328.2 K), and precipitation pressures (P, from 20 MPa to 31 MPa), but the concentration of the injected pigment solution was fixed at 0.08 kg/m3
through all the experimental runs due to the low solubility of pigment green 36 in quinoline.The experimental conditions and the results are reported in Table 1, where the densities of carbon dioxide at precipitation temperature and pressure were taken from the NIST Chemistry WebBook [11].
The composition variations of fluid mixtures in the precipitation chamber during the SAS process were calculated, in this study, from unsteady-state material balance equations around the precipitator. The estimated results can be mapped onto the phase diagram of carbon dioxide + quinoline to identify the phase regions being passed during the SAS procedure. Similar to the work of Schmitt et al. [12], the precipitator was assumed as a continuously stirred tank reactor (CSTR) with two inlet and one outlet streams. With the initial condition of pure carbon dioxide (z
CO2
= 1.0, where zCO2
[12].
sys
f S CO S
CO S S
CO CO
CO M
t F x exp M
F x M
F x F
x M
z M
2 2
2 2
2
(1)where M
CO2
(g/s) is the mass flow rate of the inlet carbon dioxide, xS
is the mass fraction of solvent (quinoline) in the injected pigment solution (xS
≒1.0), is the density of pigment solution (about 1.090 g/cm3
), F (cm3
/s) is the volumetric flow rate of the injected pigment solution, andM sys f
(g) is the total mass of fluid phase in the precipitator which was assumed to be remained a constant with time and was approximated by the mass of pure carbon dioxide in the whole precipitator at the beginning of injection of pigment solution.Upon ending injection (at t = t
o
), a purge (or drying) operation was followed by continuously charging the pure carbon dioxide into the precipitator. The variation of the mass fraction of carbon dioxide (z’CO2
) during this purge stage was also derived by Schmitt et al. [12] as follows.
sys
f
o o CO
CO
CO M
t t exp M
z '
z 2 1 2 1 2
(2)where z
o CO2
is the mass fraction of carbon dioxide at the end of injection (t = to
). The detailed derivation for eqs (1) and (2) has been given by Schmitt et al. [12]. The mass fraction zCO2
can be readily converted into mole fraction xCO2
by 2
44 01 2
144 012
129 2622 z / . z / .
. / x z
CO CO
CO
CO
(3)Fig. 3 is an illustrative example of the calculated mole fraction of carbon dioxide
x CO2
in the precipitator varying with time, including injection and purge stages. The horizontal lines on the graph represent the vapor-liquid phase boundaries, i.e., the composition of the dew point at the corresponding precipitation conditions. The mole fraction of carbon dioxide decreases from unity to a minimum value (xo CO2
) at the end of pigment solution injection. After that, x’CO2
increases with an increase of time and approaches to unity when the residual solvent in the precipitator was totally removed.horizontal dashed line twice. It means that the fluid mixtures in the precipitator passed by the vapor-liquid coexistence region during the SAS process. While the mixing in precipitator was non-ideal, the actual minimum concentration of carbon dioxide x
o CO2
should be lower than the value calculated from eq (1).
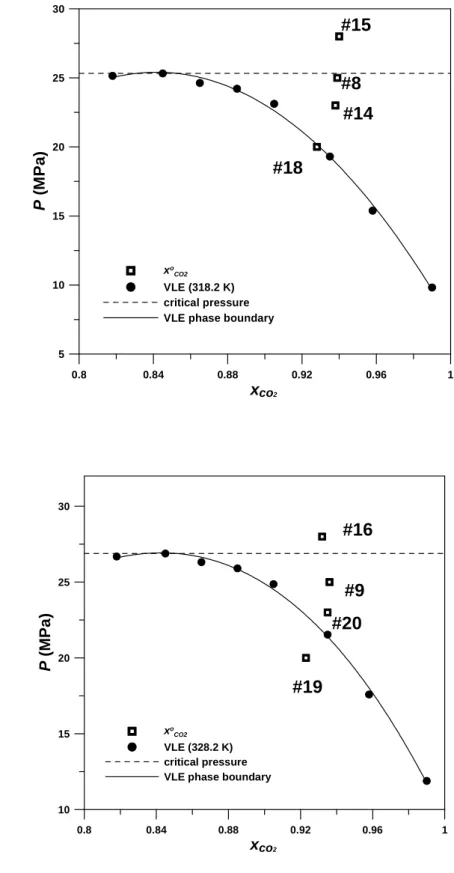
The estimated minimum concentrations of carbon dioxide x
o CO2
, at the end of pigment solution injection, were marked on Figs. 4, 5, and 6 for the experiments conducted at 308.2 K, 318.2 K and 328.2 K, respectively. The horizontal dashed line stands for the critical pressure at the precipitation temperature and the solid curve for the vapor-liquid phase boundary. The particles formation occurred in the supercritical region, if the points are above the horizontal dashed line, such as runs #1, #3 to #6, #10 to #13 (in Fig. 4), run #15 (in Fig. 5), and run #16 (in Fig. 6). The precipitation and purge stages were operated in the superheated vapor regions, if the points are located under the horizontal dashed line but well behind the right hand side of the vapor-liquid phase boundaries, such as run #2 (in Fig. 4), runs #8 and #14 (in Fig. 5), and run #9 (in Fig. 6). In the case of the points located on the left hand side or near the phase boundaries, such as run #17 (in Fig. 4), run #18 (in Fig. 5), and runs #19 and #20 (in Fig. 6), the SAS procedure was likely to crossing the vapor-liquid coexistence region.Although the estimated minimum compositions of carbon dioxide of runs #17 and #20 are located in the superheated vapor region, actually these runs should pass by the two-phase coexistence region at the end of pigment solution injection because the recovered quinoline from the separator was found to turn into greenish. As noted earlier, this discrepancy may be attributed to the non-ideal mixing in the precipitator.
Fig. 7 shows the FESEM images of the samples prepared in the vapor-liquid coexistence region (run #18, Fig. 7(a)), in the supercritical region (run #10, Fig. 7(b)), and in superheated vapor region (run #14, Fig. 7(c)), respectively. Fig. 8 is the corresponding enlarged FESEM images. As seen from the images, the shape of the resultant primary particles of pigment green 36 is near sphere. The images also illustrate that micron-metric aggregated ball-like particles were formed when the SAS process passed by the vapor-liquid coexistence region. Nano-metric and less aggregated pigment particles were produced when the SAS process was operated in
cases the particles formed in “dry”environments.
3.3. Influences of process parameters on particle size
Figs. 9(a) to 9(c) present the mean particle size varying with flow rate of pigment solution (F), precipitation pressure (P), and precipitation temperature (T), respectively.
These graphs show that the differences of mean particle sizes among all the resultant pigment products are almost within the experimental uncertainty (
3 nm) over the entire range of the individual process parameters, and the mean sizes of the majority cases are in the range of 40 nm to 50 nm. Additionally, the dependences of resultant particle sizes on both temperature and pressure can also be represented as a function of density. In the precipitation experiments, carbon dioxide is a predominant component in the fluid mixtures, and thus the mixture density should be very close to the density of pure carbon dioxide. Fig. 10 depicts the mean particle size varying with the density of carbon dioxide for those experiments operated in either supercritical or superheated region (runs #1 to #16). In these two homogeneous phase regions, a qualitative trend was found that higher densities of the fluid mixtures in the precipitator are favorable to reduce the mean size of resultant pigment particles. Nevertheless, nano-metric pigment particles of green 36 can be produced over a wide range of operating conditions, only if the precipitation is conducted in a homogeneous phase region, either at supercritical or at superheated vapor states. When the precipitation pressures are lower than the corresponding critical value, the relative flow rates between of carbon dioxide and the pigment solution should be sufficiently large to ensure that the precipitation was made in the superheated vapor region.4. Conclusions
Nano-particles of pigment green 36 have been successfully prepared with a continuous supercritical anti-solvent (SAS) apparatus by using quinoline as a solvent and supercritical carbon dioxide as an anti-solvent. As evidenced from the experimental results, the morphology of the resultant products is closely dependent on the phase regions where the precipitations were implemented. Micro-meteric aggregated ball-like particles were produced as the SAS process passed by the
concentrations of fluid mixtures in the precipitator during the SAS process can be estimated by a simple CSTR model. The vapor-liquid equilibrium phase diagram together with this CSTR model provides valuable information for manipulating the particulate products. The experimental results also showed that higher densities of fluid mixtures in the precipitator may be favorable to reduce the particle size of the resultant products.
Acknowledgements
The authors gratefully acknowledged the financial support of the National Science Council, Taiwan, through grant No. NSC-94-2214-E011-009. The authors also thank Mr. H.Y. Chiu for the measurements of phase boundaries and Dr. J.T. Chen, Department of Chemical Engineering, Ming Hsin University of Science and Technology, for valuable discussion.
References
[1] Wu HT, Lee MJ, Lin HM. Nano-particles formation for pigment red 177 via a continuous supercritical anti-solvent process. J. Supercrit. Fluids 2005; 33: 173.
[2] Reverchon E. Supercritical antisolvent precipitation of micro- and nano-particles. J.
Supercrit. Fluids 1999; 15: 1.
[3] Jung J, Perrut M. Particle design using supercritical fluids: Literature and patent survey. J. Supercrit. Fluids 2001; 20: 179.
[4] Gao Y, Mulenda TK, Shi YF, Yuan WK. Fine particles preparation of Red Lake C Pigment by supercritical fluid. J. Supercrit. Fluids 1998; 13: 369.
[5] Hong L, Guo JZ, Gao Y, Yuan WK. Precipitation of microparticulate organic powders by a supercritical antisolvent process. Ind. Eng. Chem. Res. 2000; 39:
4482.
[6] Wu HT, Lee MJ, Lin HM. Precipitation kinetics of pigment blue 15:6 sub-micro particles with a supercritical anti-solvent process. J. Supercrit. Fluids 2006; 37:
220.
[7] Reverchon E, Adami R, De Macro I, Laudani CG, Spada A. Pigment red 60
micronisation using supercritical fluids based techniques. J. Supercrit. Fluids 2005;
[9] Wubbolts FE, Bruinsma OSL, van Rosmalen GM. Dry-spraying of ascorbic acid or acetaminophen solutions with supercritical carbon dioxide. J. Crystal Growth 1999;
198/199: 767.
[10] Reverchon E, Caputo G, De Marco I. Role of phase behavior and atomization in the supercritical antisolvent precipitation. Ind. Eng. Chem. Res. 2003; 42: 6406.
[11] “Isothermal properties for carbon dioxide,”NIST Chemistry WebBook, NIST Standard Reference Database No. 69 - March, 2003, Release, National Institute of Standard and Technology, USA (http://webbook.nist.gov/chemistry/).
[12] Schmitt WJ, Salada MC, Shook GG, Speaker III SM. Finely-divided powders by carrier solution injection into a near or supercritical fluid. AIChE Journal 1995; 41:
2476.