國立臺灣大學生物資源暨農學院植物病理與微生物學系 碩士論文
Department of Plant Pathology and Microbiology College of Bioresources and Agriculture
National Taiwan University Master Thesis
百慕達草白葉病植物菌質體的基因體比較分析 以及其效應因子之研究
Comparative Genomics Analysis and Effector Characterization of the
Bermudagrass White Leaf (BGWL) Phytoplasma
卓舒婷 Shu-Ting Cho
指導教授:林長平 博士 Advisor: Chan-Pin Lin, Ph.D.
共同指導教授:郭志鴻 博士 Co-advisor: Chih-Horng Kuo, Ph.D.
中華民國 106 年 6 月
June 2017
誌謝
在本人就讀碩士班以及至目前的研究生涯期間,接受過許多人的幫助,謹以此文 表達感謝之意。首先感謝我的口試委員老師們—黃皓瑄老師、鄭秋萍老師以及陳仁治 老師,在繁忙的學期末撥空來參與我的論文口試,老師們對於論文內容細心指正,以 及在口試當天給予學生的諸多建議,讓學生受益良多,也使得論文內容更臻完善。更 要感謝兩位論文指導老師—林長平老師以及郭志鴻老師,在我就讀碩士班的兩年中給 予我不論關於生活、課業或是研究上各種寶貴的意見、關懷、支持與包容,這兩年我 真的學到了很多,謝謝老師!
很高興碩班這兩年以及更之前的研究助理時期能夠在郭志鴻老師實驗室度過,從 最一開始以研究助理的身分進入實驗室時,就感受到老師對學生的熱心關懷與耐心指 導,老師帶給我們許多對於研究的正確觀念,並且毫不吝嗇的和我們分享求學與研究 經歷,在多次與老師促膝長談後我才決定繼續攻讀碩士學位,在這之後老師鼓勵我多 接觸學習我不熟悉的研究方法,讓我就讀研究所的期間更加獲益良多。感謝在我一開 始接觸 Linux 系統時帶領我入門的天昫學長超級有耐心的教導,以及和泠伶學姊給予 我準備研究所考試的建議;感謝一起去上韻律課的亮吟、興驊實驗和生活中的鼓勵;
感謝大學姐文穗在我對實驗等專業領域有疑問時的經驗分享和討論;感謝愛趴趴走的 雅怡首先發現我的百慕達草白葉病實驗材料,帶我進 wet lab 做實驗,還在我考上研究 所時請我吃豬排飯慶祝;感謝建廷的相機使用教學分享;感謝 Mindi 對 RNA 相關實驗 的經驗分享;感謝欣盈、乙鳴、幸怡和鴻睿一起吃喝玩樂,讓我有動力吃午餐也讓實 驗室的氣氛更歡樂了;特別感謝鴻睿的加入接手 wet lab 之後的實驗讓我能夠心無旁騖 地趕論文。
很幸運能夠來到林長平老師實驗室,並認識學長姐學弟妹們,感謝林老師當初二 話不說就收我進實驗室,以及之後許多對於植病專業領域的指導和對生活的關懷,並 且時常帶許多名產回來給我們,對我們十分的照顧,使當初對植病一竅不通的我能夠 適應且順利的過完碩班兩年的生活。感謝喬茵、鈺凌、稜雅、偉俊學長姐對我實驗上 的疑問有求必應,且體諒我較長時間在中研院幫我分擔了很多差事;感謝涵嬪和智為 在我口試時十分貼心的幫忙招呼口委老師們和打掃教室等,讓我能無後顧之憂地專心
對付投影機。謝謝植微所的老師們用心、有耐心的教導,使我從完全不懂植病到現在 能夠完成論文順利畢業,學到了很多專業知識。在我撰寫論文期間,感謝劉瑞芬老師 對於我許多關於分生實驗等問題不厭其煩地細心回答;感謝張雅君老師回答我對於論 文中菸草和 vector 選擇相關的問題;感謝洪挺軒老師去高爾夫球場進行草皮病害診斷 時也帶上我,讓我採集實驗材料並有機會觀摩老師專業的植物病害診斷;感謝鍾嘉綾 老師和楊爵因老師對於出國求學的心得分享,讓我未來的研究之路有多一種選擇。感 謝系辦親切的蔡小姐、嚴小姐和程先生在我每次去打擾時都不厭其煩的提供我協助,
還會不時地餵食我,讓我感受到植微系的溫暖與熱情。感謝 R04 的植微所同學們,雖 然我是個隱藏角色,但許多貼心的同學如佳晏、瑋祥、林芝等也會主動邀請我和同學 們一起吃飯;更要感謝可愛的沛延,帶我發掘學校附近的美食,讓我的研究所生活不 孤單,能有你這樣的好同學好朋友真棒!
另外也要感謝從中央以來的好同學好夥伴們,使我雖然晚一般人兩年才念研究所,
還是有你們陪著我,一起念碩班、一起吃喝玩樂。感謝 Even 這兩年來不離不棄的陪伴 與包容,即使你工作很辛苦,但在我忙於課業、實驗、論文時也會貼心的陪我、幫我 準備吃的,還在我學習寫程式時提供許多神人級的專業協助,能遇到你真的很幸運!
最後,感謝我的家人給我的愛、支持和鼓勵,有你們才有現在的我,謝謝你們!
CONTENTS
CONTENTS ... 1
摘要... 3
ABSTRACT ... 4
LIST OF FIGURES ... 6
LIST OF TABLES ... 6
INTRODUCTION ... 7
MATERIALS AND METHODS ... 14
1. Collection of biological materials ... 14
2. Confirmation of phytoplasma infection by 16S rDNA ... 15
3. Confirmation of phytoplasma infection by transmission electron microscopy (TEM) 16 4. Chloroplast observation by microscopy ... 16
5. Chlorophyll fluorescence and content measurement ... 16
6. Whole genome shotgun sequencing ... 17
7. de novo genome assembly ... 18
8. Molecular phylogenetic inference ... 19
9. Gene annotation and homologous gene identification ... 20
10. Genome alignment ... 21
11. Ka/Ks ratio ... 21
12. Effector gene and subcellular localization signal prediction ... 21
13. Generation of transgenic Arabidopsis lines ... 23
14. Growth conditions and confirmation of transgenic Arabidopsis plants ... 25
15. Quantitative RT-PCR experiments ... 25
RESULTS AND DISCUSSIONS ... 27
1. BGWL phytoplasma diseased plant observation, collection, and confirmation ... 27
1.1. Field disease detection ... 27
1.2. Microscopy observation on chloroplast morphology ... 28
1.3. Chlorophyll fluorescence and content measurement ... 30
1.4. Confirmation of phytoplasma by 16S rDNA PCR... 31
1.5. Confirmation of phytoplasma by TEM observation ... 31
2. Comparative genomics analysis of phytoplasmas... 32
2.1. BGWL phytoplasma genome assembly ... 32
2.2. Phylogenetic analysis of 16S rDNA sequence and the 16Sr group ... 34
2.3. Genome alignment with ‘Ca. P. oryzae’ Mbita1 ... 36
2.4. Genome statistic comparison ... 37
2.5. Gene content, metabolic pathway comparison statistic comparison ... 38
2.6. Effector prediction and comparison ... 41
2.7. Molecular evolution of potential mobile units (PMUs) ... 42
3. Effector identification ... 44
3.1. Modified putative effector prediction and criteria ... 44
3.2. Generation and analyses of candidate effector genes Arabidopsis lines ... 45
CONCLUSIONS... 48
REFERENCES ... 93
SUPPLEMENTARY DATA ... 104
摘要
植物菌質體‘Candidatus Phytoplasma cynodontis’ 為百慕達草白葉病(
bermudagrass
white leaf;
BGWL)的病原菌,此草皮病害於 1972 年在台灣初次被發現。該細菌性病原菌可於寄主植物的篩管中及媒介昆蟲體內增殖,致使植物產生葉片白化與植株矮化等 病徵,進而影響受感染之運動場草皮與牧草的品質,並使草皮水土保持的功能降低。
即便已經過多年的努力,目前仍然無法在實驗室中離體培養植物菌質體,因此相關的 研究一直面臨很大的困難。為了突破此限制,本論文針對於桃園觀音採集到的病株 GY2015 進行全基因體定序,藉以瞭解其基因組成。經過基因體組裝目前得到 5 條連續 序列,總長為 502,218 bp,共含有 425 個蛋白編碼基因(protein-coding gene)。為了能對 不同植物菌質體間基因組成演化有更多的了解,我們挑選了另外六株已發表且寄主不 同的植物菌質體基因體序列進行分子演化及比較基因體學分析,結果顯示不同菌株間 的遺傳歧異度有著相當大的差異。此外,BGWL 植物菌質體 GY2015 擁有一組尚未在 其他植物菌質體中發現過的新型 potential mobile unit (PMU)。由於已知 PMU 可能與基 因體的穩定性及效應因子基因水平轉移有關,此發現拓展了我們於植物菌質體遺傳多 樣性的了解。另外我們也發現,前人從其他植物菌質體物種中找到的效應因子基因 SAP11、SAP54/PHYL1 和 TENGU 在 BGWL 植物菌質體的基因體中皆不存在,意味著 BGWL 植物菌質體可能擁有不同的效應因子。我們透過生物資訊分析預測出 45 個候選 效應因子基因,且從基因轉殖植物的表現型初步篩選出一個可能為效應因子基因的候 選基因,表現該基因的轉殖植物出現葉片白化、植株矮化、叢生及不孕花等多項類似 植物菌質體感染的性狀。未來針對這些候選效應因子進行功能研究,將有助於我們對 此病原菌之深入認識。本篇針對一株與現有較完整基因體學研究的植物菌質體在演化 上距離較遠的物種進行研究,透過比較基因體學分析,可增進我們對植物菌質體於演 化、遺傳學及病理學上的認識。
關鍵字:植物菌質體、百慕達草白葉病、比較基因體學、效應因子、植物與微生物交 互作用分子機制
Abstract
‘Candidatus Phytoplasma cynodontis’ is a causative agent of a turf disease—
bermudagrass white leaf (BGWL), which was first reported in Taiwan in 1972. This phytopathogenic bacterium is transmitted by insects and is restricted to sieve tubes of infected plants. The symptoms include chlorosis and dwarfism, thus decreasing the quality of sports fields and pasture, as well as lowering the protection against soil erosion. Despite extensive effort, phytoplasmas have remained uncultivable outside of their hosts, making the investigation of their biology extremely difficult. To circumvent this difficulty, we conducted whole genome sequencing for a diseased plant collected in Guanyin (Taoyuan, Taiwan) to investigate the gene content of this bacterium (GY2015). The draft genome assembly contains five contigs with a combined size of 502,218 bp and 425 protein-coding genes. To better understand the evolution of gene content within this genus, we selected six other phytoplasma genomes for molecular phylogenetics and comparative genomics analysis. The results indicated that the gene content is highly diversified across different phytoplasma species. Moreover, the BGWL phytoplasma harbors a new type of potential mobile unit (PMU) that has not been described in other phytoplasmas. Because PMUs could promote genome instability and horizontal transfer of effector genes, this finding expands our understanding of phytoplasma genetic diversity. Finally, none of the three characterized phytoplasma effectors (i.e., SAP11, SAP54/PHYL1, and TENGU) was found in this BGWL phytoplasma genome, suggesting that this bacterium harbors novel effectors. Our bioinformatics prediction identified 45 putative effector genes and our preliminary screening through expression in transgenic Arabidopsis identified one candidate that induced morphological phenotypes similar to phytoplasma infection (e.g., chlorosis, dwarfism, witches’-broom, and sterile flower). Future functional characterization of these putative effectors could further improve our knowledge of this plant pathogen. In this study, we focus
on a phytoplasma species that represents a highly diverged lineage from all of the other phytoplasmas with genomic studies. Through comparative genomic analysis, this study promoted our understanding on the evolution, genetics, and pathology of phytoplasmas.
Key words: phytoplasma, bermudagrass white leaf (BGWL), comparative genomics, effector, molecular plant-microbe interactions
List of Figures
Figure 1. Molecular phylogeny of phytoplasmas. ... 49
Figure 2. Diseased plants of bermudagrass affected by ‘Candidatus Phytoplasma cynodontis’. ... 51
Figure 3. Healthy and diseased plants of bermudagrass under confocal microscopy observation. ... 57
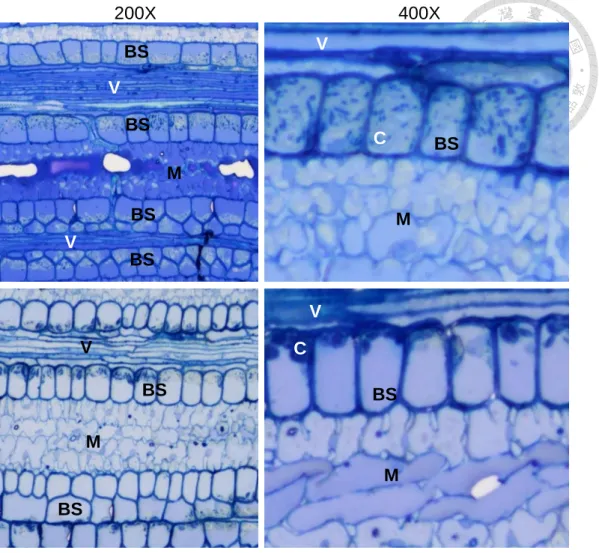
Figure 4. Longitudinal section samples of leaf veins from healthy and diseased plants under optical microscopy observation. ... 61
Figure 5. Chloroplast morphology. ... 62
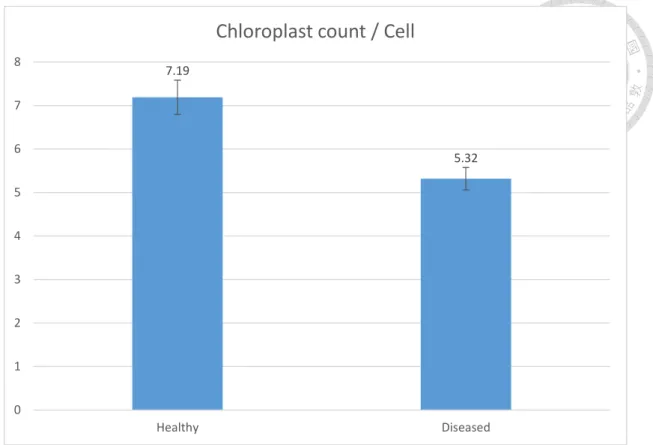
Figure 6. Average chloroplast count in bundle sheath cell. ... 66
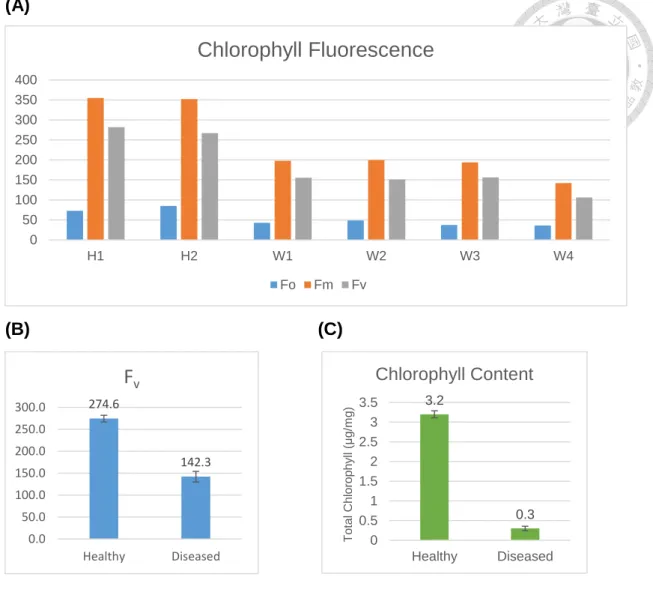
Figure 7. Chlorophyll fluorescence and content measurement. ... 67
Figure 8. Agarose gel electrophoresis confirmation for phytoplasma 16S DNA fragment. .... 68
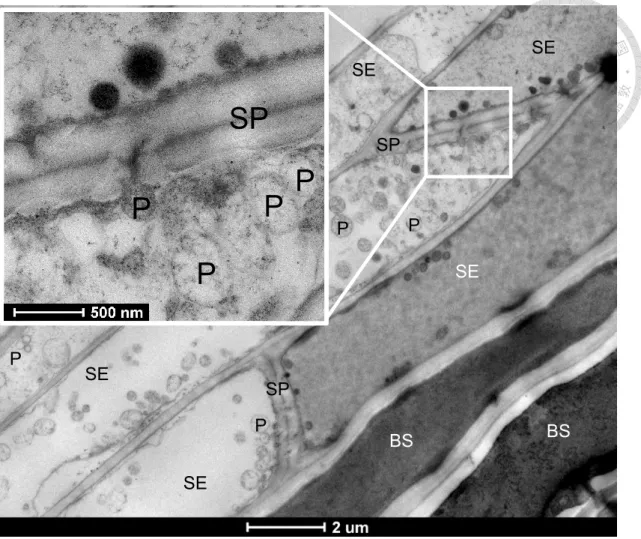
Figure 9. Phytoplasma cell observation. ... 69
Figure 10. Genome map of ‘Candidatus Phytoplasma cynodontis’ GY2015 chromosomal contig1... 70
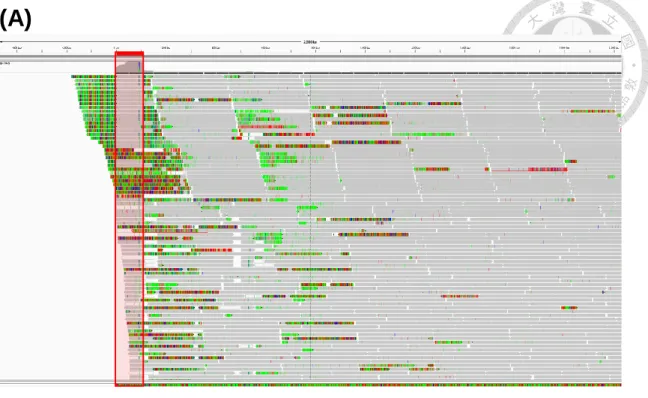
Figure 11. Reads mapping pattern at the repeat region on both ends of the chromosomal contig1... 71
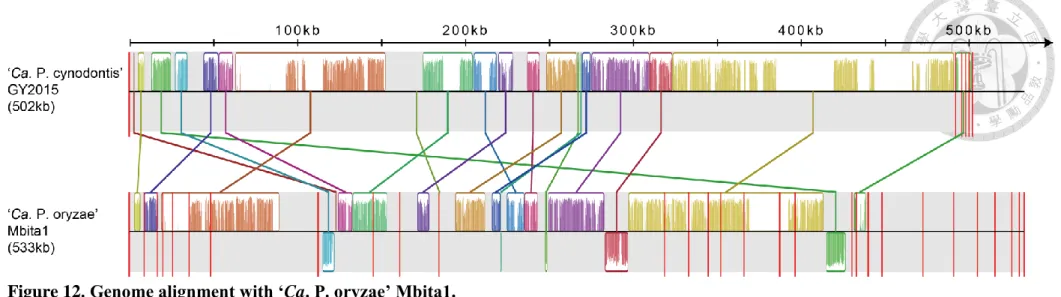
Figure 12. Genome alignment with ‘Ca. P. oryzae’ Mbita1. ... 72
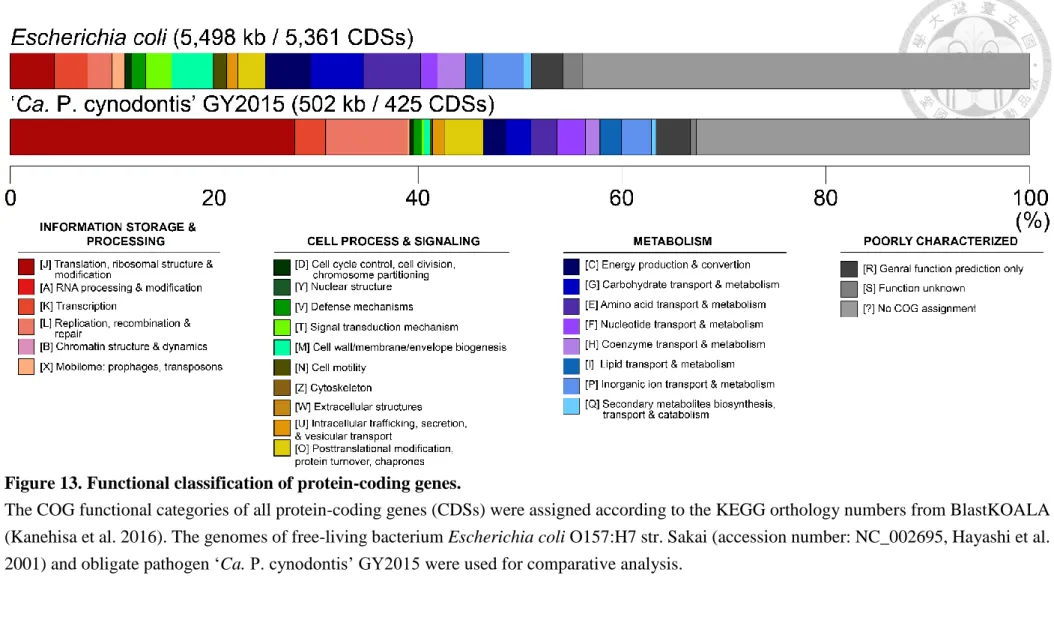
Figure 13. Functional classification of protein-coding genes. ... 73
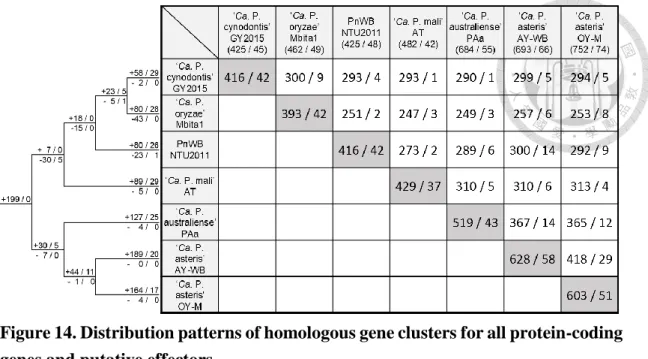
Figure 14. Distribution patterns of homologous gene clusters for all protein-coding genes and putative effectors. ... 74
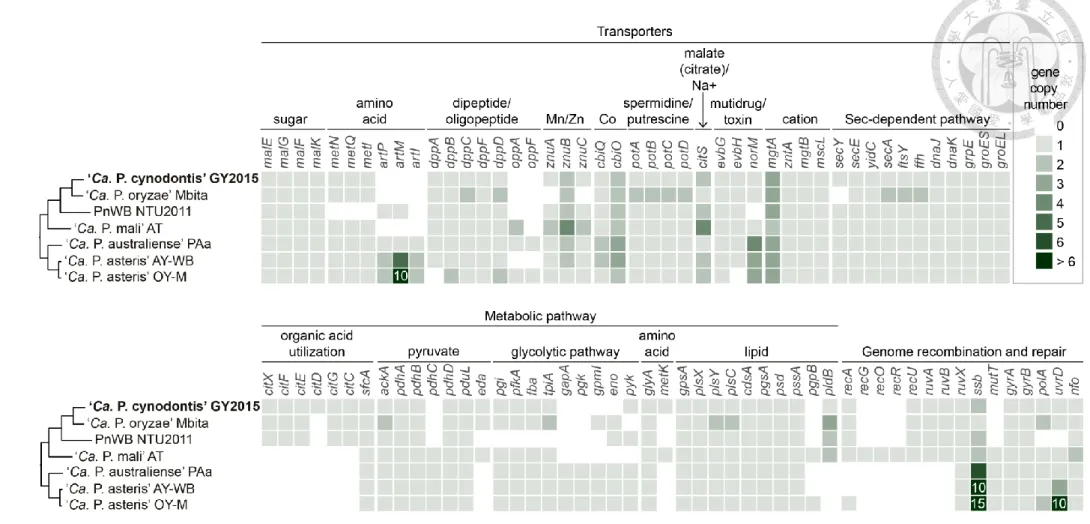
Figure 15. Highlights of selected metabolic pathways and transporters in phytoplasmas. ... 75
Figure 16. Fragments of pseudogenized pdhC gene. ... 76
Figure 17. Effector prediction flow chart and results comparison. ... 77
Figure 18. Characterized effectors in the seven available phytoplasma genomes. ... 78
Figure 19. PMUs of available phytoplasma genomes. ... 79
Figure 20. Molecular phylogeny of conserved and PMU-associated genes. ... 80
Figure 21. Amino acid alignment of three effector candidates with homologs in other phytoplasma genomes showing conserved signal peptide cutting site. ... 81
Figure 22. Transgenic Arabidopsis plant with phenotypes in pilot study... 82
Figure 23. Transgenic Arabidopsis plant of with phenotypes in this study. ... 83
List of Tables
Table 1. Genome characteristics comparison. ... 86Table 2. Genome characteristics of ‘Ca. P. cynodontis’ GY2015. ... 87
Table 3. Information of effector prediction. ... 88
Introduction
Phytoplasmas, a group of bacterial pathogens belonging to the class Mollicutes, are economically important disease agents of plants. These obligate parasites were first found by Doi et al. in 1967 and formerly named as mycoplasma-like organisms (MLOs) (Doi et al.
1967). In 2004, all phytoplasmas were assigned to the genus “Candidatus Phytoplasma”
(IRPCM 2004), with the term “Candidatus” to indicate their interim taxonomical status due to the lack of pure culture. These plant pathogens are characterized by the absence of cell wall, the small cell size (less than 1 μm in diameter), small genome size (530 kb~1,350 kb) with low GC content, and extensive gene losses (Bové 1997; Marcone et al. 1999).
Phytoplasma species were classified based on the restriction fragment length polymorphism (RFLP) pattern of 16S rRNA gene sequences (F2nR2 fragment) (Cho et al.
2016; Lee et al. 1998; Wei et al. 2008; Zhao and Davis 2016). This RFLP pattern classification system has been modified and improved after its first establishment in 1993 (Lee et al. 1993). The 17 chosen restriction enzymes for RFLP grouping were: AluI, BamHI,
BfaI, BstUI/ThaI, DraI, EcoRI, HaeIII, HhaI, HinfI, HpaI, HpaII, KpnI, Sau3AI/MboI, MseI, RsaI, SspI, and TaqI. By definition, a new group needs to exhibit <0.85 RFLP pattern
similarity to existing groups and a new subgroup needs to exhibit <0.97 similarity to existing subgroups. To date, 34 groups and hundreds of subgroups have been defined (Pérez-López et al. 2016; Zhao and Davis 2016). As more and more new phytoplasma lineages are being discovered, a well-established and user-friendly database system for phytoplasma 16Sr groups registration and inquiry is in great need.Phytoplasmas could infect more than 1,000 plant species, including many important or high-value production crops and fruits such as rice, corn, sugarcane, lime, pear, grapevine, blackberry, stone fruit, strawberry, apple, coconut, and palm tree (Lee et al. 2000; Streten and
Gibb 2006). Several studies (Bosco et al. 1997; Marzachi et al. 1998; Weintraub and Beanland 2006) have demonstrated that the host range of phytoplasmas depends on the feeding behavior of their insect vectors. These phytoplasmal diseases often cause severe economic losses either due to the decrease of production, the efforts on controlling the disease, or to refund and replanting. Thus, phytoplasmal diseases are serious problems in agriculture. For instance, the grapevine flavescence dorée phytoplasma (FD) severely damaged European vineyard, reducing the grapevine vitality and yields and irreparably compromising the production of wine (EFSA Panel on Plant Health 2014). The apple proliferation phytoplasma (AP) caused the reduction of the fruit weight and poor taste, leading to huge amount of unmarketable fruits (Seemüller et al. 2011).
The common symptoms induced by phytoplasma include dwarfism, yellowing or reddening of the leaves, witches’-broom, shoot and root proliferation, virescence (pigment loss of flowers, green petal) and phyllody (leaf-like structure of flowers, resulting in sterile flower), and death of the plant (Agrios 1997; Kirkpatrick 1992; McCoy et al. 1989). Some of these phytoplasmal symptoms were considered to be the way how phytoplasmas make their plant hosts more attractive to their insect vectors (Mayer et al. 2008; MacLean et al. 2014).
Their host plants will only live for the reproduction and transmission of phytoplasmas instead of producing next generation of their own, therefore were called “zombie plants” (MacLean et al. 2014). In order to increase the efficiency of transmission, phytoplasmas also affect their insect vector. Rather than turning them into zombies, this time phytoplasmas benefit the insects. The phytoplasma-infected insects tend to live longer and produce more offsprings.
Once their eggs hatched, the nymphs will directly feed on the diseased plant, thus facilitating the dispersal of phytoplasma (Beanland et al. 2000). Within their lifecycle, phytoplasmas are restricted in the sieve element of the phloem tissue in plant hosts and could be transmitted by the sap-feeding insect vectors (e.g., leafhoppers, planthoppers, and psyllids) (Sugio et al.
2011b). Thus, the two common ways of controlling the phytoplasmal disease are to remove the diseased plants from the fields and to eliminate the insect vectors (Hogenhout et al. 2008).
Currently, a major limitation of phytoplasma research is the lack of axenic culture of phytoplasma cells in defined media. Although sporadic successes have been reported, for instance, a commercial media whose composition is covered by patent (Contaldo et al. 2012), most research groups are unable to repeat these works. Due to this limitation, most of the conventional molecular biological studies (e.g., gene knockout) do not work for phytoplasmas. Fortunately, the advances in Next Generation Sequencing (NGS) technology promoted the genomic studies of these uncultivated bacteria, allowing us to understand their gene content (Kakizawa and Yoneda 2015). Moreover, with the help of bioinformatics tools, predictions could be made to infer putative effectors for functional characterization (Bai et al.
2009).
The first complete genome sequence of a phytoplasma, the onion yellows phytoplasma line OY-M (‘Candidatus Phytoplasma asteris’ OY-M, 16SrI-B), was published in 2004 (Oshima et al. 2004). The OY-M phytoplasma induced shoot proliferation and mild leaf yellowing symptoms on garland chrysanthemums (Oshima et al. 2001). This genome contains one circular chromosome (853,092 bp, accession number: AP006628) and two plasmids (EcOYM: 5,025 bp, accession number: AB076263; pOYM: 3,932 bp, accession number: AB061723). In the gene content analysis, the authors found that this phytoplasma has lost many basic metabolic pathways, such as the main energy production (e.g., pentose phosphate pathway, TCA cycle, and F0F1-type ATP synthase) and the biosynthesis of amino acid, fatty acid, and nucleotides. In contrast, many transporter genes are present, suggesting that this phytoplasma could obtain many metabolites and even ATPs directly from its nutrient-rich habitat. These findings provided the first clue on why it is so difficult to cultivate phytoplasma cells outside of their hosts. Later in 2006, the complete genome of
aster yellows witches'-broom phytoplasma AYWB (‘Candidatus Phytoplasma asteris’ AY- WB, 16SrI-A) was published (Bai et al. 2006). It contains one circular chromosome (706,569 bp, accession number: CP000061) and four plasmids (pAYWB-I: 3,972 bp, accession number:
CP000062; pAYWB-II: 4,009 bp, accession number: CP000063; pAYWB-III: 5,104 bp, accession number: CP000064; pAYWB-IV: 4,316 bp, accession number: CP000065). The AYWB phytoplasma causes symptoms such as yellowing, stunting, witches’-broom, virescence, and phyllody, lead to sterile flower and necrosis of the plant in the end. The comparative analysis in this study indicated that a large portion of phytoplasma genomes (13.8% in AY-WB and 23% in OY-M) are potential mobile units (PMUs). These repetitive and mobile DNA fragments often consist of genes encoding transposase (tra5), DNA primase (dnaG), DNA helicase (dnaB), thymidylate kinase (tmk), ATP-dependent Zn protease (hflB), DNA-binding protein HU (himA), single-stranded DNA-binding protein (ssb), specialized sigma factors (sigF), as well as the virulence factors (i.e., effectors). There are evidences that PMUs could move between different phytoplasma species on divergent phylogenetic lineages through horizontal gene transfer (HGT) (Chung et al. 2013; Ku et al. 2013). Hence the PMUs were considered to be correlated with the genome instability, the host range adaptation, and the virulence of phytoplasma. Subsequently, several more phytoplasma genomes have been published, including those from ‘Ca. P. australiense’ PAa (16SrXII), the causative agent of dieback in papaya, grapevine yellows and others (Tran Nguyen et al. 2008), ‘Ca. P. mali’ AT (16SrX), associated with apple proliferation disease (Kube et al. 2008), and the peanut witches’-broom phytoplasma PnWB NTU2011 (16SrII) which was isolated in Taiwan (Chung et al. 2013).
Phytoplasmas manipulate the gene expression of their host via secreting the effector proteins through Sec secretion system, resulting in the abnormal development of the plant host and alleviation of the immune response to the invaders (i.e., both pathogens and insects)
(Hogenhout and Loria 2008). The bioinformatics prediction for effector gene is first based on the presence of N-terminal signal peptides (SP) on its amino acid product, so the peptide could be secreted out of the phytoplasma cell through the Sec-dependent pathway. The length of SP is commonly between 20 to 50 amino acids. The protein containing additional transmembrane domain is likely to be embedded in the cell membrane of phytoplasma after secretion, thus would be discarded from the candidates. Finally, the rest of the proteins were predicted to be soluble proteins (Bai et al. 2009). Since phytoplasma are restricted to the sieve element, the proteins secreted out of phytoplasma will directly be inside of the phloem cell and pass to the developing plant tissues by the plasmodesmata, the channels connecting cell to cell. The size limit for protein passing through plasmodesmata of sink tissue is smaller than 40 kDa (Imlau et al. 1999). Because of the inability of culturing phytoplasma and the limitation of genetic tools, one of possible ways to identify effectors is to express the candidate genes in plants. To date, three putative effectors have been functionally characterized through this approach, including SAP11 (Sugio et al. 2011a), SAP54 (MacLean et al. 2011), and TENGU (Hoshi et al. 2009). According to these studies, the presence of nucleus localization signal (NLS) and coiled-coil domain (CCD) were also found in the effectors. The effector SAP11 with NLS could localize in the nucleus of its plant host and interact with plant’s transcription factors (Sugio et al. 2014). The CCDs of the effectors play a role in protein-protein interaction, thus are important for the interaction between effectors and host’s proteins.
‘Ca. P. cynodontis’ (16SrXIV-A), the causative agent of bermudagrass white leaf (BGWL) (Marcone et al. 2004) that was first reported in Taiwan (Chen et al. 1972), is associated with many plant diseases. Most of the reported plant host are gramineous weeds.
For instance, white leaf diseases of golden beard grass (Chrysopogon acicalatus) (Win and Jung 2012), brachiaria grass (Brachiaria distachya) and annual blue grass (Poa annua) (Lee
et al. 1997), Delhi grass (Dichanthium annulatum) (Rao et al. 2009), carpet grass (Axonopus
compressus) (Sunpapao 2016), Burmann's basketgrass (Oplismenus burmannii) and hairy
crabgrass (Digitaria sanguinalis) (Rao et al. 2010), and diseases of date palms (Cronjé et al.2000), crops durum and bread wheat (Rao et al. 2017b). Apart from gramineous plants, Cannabis little leaf and witches’-broom diseases (Can LL-WB) (Chaube et al. 2014), witches’-broom disease of acid lime (WBDL) (Ghosh et al. 2017), and lychee disease (Rao et al. 2017a) were also reported to be associated with 16SrXIV-A subgroup phytoplasmas. To date, the diseases associated with ‘Ca. P. cynodontis’ have been reported in Taiwan (Chen et al. 1972), Thailand (Sarindu and Clark 1993), Myanmar (Win and Jung 2012), India (Rao et al. 2007), Pakistan (Zahoor et al. 1995), Iran (Salehi et al. 2009), Turkey (Çağlar et al. 2013), Israel (Bar-Joseph 1975), Sudan (Dafalla and Cousin 1988), Kenya (Obura et al. 2010), Italy (Marcone et al. 1997a), Australia (Tran-Nguyen et al. 2000) and Cuba (Arocha et al. 2005).
However, phytoplasmas belonging to the 16SrXIV-A subgroup have not been found in North America yet.
The bermudagrass (Cynodon dactylon) is an important and popular grass commonly used as the ground cover for sports fields (e.g., golf course, football pitch and baseball field) and pasture. The disease symptoms caused by BGWL phytoplasma include extensive chlorosis (white leaf), stunting, shortened stolon and internodes, bushy, small leaves, and death of the plants. The diseased plants, appearing as white blotches on the turf, are easy to distinguish from the healthy ones. In addition to the unsightly view, this disease would also lower the protection of the turf against soil erosion and affect recreation and agriculture.
In this study, we present the whole genome sequence and gene annotation of the BGWL phytoplasma strain GY2015 which was isolated in Guanyin, Taoyuan ( 桃園觀音). This phytoplasma represents a highly diverged lineage from all of the other phytoplasmas with genomic studies (Chung et al. 2013; Cho et al. 2016). Through comparative analysis with six
other phytoplasma genomes and detailed comparisons of effector gene content, this study greatly improves our understanding of phytoplasma genome diversity. Moreover, we empirically screened several predicted effectors genes to examine their phenotypic effects on transgenic Arabidopsis thaliana plants. Taken together, this study promoted our understanding on the evolution, genetics, and pathology of phytoplasmas.
Materials and Methods
1. Collection of biological materials
The GY2015 strain used for genome sequencing and microscopy observation was collected from naturally infected diseased bermudagrass plants (showing white leaf symptom) in Guanyin beach in Taoyuan City (觀音海水浴場; 328 桃園市觀音區中興路 458 號;
25°02’47.6’’N 121°04’34.7’’E) on May 28, 2015. The white leaves on the shoot tips were cut with a surgical scissor. The sample was surface sterilized with the following steps: 1. Rinse by ddH2O to wash off the dust. 2. Soak in 75% EtOH and shake for 30 sec. 3. Rinse by sterile water. 4. Soak in 1% bleach solution* and shake for 5 min. 5. Rinse twice by sterile water. 6.
Wipe and tap by napkin and air dry. (1% Bleach solution = 20% bleach (CLOROX) + 80%
sterile water + 1 drop of Triton X-100). The total genomic DNA was isolated using the Wizard Genomic DNA Purification Kit (Promega), according to the technical manual for plant tissue.
Other shoot samples for field disease detection (田野病害調查) from the following naturally infected bermudagrass were confirmed BGWL phytoplasma infection by 16S rDNA sequence (see below for information): 1. North Bay Golf & Country Club. Shimen Dist, New Taipei City (北海高爾夫鄉村俱樂部, 新北市石門區草里里草埔尾 5 號), sample collected on June 23, 2015. The diseased plants were found both on green (25°17’13.1’’N 121°35’55.8’’E) and beside the path (25°17’08.9’’N 121°35’52.8’’E). 2. Taipei Golf Club.
Luzhu Dist, Taoyuan City (台北高爾夫俱樂部, 桃園縣蘆竹鄉赤塗崎三十四之一號), sample collected on June 23, 2015. The diseased plant sample kindly provided by Taipei Golf Club were found on green. The GPS position is unknown. 3. National Taiwan University (NTU). Da’an Dist, Taipei City (國立台灣大學, 臺北市羅斯福路四段一號), sample collected on April 17, 2017. The diseased plant was found at the green in front of the main
library (總圖前的振興草坪, 25°01’01.8’’N 121°32’21.6’’E). No collection permit for this weed is required on public land in Taiwan. In the cases of collection from two private golf clubs, the collect was permitted and helped by the managers.
2. Confirmation of phytoplasma infection by 16S rDNA
The total genomic DNA samples isolated from diseased plants were used as DNA template for PCR detection. The phytoplasma 16S rDNA region specific primer used for PCR and Sanger sequencing are P1 and P7 (Table S1) (Smart et al. 1996). PCR was carried out in a 25 μL volume containing 100 to 200 ng of template DNA, 0.1 μM of each primer, and 1X GoTaq® Colorless Master Mix (Promega). The mixture was subjected to the following incubations by AB Veriti 96-well Thermal Cycler machine: 5 min of initial denaturation at 95℃, 35 cycles: 30 sec of denaturation at 95℃, 30 sec of annealing at 52℃, 2 min of extension at 72℃, 10 min of final extension at 72℃, then hold at 4℃. The amplification products were analyzed by agarose gel electrophoresis. 1% of agarose gel and Seeing Safe Nucleic Acid Stain (Seeing Bioscience) were used, the electrophoresis was run under 8cm/V, 25 min condition. The gel was visualized and photograph using DGIS-11c Digital Gel Image System (DigiGel) and Dark Reader blue transilluminators (Clare Chemical Research) with a 600 nm filter. PCR products which only present single band with approximately 1.8 kb in size were pretreated by Exo-CIP for PCR cleanup. The treated PCR products were then send to the DNA Analysis Core Laboratory of the Institute of Plant and Microbial Biology (IPMB) at Academia Sinica (AS) for Sanger sequencing. The resulting sequences were quality trimmed using Lucy (Chou and Holmes, 2001) and then used for BLASTn (Camacho et al.
2009) searches against National Center for Biotechnology Information (NCBI) RefSeq of non-redundant proteins database (nr db) to check the DNA sequence identities with reference sequence on NCBI GenBank (Benson et al. 2011).
3. Confirmation of phytoplasma infection by transmission electron microscopy (TEM)
The ultrathin sections sample preparation from leave vein and rhizomes for transmission electron microscopy (TEM) observation were kindly provided by Plant Cell Biology Core Lab (IPMB, AS). The sample preparation was using chemical fixation, embedding in Spurr’s resin, stained with methanolic uranyl acetate (UA in MeOH) for 20 min. TEM sample for phytoplasma cells detection were observed using the TEM (Philips CM100, since 1996) with Gatan cryo holder and Gatan Orius CCD camera.
4. Chloroplast observation by microscopy
For confocal microscopy observation, we used the fresh leaf sample (without fixation, staining or dissection) collected from the green in front of the main library of NTU on April 17, 2017. BGWL phytoplasma infection was confirmed by 16S rDNA region PCR and Sanger sequencing. The 16S sequence has >99% identities to both the reference sequence BGWL-C1 and the GY2015 strain. The first matured, fully expanded leaf, counting from the shoot tip, was harvested. The sample was observed using Zeiss LSM 510 Meta Confocal Laser Scanning Microscope, argon ion laser emits at 488 nm, emission window 650-700 nm.
The images were viewed at 20X with 1, 2, 4-zoom. For optical microscopy observation, the same sample for TEM were using. The slices were viewed using optical microscopy OLYMPUS BX40 with Canon DS126371 CCD. The leaf vein TEM slice samples (the same sample also used for phytoplasma particles observation) were used for chloroplast counts and shape observation using the same TEM facility.
5. Chlorophyll fluorescence and content measurement
Diseased and healthy plant samples were also collected for chlorophyll fluorescence and content measurement. All protocols, experimental reagents, and equipments were kindly provided by Dr. Jen-Chih Chen (陳仁治) at National Taiwan University (Taipei, Taiwan). To determine the maximum photosystem II (PSII) activity ((Fm–Fo)/Fm), two healthy (H1, H2) and four diseased (W1~W4) leaf samples were incubated in the dark for 5 min and then flashed with saturate light (4,000 mmol photons·m-2·s-1) to obtain the dark-adapted minimal fluorescence (Fo) and dark-adapted maximal fluorescence (Fm) using FluorCam 800MF (Photon Systems Instruments, Brno, Czech Republic). The maximum PSII activity was then calculated. For chlorophyll content measurement, the modified protocol described in Porra et al. 1989 was followed: 1. For each extraction sample, we weight ~2 mg of fresh leaf sample and pound the leaves in a 1.5 mL tube with a pestle until the leaves become pulp. 2. Add 1 mL of 80% acetone and mix up. Stand for 3 hr (away from light). 3. Centrifuge at 12,000 ×g for 30 min. 4. Measure OD at 646.6 nm, 663.6 nm and 750 nm of the supernatant. 5. Estimate the total chlorophyll content (chlorophyll A and B). Total chlorophyll concentration (μg/mL)
= 17.76 A646.6 + 7.34 A663.6. Chlorophyll content per mg of leaf sample (μg/mg) = Total Chlorophyll (μg)/weight (mg) of the leaf sample.
6. Whole genome shotgun sequencing
The Next Generation Sequencing DNA-Seq Library service was provided by the Genomic Technology Core (IPMB, AS) in July 2016. The kit used for Library preparation is Miseq Reagent Kits v3, Micro format, 600 cycles.The shotgun sequencing run was based on the Illumina MiSeq service provided by the DNA Sequencing Core of the Institute of Molecular Biology at AS. The sequencing conditions: paired-end library, 301 bp per read, insert size = ~550 bp. We obtained 25,821,241 read pairs, corresponding to ~15.5 Gb of raw sequencing data from the Illumina MiSeq run.
7. de novo genome assembly
The de novo genome assembly was based on the paired-end reads. The procedure for the assembly and annotation was largely based on that described in one of our previous studies (Chung et al. 2013). The raw reads were trimmed by their quality and length. Since the qualities of the bases usually go down from 5’ to 3’ of the read, the first base with a quality score <20 was selected as the point for trimming. After the quality trimming, the reads shorter than 200 bp were excluded from the assembly step. The filtered data set contains 11,323,968 paired and 9,713,950 unpaired reads, corresponding to ~22% of the total raw reads. We chose these strict trimming and filtering conditions because the remaining high quality read pairs provided approximately 50X coverage depth of the phytoplasma genome, which is recommended according to the user manual of the Velvet assembler (Zerbino and Birney 2008). These paired reads were used as the input (shortPaired) for Velvet (v1.2.10) run with the following setting: kmer = 141, exp_cov = auto, cov_cutoff =10, max_coverage = 500, and min_contig_lgth = 2000. Approximately 3% of the input reads were used by the Velvet assembler. The 101 contigs produced by Velvet were used as queries to run BLASTx (Camacho et al. 2009) against a custom database that contained all 21,185 ‘Candidatus Phytoplasma’ (Taxonomy ID 33926) protein sequences in GenBank as of November 2013.
43 contigs with a hit with an e-value of lower than 1e-5 were selected for the second BLAST run against the Spartina maritima chloroplast sequence (Rousseau-Gueutin et al. 2015). The three chloroplast contigs were removed from the assembly result. In order to reduce the background noise caused by chloroplast genome, we also tried a second run of Velvet assembly without the chloroplast reads. We discard the reads that could be map on the chloroplast genome we assembled previously (Huang et al. 2017), and then used rest of the reads as input to run the Velvet assembly. However, this second approach does not provide noticeable improvement over the first approach other than the exclusion of those three
chloroplast contigs. The remaining 40 contigs were used as the starting point for our iterative assembly improvement process. For each iteration, we mapped all paired-end raw reads and the long reads merged by FLASH (Magoč and Salzberg 2011) (if paired reads overlap more than 50 bp) to the contigs using BWA v0.7.12 (Li and Durbin 2009) and visualized the result using IGV 2.3.41 (Robinson et al. 2011). Polymorphic sites were examined using the MPILEUP program in the SAMTOOLS package v1.2 (Li et al. 2009). To verify the correctness of the assembly (repeat regions and aberrant coverage pattern regions), we design primers for PCR across the uncertain regions and Sanger sequencing were used for validation (Table S1). These updates were incorporated into the assembly and examined in the next iteration. We repeated this iterative process until no improvement could be made with the method described. After the genome of rice yellow dwarf phytoplasma (RYD) ‘Ca. P. oryzae’
Mbita1 phytoplasma been published (Fischer et al. 2016), we also mapped our raw reads to the RYD genome, trying to find the missing contig. Then we got the four extra contigs, which may belong to plasmids.
8. Molecular phylogenetic inference
The procedure for molecular phylogenetic analysis was described in the previous study (Chung et al. 2013). The 16S rDNA sequence of GY2015 strain from the genome assembly result in this study was used for the molecular phylogenetic analysis of 16S rDNA sequence.
Other phytoplasmas 16S rDNA sequences from at least one of each 16Sr group (Zhao and Davis 2016), as well as the outgroup Acholeplasma laidlawii PG-8A were downloaded from GenBank (see Fig. 1 for accession numbers). These sequences were aligned using MUSCLE v3.8.31 (Edgar 2004) with the default settings. The resulting multiple sequence alignment was used to infer the species phylogeny using the maximum likelihood program PhyML version 20120412 (Guindon and Gascuel 2003). To estimate the level of support for each
using the SEQBOOT program in the PHYLIP package v3.69 (Felsenstein 1989) and repeated the phylogenetic inference as described above. For the phylogeny analysis of PMU associated genes, Gblocks Server (Talavera and Castresana 2007) was used for conserved region researching. Overall similarity among the eight available genomes (seven phytoplasmas and one outgroup) was estimated by joining all MUSCLE aligned amino acid sequences of the 146 core homologous genes which presenting as single copy in each genome (See below for further information). All of the phylogenetic trees were visualized and adjusted using FigTree v1.4.3 (Rambaut 2007).
9. Gene annotation and homologous gene identification
The procedure we used for genome annotation and homologous gene identification were mainly following the pipeline described in the previous study (Chung et al. 2013).
Briefly, the sequences of the GY2015 genome assembly result were used for protein coding sequences (CDS) prediction with Prodigal (Hyatt et al. 2010). The rRNA and tRNA genes were annotated with RNAmmer (Lagesen et al. 2007) and tRNAscan-SE (Lowe and Eddy 1997). The six available phytoplasma genomes (Table 1) were used as the primary references to assign gene names and description of protein-coding genes. All-against-all BLASTp (Camacho et al. 2009) searches among the seven genomes with an e-value cutoff of 1e−15 was performed. This choice of a stringent e-value cutoff prevents spurious hits between non- homologous genes that share some conserved domains and facilitates the identification of true homologous genes. The similarity results were supplied as the input for OrthoMCL (Li et al. 2003) to perform homologous gene clustering. The algorithm is largely based on the popular criterion of reciprocal best hits between genomes for the identification of orthologous genes and includes additional normalization steps for between- and within-genome comparisons; an independent benchmarking study has confirmed the reliability of this algorithm (Hulsen et al. 2006). For GY2015-specific CDS and CDS without conserved gene
name or description among these seven phytoplasmas, the BLASTp (Benson et al. 2011) hits against the nr db and the BlastKOALA (KEGG Orthology And Links Annotation) (Kanehisa et al. 2016) results were also included as information. The taxonomy group setting for BlastKOALA is 31969 for class Mollicutes, and “genus_prokaryotes” KEGG GENES database file was searched. Pseudogenes were annotated where the gene product has an incomplete domain (less than 70% of the whole domain) comparing to its homolog in other genomes. The COG functional categories were then assigned according to the KEGG orthology numbers got from BlastKOALA. CDS without COG were assigned to ‘?’ category.
Escherichia coli O157:H7 str. Sakai (accession number: NC_002695, Hayashi et al. 2001)
was used for COG composition comparison.10. Genome alignment
The draft genome assembly of GY2015, containing five contigs, was aligned with the draft genome (containing 28 contigs) of rice yellow dwarf phytoplasma (RYD) ‘Ca. P. oryzae’
Mbita1 (Fischer et al. 2016) [LTBM00000000] by Mauve (Darling et al. 2004). The contigs of Mbita1 were reordered and aligned to GY2015 genome. Only one parameter was changed from the default setting: The Match Seed Weight was set to 21 (maximum).
11. Ka/Ks ratio
The Ka/Ks analysis between GY2015 and ‘Ca. P. oryzae’ Mbita1 was estimated by PAML v4.8a (Yang 2007). The 257 gene clusters shared by these two genomes with only one copy were used for comparison.
12. Effector gene and subcellular localization signal prediction
The effector prediction procedure was based on the pipeline described in Bai et al.
(2009) and Chung et al. (2013) with partial modification. After CDS prediction, the program
SignalP v4.1 (Thomas et al. 2011) was used to predict the presence and cleavage site of signal peptide in all CDS (without size limitation). A total of six runs of different parameter setting were tested to find the best options for prediction. “Gram-positive bacteria” (-t gram+) were set for all six runs. The setting details for each run were list as follow (also see Table S5 for settings and prediction results for GY2015): RUN1 used SignalP v4.1 default setting (0.57 D-cutoff for SignalP-noTM networks, 0.45 D-cutoff for SignalP-TM networks). RUN2 used SignalP v3.0 setting (0.45 D-cutoff for both SignalP-noTM and SignalP-TM networks).
RUN3 also used SignalP v4.1 default D-cutoff values as in RUN1 but choose ‘no-TM’
method (-s notm) setting as “Input sequences do not include TM regions” for a no transmembrane segment prediction. RUN4 used SignalP v4.1 sensitive setting (0.42 D-cutoff for both SignalP-noTM and SignalP-TM networks). RUN5 used SignalP v3.0 setting for D- cutoff value as well as the ‘no-TM’ method. RUN6 used SignalP v4.1 sensitive setting for D- cutoff value as well as the ‘no-TM’ method. For proteins that contained a cleavage site between the first 20-51 amino acid, we removed the N-terminal signal peptide and checked the presence of transmembrane domains by TMHMM v2.0 (Krogh et al. 2001). Further subcellular localization signal (e.g., nuclear localization signal (NLS) and chloroplast signal, including chloroplast stroma, chloroplast thylakoid membrane, and chloroplast thylakoid space) was predicted by PSORT (Nakai and Horton 1999) and PredictNLS (Cokol et al.
2000). The setting for PSORT, source of input sequence is plant. The coiled-coil domain (CCD) was predicted by COILS (Lupas et al. 1991) with the following setting and criteria:
MTIDK matrix and weights: a,d=2.5 and b,c,e,f,g=1.0. The region with ≧ 0.5 CCD formation possibilities were considered as CCD. Proteins that contain a signal peptide but no transmembrane domain from RUN3 (Part A), or contained a signal peptide and chloroplast signal (Part B), and without strongly supported gene annotation, were considered as putative
effectors in our annotation. We also generate the prediction of all seven chosen phytoplasma from RUN3 (only considered Part A), and used for comparative analysis.
13. Generation of transgenic Arabidopsis lines
The genome DNA sample isolated from diseased bermudagrass, the same as the one used for whole genome shotgun sequencing, was used as DNA template for effector gene cloning. The procedure for cloning is modified from the description in the previous study (MacLean et al. 2011). Briefly, the putative effector genes without the signal peptide region was added with ATG at the beginning of the DNA sequence as the start codon if it does not start by ATG after cleavage. The clones used for pilot study were obtained from gene synthesized and kindly provided by Dr. Saskia A. Hogenhout at the John Innes Centre (35S::Opt(SAP11AY-WB), 35S::SAP54AY-WB, and 35S::eGFP::SAP54AY-WB used in Sugio et al.
2011a and MacLean et al. 2014). The clones from gene synthesized and codon optimization (Opt) for expression in Arabidopsis thaliana for a higher expression efficiency are containing SAP11PnWB, Opt(SAP11PnWB), SAP54PnWB, or Opt(SAP54PnWB) genes. The gene synthesized and codon optimization service was provided by Genomics BioSci & Tech (OptimumGene was used for codon optimization). The clones were designed to synthesize as entry clone which is ready for direct LR recombination reaction (see below for more information) with attL sites on both ends of the gene sequences (synthesis sequences were shown in Table S1).
The modified sequence was amplified using the primers listed in Table S1 by KAPA HiFI HotStart ReadyMix (Kapa Biosystems) following the manual. Two protocols (one step and two steps) for primer design and PCR, as described in the manual of Gateway® Technology with Clonase® II (Invitrogen), were used for the DNA fragment amplification: 1. One step protocol primer set (attB1_FP/attB2_RP) contain the attB sequence along with the gene specific sequence. 2. Two steps protocol primer sets include the attB adapter primer set
specific_FP/template-specific_RP). The template-specific sequences are within 18-25 bp. The PCR condition for one step protocol is as follow: The reaction volume is 50 μL. The cycle was set as: (i) 95℃ 5 min (ii) 98℃ 20 sec, 45℃ 1 min, 72℃ 1 min (x10) (iii) 98℃ 20 sec, 50-65℃(Tm) 30 sec, 72℃ 1 min (x25) (iv) 72℃ 5 min, 25℃ hold. The PCR condition for two steps protocol is as follow: Step 1: 10 μL (Template-specific primers were used). (i) 95℃
5 min, (ii) 98℃ 20 sec, 50-65℃(Tm) 30 sec, 72℃ 30 sec (x10) (iii) 72℃ 30 sec. Step 2: 50 μL, attB adapter primers were used. (i) 95℃ 3 min (ii) 98℃ 20 sec, 45℃ 30 sec, 72℃ 30 sec (x5) (iii) 98℃ 20 sec, 50-65℃ 30 sec, 72℃ 30 sec (x15) (iv) 72℃ 5 min, 25℃ hold. The PCR products were check by agarose gel electrophoresis and then were purified with either 30% PEG 8000/30 mM MgCl2 solution, supplied with BP Clonase II enzyme mix (Invitrogen), or gel purification with QIAquick Gel Extraction Kit (QIAGEN) if showing multiple bands. The purified PCR products were cloned into the attP DONR vector pDONR211 (Invitrogen), which provides kanamycin resistant for selection, using BP Clonase II enzyme mix following the manual. The products of the BP recombination reaction (entry clones) were transformed into Escherichia coli ECOS™ 101 Competent Cells [DH5a]
(Yeastern) following the six min protocol (protocol 3) in manual, and then was plating on the LB agar media containing 15 μg/ml kanamycin for a higher transformation efficiency. Single colonies were cultured in LB liquid media containing 50 μg/ml kanamycin. The Presto™
Mini Plasmid Kit (Geneaid) was used for plasmid isolation process. Entry clones were sequenced to verify the insert, then cloned into the Gateway destination vector pB7WG2 (Karimi et al. 2002) (kindly provided by VIB-UGENT Center for Plant Systems Biology and Dr. Saskia A. Hogenhout) via the LR Clonase II enzyme mix (Invitrogen) to generate the expression clones following the manual. Expression clones were also sequenced to verify the insert then send to the Transgenic Plant Lab of AS for further Agrobacterium-mediated transformation process. The plasmid DNAs were introduced into Agrobacterium tumefaciens
strain GV3101 by using the electroporation method and transformed into Arabidopsis
thaliana Col-0 by using the floral-dip method.
14. Growth conditions and confirmation of transgenic Arabidopsis plants
The seeds of Arabidopsis thaliana Col-0 were surface sterilized with following steps: (i) Collect ~20μL volume of seeds in a 1.5mL tube. (ii) Add 1 mL 75% ethanol, shake for 30 sec.
(iii) Replace ethanol by 1 mL bleach solution, shake for 8 min. (iv) Replace bleach solution by 1 mL sterile dH2O, shake for 1 min, repeat five times. After sterilization, the seeds were dot on the ½ MS BASTA (glufosinate) selection plate (1% sucrose, ½ X Murashige and Skoog salt with Vitamins (Caisson), MQ water, pH = 5.7, 0.8% phytoagar, BASTA concentration is 10μg/mL), then placed at 4℃ for 2 days to stratify. The seeds were germinating and growing at 22℃ in a growth chamber with a 16h light/ 8h dark photoperiod condition. After 7-10 days, the BASTA resistant plants that have green expanded cotyledons were transferred to soil (peat soil: nacrite: vermiculite = 9:1:1). The insertion of effector gene containing T-DNA was confirmed by total genomic DNA isolation and genomic DNA PCR.
The expression of effector gene was test by total RNA isolation and Quantitative RT-PCR Experiments (see below).
15. Quantitative RT-PCR experiments
Total RNA of mature leaves (~5 mg) harvested from 8-week-old Arabidopsis was isolated and purified using Master Pure RNA purification Kit (Epicentre) according to the manual. The complementary DNA were synthesized from 5 μg of total RNA using SuperScript IV Reverse Transcriptase (Invitrogen) and random hexamers according to the manual. The RNA expression analyses were performed using the Power SYBR Green PCR Master Mix (Applied Biosystems) and QuantStudio 12K Flex Real-Time PCR System (Applied Biosystems) with gene-specific primers (Table S1). The expression levels of the
effector genes were determined by normalizing to the U-box housekeeping gene (ubiquitin (UBQ), At5g15400) (Nemhauser et al. 2004). The primer sequence for UBQ used in Sugio et al. 2011 were used for Real-Time PCR in this study (Table S2).
Results and Discussion
1. BGWL phytoplasma diseased plant observation, collection, and confirmation
1.1. Field disease detection
According to several disease reports (Chen et al. 1972; Dafalla and Cousin 1988;
Marcone et al. 2004), the characteristic BGWL phytoplasmal (‘Ca. P. cynodontis’) infected symptoms on bermudagrass (Cynodon dactylon) includes extensively chlorosis (white leaf), small leaf, shortened internode, and axillary shoot proliferation (witches’-broom). The white leaf symptom makes the diseased plants easy to be discovered and distinguished from the green healthy plants. The BGWL diseased plant found at several places, including the GY2015 isolate collected for whole genome sequencing, show the symptoms list above (Fig.
2). Apart from the strain GY2015 collected from Guanyin (Fig. 2A), BGWL diseased plants were also found on sidewalk in Academia Sinica (中研院大門口停車場人行道) (Fig. 2B), the lawn next to Drunken Moon Lake (醉月湖旁草地) in NTU (Fig. 2C), the lawn beside agriculture exhibition hall in NTU (農業陳列館旁草地) (data not shown), the lawn in front of the main library in NTU (振興草坪) (Fig. 2D), the lawn on the green and the path in North Bay Golf & Country Club (北海高爾夫球場的果嶺草皮及小徑旁的雜草) (Fig. 2E, 2F), the lawn on the green in Taipei Golf Club (台北球場的果嶺草皮) (Fig. 2G), the meadow at Huajiang Wild Duck Nature Park (華江雁鴨自然公園) (Fig. 2H), and the lawn at Dulan Cape Café in Taitung ( 台東都蘭海角咖啡草坪 ) (Fig. 2I). For diseased samples from Guanyin beach, NTU main library, and two golf courses are confirmed BGWL phytoplasma infection by 16S rDNA PCR (see below for more information). Other diseased plants showing BGWL symptoms were only suspected to be infected by BGWL phytoplasma
without any molecular biology confirmation. The diseased and healthy plant shown in Fig. 2J were harvest from the same place as in Fig. 2D. The diseased plants showed white leaf and shortened internodes symptom comparing to the healthy plant. Also, the leaves of the diseased plant are more likely to exhibit symptoms of necrosis or dieback compared to healthy plants. The white leaf symptom is occurring from the shoot tip, the upper and younger leaves, to the lower and older leaves. The cuticle covering the epidermis of leaves appears to be lost on the newly emerged white leaves, which may result in lower resistant to light, heat, and drought stress. The white leaves (actually light yellow-green) of the diseased plant, having a greater reflectance at wavelength corresponding to yellow color compared to healthy plant, may be more attractive to insect vector for feeding or laying eggs (Orlovskis 2015). The thinner surface cuticle and juicier leaves could also facilitate the sap feeding insect for haustorium injection. To test these hypotheses, further experiments on leaf surface microscopy observation, leaf wavelength reflectance test, and insect vector behavior studies would be required.
1.2. Microscopy observation on chloroplast morphology
Given the chlorosis symptom of BGWL, we can surmise that the chloroplast of the diseased plant might be confronted with some damages. Therefore, we expect to detect chloroplast morphology changes by microscopy observation. The fresh leaf sample of bermudagrass collected from the lawn in front of the main library in NTU was used for confocal microscopy observation. The diseased plant was confirmed BGWL phytoplasma infection by 16S rDNA PCR (see below for more information). Shown in Fig. 3 is the horizontal view of the flattened leaves without any fixation, staining or dissection. The most obvious difference between healthy and diseased plant is the amount and density of the chloroplast autofluorescence (the red dots). Bermudagrass is a C4 species that has larger and more chloroplasts in the bundle sheath surrounding by the vascular than in the mesophyll
cells. The red chloroplast autofluorescence in the bundle sheath of the white leaf is sparser and weaker comparing to the green healthy leaf, and could barely be seen in the mesophyll area. This indicates that the chloroplast in the diseased plant must be damaged and influenced on both its functionality and quantity. However, there are some unresolved questions: What were the defects of these chloroplasts? Did the chloroplasts have dysplasia issue? Did they retrograde to proplastid? Had they suffered the nutrient lacking stress then turned into senescent chloroplasts? Had they been destroyed by programming death or by other factors such as effector function? To know the answer, we further investigated the morphology of chloroplast by observing the ultra-thin slice sample.
For optical microscopy observation, the sliced and staining (UA in MeOH) leaf vein longitudinal section sample, the same using for TEM observation, was used. In Fig. 4, the bundle sheath cells of the healthy plant are full of chloroplast (50~100% of the volume). In contrast, the chloroplasts were smaller and fewer (<30% of the volume) in the diseased samples. The chloroplast in the mesophyll also has a higher amount in the healthy leaf than in the diseased leave, which is consistent with the confocal observation result. We have not detected any visible difference other than the chloroplast between healthy and diseased sample under optical microscopy observation.
To take a closer look to the morphology of the chloroplast, we observed the leaf vein sample using TEM (Fig. 5). Under the TEM observation, the healthy plant has more and plump chloroplasts in the bundle sheath cells with smaller starch granules or none. The chloroplast showed crescent or spindle shape. The bundle sheath cells are stuffed up by the chloroplasts. On the contrary, comparing to the healthy sample, the diseased sample has leaner, smaller, and odd shaped chloroplast (i.e., hook-shaped or donut-shaped due to the large bending angle, not smooth surface), with larger starch granules. The total chloroplast volume in the bundle sheath cell of the diseased sample is much smaller than in the healthy
sample (most of the space were occupied by a giant vacuole). We also counted the chloroplast number in each bundle sheath cell (Fig. 6). For healthy plant, there are approximately seven chloroplasts in one bundle sheath cell, while in diseased sample there are only five (22 and 23 cells were counted, the P value in t-test is < 0.001). At the same time, we found many irregular shaped chloroplasts with many large starch granules inside and very few (or invisible) thylakoids, which are possibly the senescing chloroplasts. The numbers of starch granules per chloroplast between healthy and diseased plant has no significant difference (data not shown). According to these observations, we hypothesize that the chloroplasts in the disease plant are undergoing a senescing process, because we did not find any proplastid presenting in the bundle sheath. This could be proved if we could observe the chloroplast during the whole process from the beginning of the infection. However, a main challenge for such experiment is the controlled infection system of healthy bermudagrass, which involves rearing and infection of suitable insect vectors.
1.3. Chlorophyll fluorescence and content measurement
To connect the chlorosis symptom with the physiological function of chlorophyll, we quantified the chlorophyll fluorescence and content. The plant samples used for confocal microscopy observation were also used here (different leaves from the same plant). Shown in Fig. 7A and 7B are chlorophyll fluorescence for healthy and diseased leaf samples. Fo is the minimal fluorescence in dark, Fm is the maximum fluorescence in dark, and Fv=Fm-Fo. The Fm and Fo values from each of four diseased plants are all lower than the values from each of two healthy plants (Fig. 7A). The average of Fv of healthy plants is almost twice as high as the average of Fv of diseased plants (Fig. 7B), indicating that the potential yield from photosynthesis in diseased plant is much lower than in healthy plant. However, the estimated maximum quantum yields (Fv/Fm) of the photochemistry from photosystem II (PSII) for healthy and diseased samples are both around 0.8 with no significant difference, suggesting
that although the potential yield is lower, the efficiency of PSII in diseased plant doesn’t decrease at a serious level. In addition, we also measure the chlorophyll content (chlorophyll A and B) using the same plant sample. Shown in Fig. 7C is the chloroplast content measurement result. Not surprisingly, the chloroplast content in diseased plant is ten times lower than in healthy plant, appearing white leaf symptom of diseased plant.
1.4. Confirmation of phytoplasma by 16S rDNA PCR
The P1/P7 phytoplasma 16S region specific primers were used for diseased samples confirmation by PCR. We got one single band, with approximately 1.8 kb in size, from all BGWL samples (Fig. 8), while no signal was detected in any of the healthy plant samples (data not shown). The PCR product were then sequenced and used for BLASTn search (see materials and methods for more information). The top 10 hits of the BLAST result are all BGWL associated phytoplasmas. For sample GY2015, there are only six bases mismatch and no gap out of 1,723 bp (99% identities for GY2015 and all the other diseased samples) comparing to the reference sequence BGWL-C1 (accession number: AJ550984, Italian strain).
The 16S region of all disease sample contains the BGWL unique signature sequence (5′- AATTAGAAGGCATCTTTTAAT-3′) that mentioned in Marcone et al. 2004. Therefore, the phytoplasma species in the diseased plant samples from Guanyin beach, NTU main library, and two golf courses were all confirmed as ‘Ca. P. cynodontis’.
1.5. Confirmation of phytoplasma by TEM observation
The leaf midvein samples of both green and white leaves from Guanyin beach were used for TEM observation. As shown in Fig. 9, large amount of phytoplasma cells in the sieve element were detected, consistent with the previous study (Dafalla and Cousin 1988).
The phytoplasma cell has one thin layer cell membrane with no cell wall. The DNA filament in the cell is clear to see. The cell shape and size are various. Because of their amorphous
property, phytoplasma cells could pass through the sieve plate by squeezing through the sieve plate pores (the enlarge image in Fig. 9). Most of the phytoplasma cells were assembled near by the sieve plates, while some of the sieve elements were found to be crammed with phytoplasma cells. This would result in a bad conveyance quality of the nutrient by phloem because the nutrient in the sieve element were utilized by the huge amount of phytoplasmas and also because of the blockage of phloem flow by phytoplasma cells. The shortage of nutrient in the phloem would end up forcing the insect vector to stop feeding and leave the disease plant, then they will move on to other new healthy plant host to feed and spread the phytoplasma that they have carried inside their salivary glands. As a result, this promote the dissemination of phytoplasma (Orlovskis et al. 2015).
2. Comparative genomics analysis of phytoplasmas 2.1. BGWL phytoplasma genome assembly
The draft genome sequence that we obtained from the de novo assembly consists of five contigs (combines length 502,218 bp) (Table 2). The longest one corresponds to the chromosome (contig1: 492,320 bp, cov = ~578 X). We were unable to determine the complete sequence of this circular chromosome because both ends of this contig are consisted of respective sequences and our efforts for gap closure by PCR were unsuccessful after several attempts (more details below). The other four contigs are likely to be plasmids based on their gene content and high sequencing coverage (contig2: 3,648 bp, cov = ~13,704 X;
contig3: 2,306 bp, cov = ~17,323 X; contig4: 2,094 bp, cov = ~12,849 X; contig5: 1,850 bp, cov = ~14,777 X, respectively). The total raw reads number got from NGS is 15.5 Gb, but only 2.76% of the raw reads could be mapped on the phytoplasma DNA sequence. The average coverage of the assembly is ~854X, thus is sufficient for the de novo Velvet assembly (50X depth was recommended in Zerbino and Birney 2008). 47.5% of the
unmapped reads belong to chloroplast (Huang et al. 2017) while the remaining ones are likely corresponding to the mitochondria and the nuclear genomes of the bermudagrass.
For this draft assembly of BGWL phytoplasma, the overall G+C content is 21.1%
(21.0% for chromosomal contig). The GC content is particularly high in the regions of PMU (see below for more information) and rRNA operon. The genome contains 425 of protein- coding genes (413 for chromosomal contig), 23 tRNA genes and two sets of rRNA operons.
Comparing to the predicted chromosome size (530 kb) by PFGE in Marcone et al. 1999, the chromosomal contig is covering approximately 93% of the whole chromosome (Fig. 10). The chromosome contains two identical rRNA operon (show no SNP and confirmed by primer walking sequencing), but lacking seven tRNA gene out of all essential 20 tRNAs for 20 basic amino acids transferation (Table S3). The rest of them maybe missing because of the incomplete assembly. Why does the assembly not complete? The noise of the plant host and chloroplast DNA would be one of the reason because the phytoplasma could not be pure culture outside their host, thus has to be sequenced along with the host genome. Another reason is, as shown in Fig. 11, the BWA reads mapping result viewing by IGV, the two edges of the chromosomal contig were bonded with a same 108 bp continuously non-perfect repeat sequence. According to the coverage and the reads sequences of the repeat regions, the 108 bp fragment would at least repeat for more than three times so that the 301 bp paired-end reads couldn’t cross over it. We have tried long range PCR for several times to ensure that the two ends of the chromosomal contig would be connected to form a circular contig. The product size was expected to be 37 kb long if the PFGE prediction was right, but we have not obtained any band from the PCR and agarose gel electrophoresis (data not shown). Thus, we would use this assembly version for further genome comparative analysis. However, there is another possibility: the chromosome of BGWL phytoplasma is also linear as the case observed for ‘Ca. P. mali’ AT (Kube et al. 2008). Their chromosomes are both smaller than