科技部補助專題研究計畫成果報告
期末報告
植物跨膜錨蛋白在根際毒性逆境扮演之角色
計 畫 類 別 : 個別型計畫
計 畫 編 號 : MOST 105-2311-B-006-005- 執 行 期 間 : 105年08月01日至106年07月31日 執 行 單 位 : 國立成功大學生命科學系
計 畫 主 持 人 : 黃浩仁
計畫參與人員: 碩士班研究生-兼任助理:曾子耘 大專生-兼任助理:吳佩璇
博士班研究生-兼任助理:林崇文
中 華 民 國 106 年 11 月 08 日
中 文 摘 要 : 為找出植物在不同環境逆境下共通性表現基因,在此透過綜合水稻 受三種不同根際毒物處理後之轉錄體資料,找出迅速而短暫性表現 (ET)、迅速且持續性表現 (EC) 以及延遲性表現基因群 (DL)。ET 基因群包含較多訊息傳遞及植物荷爾蒙相關基因,EC 基因群中防禦 及解毒相關基因為主要類群,而 DL 基因群主要為解毒及脂質代謝 相關基因。由調控網絡分析得知此共通性調控基因裡, PP2C68、
MPK5、LRR-RLK 與 NPR1 為主要基因,與其他基因之間有較高的關 聯性,其中 NPR1 帶有 ankyrin repeat 區域,研究指出其為水楊 酸受器,在此屬於 ET 基因類群。透過基因結構分析顯示有 4 個顯 著的轉錄因子辨識順式因子出現在共通性表現基因的啟動子區域裡
,其中 2 個新穎的順式因子位於 DL 基因群起動子區域。此外 ET 基因群帶有較多的 exon、較短的第一段 exon 及較長的 cDNA 序列
。由分析其他基因表現調控因子得知,ET 基因群啟動子的 CpG island 比例及第一段 intron 的 IMEter 分數均較 EC 及 DL 基因 群高。而 EC 基因群則具有較高的 Ka/Ks 比值,顯示其具備較快的 演化速度。這些結果可以提供研究人員判斷植物受不同環境逆境影 響時,會利用何種類群基因與帶有何種基因特性的因子調控自身因 應環境逆境之機制。
中 文 關 鍵 詞 : 基因結構, 網絡因子分析, 快速演化, 水稻, 逆境反應的動態時間 調控
英 文 摘 要 : To identify the similarities among responses to diverse environmental stresses, we analyzed the transcriptome response of rice roots to three rhizotoxic perturbations (chromium, ferulic acid and mercury) and identified common early-transient, early-constant and delayed gene
inductions. Common early response genes were mostly associated with signal transduction and hormones, and delayed response genes with lipid metabolism. Network component analysis revealed complicated interactions among common genes, the most highly connected signaling hubs being PP2C68, MPK5, LRR-RLK and NPR1. Gene architecture studies revealed different conserved promoter motifs and a different ratio of CpG island distribution between early and delayed genes. In addition, early-transient genes had more exons and a shorter first exon. IMEter was used to calculate the transcription regulation effects of introns, with greater effects for the first introns of early-
transient than delayed genes. The higher Ka/Ks (non- synonymous/ synonymous mutation) ratio of early-constant genes than early-transient, delayed and the genome median demonstrates the rapid evolution of early-constant genes.
Our results suggest that finely tuned transcriptional
control in response to environmental stress in rice depends on genomic architecture and signal intensity and duration.
英 文 關 鍵 詞 : Gene structure, Network component analysis, Rapid
evolution, Rice, Temporal dynamics of stress response
Abstract
To identify the similarities among responses to diverse environmental stresses, we analyzed the transcriptome response of rice roots to three rhizotoxic perturbations (chromium, ferulic acid, and mercury) and identified common early-transient, early-constant, and delayed gene inductions. Common early-response genes were mostly associated with signal transduction and hormones and delayed-response genes with lipid metabolism. Network component analysis revealed complicated interactions among common genes, the most highly connected signalling hubs being PP2C68, MPK5, LRR-RLK, and NPR1. Gene architecture studies revealed different conserved promoter motifs and different ratio of CpG island distribution between early and delayed genes. In addition, early-transient genes had more exons and a shorter first exon. IMEter was used to calculate the transcription regulation effects of introns, with greater effects for the first introns of early-transient than delayed genes. The higher Ka/Ks ratio of early-constant genes than early-transient, delayed, and the genome median demonstrate the rapid evolution of early-constant genes. Our results suggest that finely tuned transcriptional control in response to environmental stress in rice depends on genomic architecture and signal intensity and duration.
Introduction
The growth of plants is sessile and plants cannot escape a stressful physical environment such as cold, heat, drought, heavy metal, and interactions with insects or microorganisms such as fungi and bacteria. To survive, plants have adapted specific acclimation and adaptation mechanisms to respond to these environmental stresses, such as using hormones as signal and regulator components against stresses (Peleg and Blumwald, 2011) or controlling the membrane transporter system to maintain cellular homeostasis (Conde et al., 2011). The commonly accepted stress concept in the mammalian system is called the “general adaptation syndrome” (reviewed by Kanner et al., (Kranner et al., 2010)), which is divided into three states
— alarm, resistance, and exhaustion — depending on the stress concentration and exposure period. The molecular level of these states is considered signal transduction, transcriptional and translational modifications, secondary messenger production, DNA damage, and protein degradation.
Under stresses, the transcriptional program rewires to adapt to environmental stimuli. The adaptation strategy living organisms use for different individual stresses consists of both
“common” and “unique” response. Common responses refer to molecular responses initiated with all different stresses. The discovery of common stress-response genes in different organisms depends on large-scale analysis of transcriptional change under various types of environmental stress. In plants, the common environmental stress-response pathways and components may guard cells or organisms against multiple individual stresses (Pastori and Foyer, 2002). Under environmental stresses, the early stress-response genes had been investigated (Kiyosue et al, 1994; Yamaguchi-Shinozaki and Shinozaki, 1994). Zhu et al. (2002) reported that stress-response genes can separate into early- and late-responsive according to regulated timing. The early-response genes are mostly associated with the initial stress protection and repair, corresponding to the “alarm”, and the late-response genes are involved in stress acclimation, corresponding to “adaptation” (Buitink et al., 2006; Yang et al., 2014).
Many of the well-characterized early-responsive genes encode transcription factors that regulate downstream stress-response genes. Late-response genes are involved in protein synthesis. However, in contrast to extensive studies in the living organisms researching common stress responses, the molecular mechanism of the kinetic induction of stress-response genes in plants is largely unknown.
System-wide exploration of data obtained at different molecular levels can be used to understand the stress-adaptation processes of plants. Recently, numerous approaches have been developed to predict protein function and characterize gene regulatory networks based on co- expression and protein interaction data. Previous studies have investigated the molecular networks involved in different environmental stresses. Proteins involved in Phaseolus vulgaris L. drought tolerance mechanisms were shown by the proteomic study and protein interaction network (Zadražnik et al., 2013). The role of phytohormone-related genes in plant immunity was revealed in the integrative network analysis of Arabidopsis with Golovinomyces orontii and Botrytis cinerea infection (Jiang et al., 2016). However, no study has addressed the candidate key regulators of rice under short- or long-term stimulation with different environmental stresses.
Rapid induction of stress-response genes is important for optimal survival after stress.
Temporal dynamics in transcriptional regulation is mainly controlled by gene promoters and their contributing cis-elements (Zou et al., 2011). Individual regulatory motifs in promoters obey positional constraints by the number, order, and sometimes distance between the motifs for the expression pattern (Mohanty et al., 2012). The exon-intron organization of eukaryotic genes and the splicing machinery is fascinating in light of the newly uncovered roles introns play in controlling gene expression. Introns have an enhancing effect on gene expression, known as intron-mediated enhancement (IME), in diverse organisms, including plants (Rose and Beliakoff, 2000). In 1988, Brinster et al. found that transgenes lacking introns were poorly expressed as compared with those with introns (Brinster et al., 1988), and the removal of introns from endogenous genes could markedly reduce transcription (Furger et al., 2002). In addition, the motif within the first intron was examined as an enhancer (Liu et al., 2000).
In this study, we used global expression profiling to analyze the common transcription alterations induced by three individual environmental stresses to rice roots: chromium (Cr), ferulic acid (FA), and mercury (Hg) exposure. Functional differentiation genes were identified as early-transient (ET), early-constant (EC), and delayed (DL) response events. We show the candidate key regulators by network component analysis (NCA). Early transcriptional induction of transient and constant response genes led to several unique characteristics, including over-representation of shared transcription-factor binding sites, long transcripts with more exons, and shorter first exons. Conversely, delayed-response genes showed contrasting features. In addition, we analyzed the transcriptional regulation of the first intron of the early- and delayed-response genes and deciphered the evolution rate of these genes. These findings may be a foundation for elucidating the response of rice under temporal dynamics of environmental stresses.
Result
Combining different microarray data revealed common stress-response genes
To identify the genes regulated by stress under different environmental stimulations, we used microarray data for rice seedlings treated with Cr, FA, and Hg for the short-term (1+3 h) and long-term (24 h). After data were normalized by using GeneSpring v12 (Invitrogen, USA) and duplicate loci were excluded according to p and FDR values, we identified 1,803 early- (1+3 h) and 1,774 delayed-induced (24 h) genes under Cr stimulation, 1,757 early- and 577 delayed- induced genes under FA stimulation, and 2,619 early- and 2,006 delayed-induced genes under Hg stimulation. There were 1,049 shared early-induced genes and 331 shared delayed-induced genes under these stress stimulations.
Gene expression profiles of these microarray data were analyzed using WGCNA (Langfelder and Horvath, 2008) in order to identify gene co-expression patterns that might tightly co- regulated (modules) with early or delayed stresses stimulation. WGCNA is one of the most robust methods for construction of undirected networks in an unsupervised manner (Allen et al., 2012). It helps to reduce the complexity of large and multivariate datasets by grouping functionally related genes into modules. After filtering, 15,246 probes were used for WGCNA analysis. Briefly, modules were defined as branches of the dendrogram obtained from clustering and labelled by colours beneath the dendrogram. After setting a minimum module size of 30 and merging modules with highly correlated eigengenes, a total of 15 modules were found (Figure 1A and B). To determine if any of the 15 modules of co-expressed genes were associated with the observed differences in different time points under stresses stimulation, we tested the correlations of the module eigengenes with the time-point trait. Three modules were found significant at the defined cut-offs (Bonferroni correction, significance threshold = 0.05).
Of these, the blue module showed positive correlation with the time-point trait, while the brown and sienna3 modules showed negative correlation (Figure 1B). The gene expression profiles of genes within the three modules indicated that genes within the blue module were specifically early-induced under stress stimulations, and genes within the brown and sienna3 modules were specifically delayed-induced (Figure 1C). The module membership (MM) versus gene significance (GS) plots for these modules (Figure 1D) showed that MM and GS are significantly correlated in blue and brown modules, indicating that genes most significantly associated with the time-point trait are often also the most important elements of the respective modules. In the metabolic pathway analysis by KEGG database (Kanehisa and Goto, 2000), the blue module was mainly enriched in “plant hormone signal transduction”, the brown module was enriched in “ribosome biogenesis in eukaryotes”, and the sienna3 module was mainly enriched in “cutin, suberine and wax biosynthesis” pathway (Figure 1E).
To distinguish early- from delayed-response genes, we further characterized the expression patterns of the induced genes as early-transient (ET; significantly upregulated at 1+3 h [i.e., ≥ 2-fold] and then downregulated at 24 h [i.e., ≤ 1.4-fold]); early-constant (EC; significantly upregulated at both 1+3 and 24 h); and delayed (DL; significantly upregulated at 24 h only).
For genes with significantly changed expression under Cr treatment, most were associated with an EC event (1,032 genes, 50.1%), then DL event (522 genes, 25.3%) and ET event (508 genes, 24.6%). In addition, genes regulated by FA were mostly associated with an EC event (1,069 genes, 67.7%), and only 10.0% genes showed DL responses. Under Hg stimulation, we found less difference between ET and EC events (39.1% and 36.4% genes, respectively).
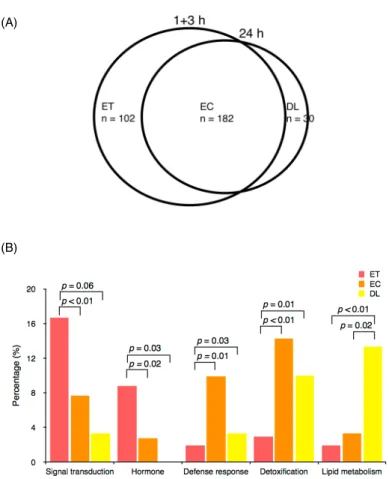
Numerous genes responded to not just a single treatment but were also regulated differentially under several conditions. We combined these microarray data to identify the common stress- response genes, for ET, EC, or DL events, under all stress treatments. We found 102 common stress-response genes for ET events, 182 for EC events, and 30 for DL events (Figure 2A). The ratio of common stress-response genes for ET, EC, and DL events in the shared early- and delayed-induced genes was 5%, 10%, and 3%, respectively. In total, 98 of 102 ET genes, 166 of 182 EC genes, and 29 of 30 DL genes had corresponding locus IDs in the databases Michigan State University Rice Genome Annotation (MSU, [http://rice.plantbiology.msu.edu]).
Identification of common early and delayed stress-response genes
To investigate the relationship between gene expression patterns and gene functions, the common stress-response genes were classified into 14 categories according to the rice Genome Annotation Project [http://rice.plantbiology.msu.edu], Gene Ontology (GO)
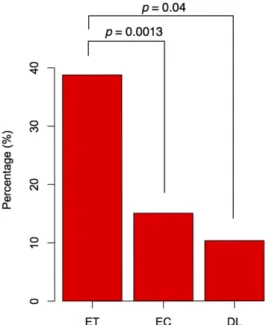
[http://geneontology.org], Uniprot [http://www.uniprot.org], and rice Pathways [http://pathway.gramene.org/rice/class-tree?object=Pathways]. Significant functional categories for genes showing ET events were signal transduction (16.7%) and hormones (8.8%) (Figure 2B). Most of the signal transduction-associated common stress-response genes were early induced, 52% (n = 17) with a transient expression pattern and 45% (n = 15) a constant pattern.
These common early signal transduction-related genes included several mitogen-activated protein kinases (MAPKs), calcium-dependent protein kinases (CDPKs), calmodulin, and protein phosphatases. MPK5, MEKK62, MEKK70, and CPK4 exhibited ET events. Only a calmodulin-related gene showed a DL event. In addition, we found two ACS, ethylene biosynthesis-associated genes (LOC_Os03g51740 and LOC_Os04g48850) and one GA- deactivating gene (LOC_Os02g41954, GA2ox7) significantly induced by all three stresses, with an ET expression pattern. Genes with EC events were enriched in defense response (10%) and detoxification (12.6%) (Figure 2B). The defense-response category is represented by disease-resistance protein, dehydrogenase, and acetyltransferase. The GST, UDP, and cytochrome P450-related genes were classified in the detoxification category. On analyzing genes with DL events, lipid metabolism (13.3%) was the most enriched category (Figure 2B), which included glycerol-3-phosphate acyltransferase (GPAT), alcohol-forming fatty acyl-CoA reductase (alcohol-forming FAR), very-long-chain 3-oxoacyl-CoA reductase (KCR) and GDSL esterase/lipase proteins (GELPs).
Network component analysis of the common stress response genes
Coexpression or coregulation of genes may implicate them in similar biological processes, and network component analysis (NCA) provides clues for establishing the putative biological functional relationship of genes. To gain insight into the common stress response of rice, we used the STRING system [http://string-db.org], which functionally links proteins based on predictions, neighborhood analysis, experimental results, and literature mining. The protein- protein interaction network was visualized with the common stress-regulated genes. After removing proteins without connections, we identified the most relevant proteins that might play a role in protein-protein interaction (Figure 3). The major interaction network revealed the ET gene set highly connected with the EC gene set. The signalling hub proteins with greater than or equal to 10 interactions were PP2C68 (LOC_Os09g15670; 17 interactions), MPK5 (LOC_Os03g17700; 13 interactions), LRR-RLK (LOC_Os01g49920; 12 interactions), and NPR1 (LOC_Os01g09800; 10 interactions). PP2C68, MPK5, LRR-RLK, and NPR1 were associated with the ET gene set. These hub genes might play important roles in the common early stress response in rice.
Analysis of promoter region of early and delayed common stress-response genes
The different kinetics of induction of early and delayed response genes could arise from a variety of factors, alone or in combination, such as differences in transcriptional regulation and CpG island. To reveal the characteristic features of the promoter of ET, EC, and DL gene sets, we used sequences of upstream regions of genes to examine the presence of cis-elements by using a pipeline of motif-search and validation tools, specifically, a set of tools available in the MEME Suite (multiple expectation maximization for motif elicitation) (Bailey et al., 2006) and
the findMotif program in the UCSC Genome Browser
[http://hgdownload.soe.ucsc.edu/admin/exe/]. First, MEME was used for a primary search of 1 kb upstream of these genes. Second, TOMTOM defined whether these motifs were already known cis-elements. Third, the findMotif program was used for manually determining whether the identified motifs appeared in the other gene sets. Fourth, the PLACE database was used to
further confirm whether these motifs had been revealed. The motif query range in MEME was 6 to 9 bp, and only those with statistical significance (p < 0.01) were considered. We found 1 unique motif significantly enriched among the ET gene set (CSCRCSCGC) and 3 motifs enriched among the DL gene set (GCAWGCA, SWGCADGC, and KGCCKYGC) (Table 1).
The motifs with < 20% enrichment occurrence in individual categories were excluded. No significantly enriched motif was unique in the EC gene set.
Two motifs (CSCRCSCGC and KGCCKYGC) were matched with previously identified cis- elements, and the remaining 2 (GCAWGCA and SWGCADGC) were novel, with unknown biological functions. CSCRCSCGC was significantly enriched in the ET gene set (p = 0.0027), identified as the DREB2C motif (p = 0.0079). Overall, 23.5% of ET genes had the CSCRCSCGC motif in their promoter regions, but only 8.4% and 6.9% of the EC and DL gene sets, respectively. Eleven of 39 ET genes which were interacted with other genes were found with CSCRCSCGC motif. In the DL gene set, one of the enriched motifs with known biological function was KGCCKYGC, identified as the SPL7 motif. We identified two DL gene sets enriched novel cis-elements, GCAWGCA and SWGCADGC. The distribution of the GCAWGCA motif in ET, EC, and DL gene sets was 51.0%, 47.0%, and 89.7%, respectively, and that of the SWGCADGC motif in ET, EC, and DL gene sets 27.5%, 25.9%, and 82.8%, respectively. Interestingly, 16 DL genes which were interacted with other genes had GCAWGCA, SWGCADGC, or KGCCKYGC motifs. In total, 26 and 13 of the 29 DL genes had at least 1 or 2 copies of the GCAWGCA motif, and 24 and 3 of the 29 DL genes had at least 1 or 2 copies of the SWGCADGC motif.
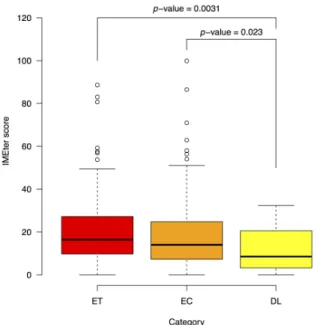
To identify the distribution of CpG islands in the promoter region of the ET, EC, and DL gene sets, we used the command-line version of CpG island searcher (Takai and Jones, 2003). The ET gene set contained 38 genes (38.8%) with a CpG island (Figure 4), but the EC and DL sets contained only 15% and 10% of genes, respectively, with a CpG island, for a higher ratio of CpG islands in the promoter regions of the ET gene set than other gene sets. The higher ratio of CpG island was also observed in the ET gene set of network component analysis. Eighteen of 39 ET genes which were interacted between genes set were found with CpG island.
Different mechanisms of post-transcriptional regulation of early and delayed common stress- response genes
Other differences in transcriptional processing might be used to analyze ET, EC and/or DL events in mRNA formation. Here, we analyzed features that might affect rates of transcription or mRNA processing, including exon/intron distribution, exon/intron length, and transcript length. Gene structure information was obtained from the GFF3 file of the MSU rice genome project, and the longest transcript was used for the locus in microarray assay. The architectures of ET and DL genes that differed from the reference genome were mean exon count, intron count, first exon length, total intron length, and cDNA length (Table 2). When investigating the diversity between ET, EC, and DL and the reference genome, exon and/or intron count, first exon length, and cDNA length significantly differed between EC and DL gene sets and the whole genome. To compare the architecture of the common stress-response gene sets in monocot and dicot, we used the microarray data from the Arabidopsis AtGenExpress project (Kilian et al., 2007). Genes with ≥ 2-fold change at 1+3 h stress treatment and 1.4-fold change at 24 h were defined as early, and 1.4-fold change at 1+3 h and ≥ 2-fold change at 24 h were defined as delayed. There were 78 early and 112 delayed common stress-response genes identified in at least six out of nine microarray datasets. As the common-stress response genes of rice, the early genes of Arabidopsis were with long transcripts, more exons, and shorter first exons than delayed genes.
To further validate the variation in rice gene structure under environmental stress, we extracted total RNA from rice roots under Hg treatment and sequenced the poly-A mRNA with RNA- seq technology. The raw reads were assembled by using Tophat and Cufflinks. The mean exon count was higher for transcripts showing an ET than a DL event (5.78 vs 2.11), which was similar to microarray results (Table 3). As well, the length of the first exon and cDNA from RNA-seq results were the same as for microarray results.
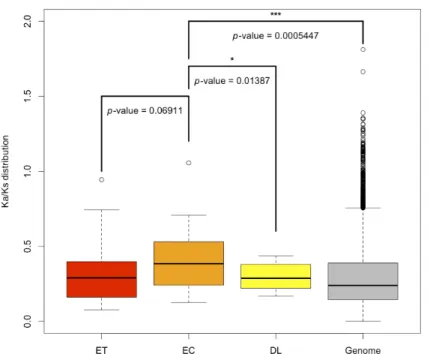
Introns have largely positive effects on gene expression (reviewed by Rose and Beliakoff (Rose and Beliakoff, 2000)). IMEter has been used to measure intron-mediated element (IME) signals (Parra et al., 2011). The higher the score for an intron indicates a higher probability that the intron enhances expression. Here, we calculated IME scores for the first intron sequences. For genes with only 1 intron, we found no difference between ET and EC and DL genes. For genes with ≥ 2 introns, the IME score was higher for genes with an ET than DL expression pattern (Figure 5). Therefore, the enhancer effect may be greater for the first intron of ET than DL genes. Interestingly, the mean IMEter score of the first intron of the early common-stress regulated genes of Arabidopsis was higher than the delayed genes.
Evolutionary rate between early and delayed genes
Evolutionary rates vary among genes, but the underlying causes of rate variation remain unclear. To investigate the conserved mechanism of common stress response in plants, the synonymous and nonsynonymous substitution ratio (Ka/Ks) between rice and maize orthologues were estimated by using the KaKs_calculator (Zhang et al., 2006). The list of maize and rice orthologues was obtained from the Wang et al. study (Wang et al., 2014). The Ka/Ks ratios for ET, EC, and DL gene sets are shown in Figure 6. Distributions of Ka/Ks for ET, EC, and DL gene sets ranged from 0.077 to 0.944, 0.125 to 1.056, and 0.167 to 0.437, respectively. The Ka/Ks ratios for rice and maize genome were also estimated. For ET, EC, and DL gene sets, the Ka/Ks ratios were slightly higher than the genome median. Of note, the Ka/Ks ratios were higher for the EC than DL gene set and the genome median (Student's t test, p = 0.0139 and 0.0005, respectively), which suggests a faster rate of evolution for the EC gene set.
Discussion
In Arabidopsis, several reports had identified the massive temporal and spatial changes in transcriptome composition under salt, osmotic, cold, heat, high-light, flagellin, and abscisic acid (ABA) stimulation (Kilian et al., 2007; Kreps et al., 2002). Shan et al. had used high- throughput sequencing to reveal gene responses under cold, salt, and drought in maize (Shan et al., 2013). These studies found various genes induced by different stress treatments; however, few studies investigated common stress responses. In this study, we undertook a comprehensive global analysis of time periods of gene induction after environmental stress stimulation of rice seedlings. We revealed the induction of common stress-response genes with rhizotoxin stimulation (Cr, FA, and Hg) grouped by early-transient (ET), early-constant (EC), and delayed (DL) genes. During the ET phase of the stress response (1+3 h), about 5% of upregulated genes were induced with all three stresses. By the DL phase (24 h), only about 3%
of upregulated genes were induced with all three stresses. Previous study reported that 6.7%
and 0.4% of genes showed shared upregulation in Arabidopsis under cold, salt, and mannitol treatment for 3 and 27 h, respectively (Kreps et al., 2002). The pattern for shared stress- response genes under short- and long-term stimulation showed similar trends between rice and Arabidopsis. Plants may use more common genes under short- than long-term environmental stress.
Under short-term stress, signal transduction and hormone-related genes were significantly enriched in the ET gene set (Figure 2). In animals, acute stresses will put cells in risk, and rapid adaptation is critically required for maximizing survival (de Nadal et al., 2011). In Caenorhabditis elegans, two early-response signalling-associated genes were found to have essential roles in biotic stress resistance, whereas loss-of-function mutants had a shorter life cycle on pathogen infection (Kim et al., 2002). Signal molecules, such as mitogen-activated protein kinases (MPK4 and Naf3) and calcium-dependent protein kinases (CDPK2, CDPK4, and CDPK5), would be rapidly regulated under environmental stresses (Ludwig et al., 2005;
Wu et al., 2007). Previous study indicated that MAPK cascade-associated genes were regulated in common under 10 differential stresses in Arabidopsis (Rasmussen et al., 2013). Here we discovered the conservation of stress-response MAPKs (MPK5, MEKK7, MEKK62, and MEKK70) and CDPK (CPK4) in rice. These results provide further evidence for the conservation during evolution of an early-alarm signal between different species. Plant hormones play an important role in divergent fields such as growth, signal transduction, and stress defense. Ethylene and GA have been reported to respond to environmental stresses (Colebrook et al., 2014; Wang et al., 2002). Here we found two ACS, ethylene biosynthesis- associated genes (LOC_Os03g51740 and LOC_Os04g48850) and one GA-deactivating gene (LOC_Os02g41954, GA2ox7) significantly induced by all three stresses, with an ET expression pattern, so ethylene and GA might play a role as a common early alarm signal of environmental stress in rice. Under long-term stress (i.e., DL gene set), the most enriched category was lipid metabolism. GPAT, alcohol-forming FAR, and KCR were found only in the DL but not the ET or EC gene set. GPAT is associated with plant cutin biosynthesis (Li et al., 2007). FAR and KCR are involved in the biosynthesis of wax (Kunst and Samuels, 2009).
The cuticle in plant, mainly composed of cutin, suberin, and wax, is a hydrophobic layer that covers the aerial surfaces of the plant and forms the first line of contact with the environment.
Recent discoveries demonstrate more direct roles for cuticles in various models of protective barriers against biotic and abiotic stresses (Shepherd and Wynne Griffiths, 2006; Yeats and Rose, 2013). In this study, cuticle formation-related genes GPAT, FAR, and KCR had a DL expression pattern, which further suggests the stress adaptation role of the DL gene set.
Highly connected genes in a network, or hubs, tend to play essential roles in biological processes (Jeong et al., 2001). Here we reported that PP2C68, MPK5, LRR-RLK, and NPR1 are the top four hub genes in a common stress-response network, which indicates their key roles in modulating the early stress response. A study of MAPK signalling in regulating the general stress response in plants indicated that a loss-of-function mutant of MEKK1 showed an accelerate peak time of response and an elevated basal rapid stress-response element (Bjornson et al., 2014). The functional analysis of Arabidopsis MPK3, MPK4, and MPK6 demonstrated temporal regulation of the MAPK genes in the early and late stress response triggered by biotic stress (Frei dit Frey et al., 2014). When comparing early and late flg22- induced transcriptional activation, MPK3 (a rice MPK5 ortholog) and MPK4 were found to be master regulators. OsMPK5 positively regulated drought, salt, and cold tolerance of rice, and the gain-of-function mutant of OsMPK5 showed increased tolerance to abiotic stresses (Xiong and Yang, 2003). PP2C was reported as a negative regulator of MAPKs in Arabidopsis, with interactions occurring rapidly after stress treatment (Schweighofer et al., 2007). More recently, upregulation of the pathogen-response genes was potentiated with flg22 treatment in receptor- like kinase (RLK)-overexpression lines (Yeh et al., 2015). In this study, we identified LRR- RLK as a potential membrane-localized protein kinase that may modulate plant early stress- response pathways.
The ankyrin repeat (ANK) protein NPR1 was found to control systemic acquired resistance in Arabidopsis and to be an SA receptor (Cao et al., 1997). In Arabidopsis, NPR1 gene expression is induced by SA (Kinkema et al., 2000). Previous research showed that the rice homologue NPR1 was upregulated under biotic stress (Wei et al., 2013). Here, we reported that the rice homologue NPR1 (NH1) was induced by all three rhizotoxin stresses. Meanwhile, two stress- specific upregulated ANK proteins, NPR2 (LOC_Os01g56200) and NPR3 (LOC_Os03g46440), showed an ET expression pattern. However, NPR2 was upregulated only by Hg treatment, and NPR3 was upregulated by Cr and Hg treatment. Two Arabidopsis NPR1 paralogues, NPR3 and NPR4, functioned as regulators of NPR1 complex formation (Fu et al., 2012). NPR1 might play an important role in the rice response to numerous stresses and cooperate with other NPRs to respond to specific stress stimulation. Further analysis of the highly enriched genes in early-stress-regulated gene sets might provide more clues to their role in common and divergent responses to environmental stress.
Genes with expression regulated by a common upstream transcription factor generally show a significant co-expression pattern in numerous organisms such as humans, yeast, worms, and plants (Ma and Bohnert, 2007; Stuart et al., 2003). Computational comparisons revealed striking differences in the prevalence of predicted binding sites for shared transcription factors in the upstream regions of ET, EC, and DL response genes. Cis-element enrichment analysis of genes in ET and DL gene sets identified two previously characterized cis-elements (CSCRCSCGC and KGCCKYGC), which indicates the reliability of the computational analysis pipeline. The CSCRCSCGC motif was within the ET gene set. Genes within the DL gene set were enriched with the KGCCKYGC motif, identified as an SPL7 binding motif.
CSCRCSCGC is an extended GCGGCCGC motif, a dehydration response element binding (DREB) family motif, DREB2C (Franco-Zorrilla et al., 2014). DREB is one of the major subfamilies of the plant-specific AP2-ERF family transcription factors that play numerous roles in biotic and abiotic stress signalling (Nakano et al., 2006). The DRE element is essential for inducing rd29A gene expression by osmotic stress in Arabidopsis (Yamaguchi-Shinozaki and Shinozaki, 1994). DREs were found to be interdependent under dehydration stress conditions (Narusaka et al., 2003). According to our findings, the early induction of common stress-response genes may be related to the higher prevalence of the DRE motif. The spl7 transgenic rice showed no leaf lesions or delayed development of lesions (Yamanouchi et al., 2002), so spl7 might participate in controlling cell death caused by environmental stresses. Of note, these significantly enriched motifs in DL genes were related to stress acclimation mechanisms. In addition, two novel putative cis-elements, GCAWGCA and SWGCADGC, were specifically enriched in the DL gene set. The high percentage of the cis-element- containing GCA sequences might indicate that it is a novel stress-inducible motif.
In mammals, the ratio of CpG islands is higher in the promoter region of primary than secondary response genes (Ramirez-Carrozzi et al., 2009). Primary response genes are signal responders because their expression is quickly induced with stimulation. The importance of the CpG island in primary response genes was supported by the observations that these CpG islands in vertebrates are strongly associated with transcription initiation (Deaton and Bird, 2011; Illingworth et al., 2010). However, the relationship between CpG island and gene expression in plant was less studied. Here we showed a higher ratio of CpG islands in the promoters of the ET than EC or DL gene set, so rice genes with an ET expression pattern might share a similar architecture with primary response genes in mammals. On the other hand, the enrichment of CpG island in the early-response genes was not found in Arabidopsis. Previous studies reported that monocotyledonous species such as rice are GC rich, whereas they are AT rich in dicotyledonous species such as Arabidopsis (Gardiner-Garden et al., 1992; Rombauts
et al., 2003). Thus, these CpG islands may associated with transcription initiation of the early- response genes in rice but not Arabidopsis.
Our analysis also revealed significant differences between the ET, EC, and DL response genes in primary transcript length, exon/intron frequencies and first-intron-mediated enhancement.
The ET and EC gene sets were similar in transcript length and intron frequency to other genes in the rice genome and contained more and also shorter exons than the DL genes. In plants, highly expressed genes have a large primary transcript and more and longer introns (Ren et al., 2006). However, the profiles of the DL gene set differed. Ren et al. used a mixture of different types of tissues and different time points, such as 21 day-old leaves and roots and SA-treated leaves for 4 and 52 h for Arabidopsis and cold-treated young leaves and roots for 24-h and 60- day-old mature leaves and meristematic tissue for rice (Ren et al., 2006). Here we compared the ET and DL expression patterns for the same genes in the rice transcriptome under environmental stresses. The significantly expressed DL genes might have different gene structure than generally highly expressed genes. Numerous studies identified that the first intron mainly regulates gene expression (Morita et al., 2012; Rose and Beliakoff, 2000).
Although IME determinants are still elusive, several studies have used the algorithm to analyze their findings. Parra et al. reported that genes with higher IMEter score had high expression, and the 5'-end of transcribed regions had the highest IMEter score (Parra et al., 2011). The IMEter had no effect on the efficiency of translation but increased mRNA accumulation in Arabidopsis (Akua and Shaul, 2013). In this study, IMEter scores for the first intron were higher for the ET than DL gene set. Therefore, the impact of the first intron on the temporal dynamics of expression regulation was greater in the ET than DL gene set.
Understanding the factors that contribute to variation in evolutionary rate among genes is a long-standing biological problem. Several studies had been reported that highly expressed genes were evolved slower in yeast and vertebrate system (Drummond et al., 2005;
Subramanian and Kumar, 2004). Yang and Gaut (2011) also found that genes in A. thaliana and A. lyrata with higher expression level tend to evolve slower. Recently, Slotte et al. (2011) showed that genes involved in plant biotic and abiotic stress response were with fast evolution.
However, our understanding of evolution rate variation among temporally regulated gene remains obscure. Previous study reported that rate of protein evolution is positively correlated with developmental timing of expression (Good and Nachman, 2005). Genes expressed late in spermatogenesis were found to evolve fast. In plants, Warren et al. (2010) found that defense response genes are under stronger diversifying selection. Recently, analysis of the different evolutionary rate of Arabidopsis hub genes under pathogen infection showed that fast evolved hub genes are likely to ensure successful defense (Jiang et al., 2016). Here, our natural selection analysis showed greater Ka/Ks ratio for EC than ET and DL genes and the genome median, which suggests that EC genes had rapid evolutionary rate. The higher rate of divergence among EC genes in this study may be due to their role in controlling stress signal information flow.
Importantly, EC genes could be more buffered against unfavorable situations.
In conclusion, this comparative investigation revealed the common stress transcriptome of rice with rhizotoxic induction and the different strategies for rapid reprogramming of these induced genes. The common ET gene set showed more signal transduction and hormone-associated genes, higher ratio of CpG islands in promoter regions, more exons, a shorter first exon, and higher IMEter scores than DL genes. Meanwhile, the common DL gene set showed more lipid metabolism-related genes. Two novel cis-element-containing GCA sequences were identified in the upstream regions of the DL gene set. A notable finding was that EC genes tend to evolve
fast. Further studies of rice mutants with these central signalling hub genes in a common stress- response network will be helpful to clarify new functions involved in temporal kinetics of the transcriptional response to environmental stress in rice roots.
Material and method Microarray Assay
We used three rice microarray datasets from our previous works of treated rice seedlings uploaded to Gene Expression Omnibus (GSE IDs GSE34899, GSE41719, and GSE41733, [http://www.ncbi.nlm.nih.gov/geo/]) (Chen et al., 2014; Chi et al., 2013; Huang et al., 2014).
Arrays from individual experiments were normalized by using GeneSpring GX12 (Agilent Technologies). Probes with signal intensities < 100 in all experiments were excluded.
Statistical analysis involved the Kruskal-Wallis test. The Benjamini-Hochberg false-discovery rate (FDR) method was used to obtain corrected p-values for multiple testing. The fold change in expression of each gene was calculated with the mean from three biological replicates.
Probes with positive fold-change ratio ≥ 2 relative to untreated samples and FDR < 0.05 were considered differentially expressed. Specific expressed genes showed > two-fold change in expression with one treatment but < 1.4-fold change with the others.
Co-expression network and KEGG pathway enrichment analyses
Gene co-expression network analysis was performed using the R package WGCNA (version 1.51) (Langfelder and Horvath, 2008). Probes with fold-change ration < 1.4 relative to untreated sample and FDR > 0.05 in any of 18 samples were excluded. The co-expression analysis starts by constructing a matrix of pairwise correlations between all pairs of probes across all selected samples. Next the matrix is raised to a soft-thresholding power (β = 12 in this study) to obtain an adjacency matrix. In order to identify modules of co-expressed genes, we construct the topological overlap (TO)- based dissimilarity (Zhang and Horvath, 2005), which is then used as input to average linkage hierarchical clustering. This step results in a clustering tree (dendrogram) whose branches are identified for cutting depending on their shape using the dynamic tree-cutting algorithm (Kommadath et al., 2014). Expression values within each module were summarized by computing module “eigengenes” (MEs): the first principal component of each module obtained via singular value decomposition. We defined the module membership (MM) of individual probes as their correlations to the MEs, such that every probe had a MM value in each module. To discover any significant relationships between gene expression perturbations within modules and traits, we computed the correlations between MEs and stresses stimulations. p values were obtained via the Fisher transformation of each correlation. The KEGG pathway enrichment analysis was performed with R package culsterProfiler (version 1.9) (Yu et al., 2012).
Annotation of Stress-regulated Genes
Stress-regulated genes were annotated by using the Rice Annotation Project Database [http://rapdb.lab.nig.ac.jp/] and the MSU Rice Genome Annotation Project [http://rice.plantbiology.msu.edu]. For strict annotation of stress-regulated genes, the BLASTP approach was adopted. In addition, for signalling and transcription factor analyses, rice genes encoding protein kinases (1,467 genes) and transcription factors (1,930 genes) were obtained from the Rice Kinase Database [http://rkd.ucdavis.edu] and the Database of Rice Transcription Factors [http://drtf.cbi.pku.edu.cn/].
Classification of Stress-regulated Genes
The number of common stress-response genes was too small for robust enrichment statistics, so we performed a manual categorization. GOslim annotation data for rice genes were obtained
from the Rice Genome Annotation Project [http://rice.plantbiology.msu.edu/]. The common stress-response genes were manually classified into 14 different functional categories based on the GOslim data, Gene Ontology (GO) [http://geneontology.org], Uniprot
[http://www.uniprot.org], and Rice Pathways database
[http://pathway.gramene.org/RICE/class-tree?object=Pathways]. Statistical analysis involved the chi-square test.
Promoter region analysis
For promoter region analysis, genomic sequence data were extracted from assembled chromosome sequences in the MSU Rice Genome Annotation Project v7. Over-representation of transcription-factor binding sites in the upstream regions of ET, EC, and DL response genes were analyzed for motif identification. A 1-kbp upstream region from translation initiation codon of each gene differentially modulated on treatment with different stresses was extracted from the Element database [http://element.mocklerlab.org]. To detect enriched motifs of 6-9 nt, promoter regions were analyzed by using MEME with the ZOOPS model (Bailey et al., 2006), which considers that the motif occurrence can be 0 or 1 in a sequence. To verify whether the identified motifs were previously characterized plant cis-regulatory elements, we used TOMTOM (Motif Comparison Tool) with JASPER [http://jaspar.genereg.net/], PLACE [https://sogo.dna.affrc.go.jp/cgi-
bin/sogo.cgi?lang=en&pj=640&action=page&page=newplace] and the Arabidopsis TF motif dataset (Franco-Zorrilla et al., 2014). Finally, the predicted-site significance of ET, EC and DL response gene sets were compared with the rice genome by using the findMotif application [http://hgdownload.soe.ucsc.edu/admin/exe/] and a custom-made Perl script. Statistical analysis of motifs involved a permutation test. Enrichment was defined by p < 0.01. To detect the CpG island in the upstream regions of ET, EC, and DL response genes, we used the CpG island searcher (Takai and Jones, 2003). Statistical analysis of CpG island involved a chi- square test.
Intron sequence and gene structure analysis
Information on gene structure, first exon/intron length, and intron/exon distribution were obtained by using custom-made Perl scripts. The GFF3 file of rice genome was downloaded
from the Rice Genome Annotation Project database
[ftp://ftp.plantbiology.msu.edu/pub/data/Eukaryotic_Projects/o_sativa/annotation_dbs/].
Statistical analysis involved Student t test.
IMEter scores
To obtain IMEter scores, we used IMEter v2.1 [http://korflab.ucdavis.edu/cgi- bin/IMEter_2014/web-imeter2.1.pl] with the transcribed strand used in the analysis. Only genes with more than one intron were considered. Statistical analysis involved one-way ANOVA.
RNA-seq analysis and assembly
Total RNA was extracted from rice roots treated with 50 µM Hg for 1-24 h by use of the QIAGEN RNeasy Mini Kit (QIAGEN, Hilden, Germany), with some modification. The yield and RNA purity were measured spectrophotometrically (NanodropND 2000, Nanodrop Technologies, Wilmington, DE, USA). RNA-seq analysis involved 300 ng/µl RNA samples with high purity (OD260/280 and OD260/230 > 2). The cDNA library preparation and whole transcriptome sequencing were performed at Yourgene Bioscience (Taiwan). Whole- transcriptome sequencing involved the Illumina HiSeq2500 150-bp single-end platform, and sequences with quality scores > 30 were included in further assembly and gene expression
estimation (RPKM). The assembly of rice transcriptome involved use of the TopHat package, and differentially expressed genes were identified with the Cufflinks package (Trapnell et al., 2012).
Estimation of synonymous and nonsynonymous rates (Ka/Ks)
The list of maize and rice orthologous genes was obtained from the Wang et al. study (Wang et al., 2014) to investigate the evolution rates between rice and maize. All protein sequences were aligned by using ClustalW with default parameters and back-translated to their corresponding DNA sequences by PAL2NAL. Ka/Ks values were calculated by the maximum likelihood method implemented in KaKs_Calculator (Zhang et al., 2006). The significance of the difference in Ka/Ks ratios between gene sets was evaluated by Student t test.
Reference
Akua, T. and Shaul, O. (2013). The Arabidopsis thaliana MHX gene includes an intronic element that boosts translation when localized in a 5' UTR intron. J Exp Bot 64, 4255–4270.
Allen, J. D., Xie, Y., Chen, M., Girard, L. and Xiao, G. (2012) Comparing statistical methods for constructing large scale gene networks. PLoS One, 7, e29348.
Bailey, T. L., Williams, N., Misleh, C. and Li, W. W. (2006). MEME: discovering and analyzing DNA and protein sequence motifs. Nucleic Acids Res 34, W369–73.
Bjornson, M., Benn, G., Song, X., Comai, L., Franz, A. K., Dandekar, A. M., et al. (2014). Distinct Roles for Mitogen-Activated Protein Kinase Signaling and CALMODULIN-BINDING TRANSCRIPTIONAL ACTIVATOR3 in Regulating the Peak Time and Amplitude of the Plant General Stress Response. Plant Physiol 166, 988–996.
Brinster, R. L., Allen, J. M., Behringer, R. R., Gelinas, R. E. and Palmiter, R. D. (1988). Introns increase transcriptional efficiency in transgenic mice. Proc Natl Acad Sci USA 85, 836–840.
Buitink, J., Buitink, J., Leger, J. J., Leger, J. J., Guisle, I., Guisle, I., et al. (2006). Transcriptome profiling uncovers metabolic and regulatory processes occurring during the transition from desiccation-sensitive to desiccation-tolerant stages in Medicago truncatula seeds. Plant J 47, 735–750.
Cao, H., Glazebrook, J., Clarke, J. D., Volko, S. and Dong, X. (1997). The Arabidopsis NPR1 Gene That Controls Systemic Acquired Resistance Encodes a Novel Protein Containing Ankyrin Repeats. Cell 88, 57–63.
Chen, Y.-A., Chi, W.-C., Trinh, N. N., Huang, L.-Y., Chen, Y.-C., Cheng, K.-T., et al. (2014). Transcriptome profiling and physiological studies reveal a major role for aromatic amino acids in mercury stress tolerance in rice seedlings. PLoS ONE 9, e95163.
Chi, W.-C., Chen, Y.-A., Hsiung, Y.-C., Fu, S. F., Chou, C.-H., Trinh, N. N., et al. (2013). Autotoxicity mechanism of Oryza sativa: transcriptome response in rice roots exposed to ferulic acid. BMC Genomics 14, 351.
Colebrook, E. H., Thomas, S. G., Phillips, A. L. and Hedden, P. (2014). The role of gibberellin signalling in plant responses to abiotic stress. J Exp Biol 217, 67–75.
Conde, A., Chaves, M. M. and Gerós, H. (2011). Membrane transport, sensing and signaling in plant adaptation to environmental stress. Plant Cell Physiol 52, 1583–1602.
de Nadal, E., Ammerer, G. and Posas, F. (2011). Controlling gene expression in response to stress. Nat. Rev.
Genet. 12, 833–845.
Deaton, A. M. and Bird, A. (2011). CpG islands and the regulation of transcription. Genes & Dev 25, 1010–
1022.
Drummond, D. A., Bloom, J. D., Adami, C., Wilke, C. O. and Arnold, F. H. (2005) Why highly expressed
proteins evolve slowly. Proc Natl Acad Sci USA 102: 14338–14343
Franco-Zorrilla, J. M., López-Vidriero, I., Carrasco, J. L., Godoy, M., Vera, P. and Solano, R. (2014). DNA- binding specificities of plant transcription factors and their potential to define target genes. Proc Natl Acad Sci USA 111, 2367–2372.
Frei dit Frey, N., Garcia, A., Bigeard, J., Zaag, R., Bueso, E., Garmier, M., et al. (2014). Functional analysis of Arabidopsis immune-related MAPKs uncovers a role for MPK3 as negative regulator of inducible defences.
Genome Biol. 15, R87.
Fu, Z. Q., Yan, S., Saleh, A., Wang, W., Ruble, J., Oka, N., et al. (2012). NPR3 and NPR4 are receptors for the immune signal salicylic acid in plants. Nature 486, 228–232.
Furger, A., O'Sullivan, J. M., Binnie, A., Lee, B. A. and Proudfoot, N. J. (2002). Promoter proximal splice sites enhance transcription. Genes & Dev 16, 2792–2799.
Good, J. M. and Nachman, M. W. (2005). Rates of protein evolution are positively correlated with developmental timing of expression during mouse spermatogenesis. Molecular Biology and Evolution 22, 1044–
1052.
Gardiner-Garden, M., Sved, J. A., and Frommer, M. (1992) Methylation sites in angiosperm genes. J Mol Evol 34: 219–230
Huang, T.-L., Huang, L.-Y., Fu, S.-F., Trinh, N. N. and Huang, H.-J. (2014). Genomic profiling of rice roots with short- and long-term chromium stress. Plant Mol Biol 86, 157–170.
Illingworth, R. S., Gruenewald-Schneider, U., Webb, S., Kerr, A. R. W., James, K. D., Turner, D. J., et al.
(2010). Orphan CpG islands identify numerous conserved promoters in the mammalian genome. PLoS Genet. 6, e1001134.
Jeong, H., Mason, S. P., Barabási, A. L. and Oltvai, Z. N. (2001). Lethality and centrality in protein networks.
Nature 411, 41–42.
Jiang, Z., Dong, X. and Zhang, Z. (2016). Network-Based Comparative Analysis of Arabidopsis Immune Responses to Golovinomyces orontii and Botrytis cinerea Infections. Sci Rep 6, 19149.
Kanehisa, M. and Goto, S. (2000). KEGG: kyoto encyclopedia of genes and genomes. Nucl. Acids Res. 28, 27–
30.
Kilian, J., Whitehead, D., Horak, J., Wanke, D., Weinl, S., Batistic, O., et al. (2007). The AtGenExpress global stress expression data set: protocols, evaluation and model data analysis of UV-B light, drought and cold stress responses. Plant J 50, 347–363.
Kim, D. H., Feinbaum, R., Alloing, G., Emerson, F. E., Garsin, D. A., Inoue, H., et al. (2002). A conserved p38 MAP kinase pathway in Caenorhabditis elegans innate immunity. Science 297, 623–626.
Kinkema, M., FAN, W. and Dong, X. (2000). Nuclear localization of NPR1 is required for activation of PR gene expression. Plant Cell 12, 2339–2350.
Kiyosue, T., Yamaguchi-Shinozaki, K. and Shinozaki, K. (1994) Cloning of cDNAs for genes that are early- responsive to dehydration stress (ERDs) inArabidopsis thaliana L.: identification of three ERDs as HSP cognate genes. Plant Mol Biol 25: 791–798
Kommadath, A., Bao, H., Arantes, A. S., Plastow, G. S., Tuggle, C. K., Bearson, S. M., et al. (2014). Gene co-expression network analysis identifies porcine genes associated with variation in Salmonella shedding. BMC Genomics 15, 452.
Kranner, I., Kranner, I., Minibayeva, F. V., Minibayeva, F. V., Beckett, R. P., Beckett, R. P., et al. (2010).
What is stress? Concepts, definitions and applications in seed science. New Phytol 188, 655–673.
Kreps, J. A., Kreps, J. A., Wu, Y., Wu, Y., Chang, H. S., Chang, H. S., et al. (2002). Transcriptome changes for Arabidopsis in response to salt, osmotic, and cold stress. Plant Physiol 130, 2129–2141.
Kunst, L. and Samuels, L. (2009). Plant cuticles shine: advances in wax biosynthesis and export. Curr Opin Plant Biol 12, 721–727.
Langfelder, P. and Horvath, S. (2008). WGCNA: an R package for weighted correlation network analysis. BMC Bioinformatics 9, 559.
Li, Y., Beisson, F., Koo, A. J. K., Molina, I., Pollard, M. and Ohlrogge, J. (2007). Identification of acyltransferases required for cutin biosynthesis and production of cutin with suberin-like monomers. Proc Natl Acad Sci USA 104, 18339–18344.
Liu, Y., Li, H., Tanaka, K., Tsumaki, N. and Yamada, Y. (2000). Identification of an enhancer sequence within the first intron required for cartilage-specific transcription of the alpha2(XI) collagen gene. J. Biol. Chem. 275, 12712–12718.
Ludwig, A. A., Saitoh, H., Felix, G., Freymark, G., Miersch, O., Wasternack, C., et al. (2005). Ethylene- mediated cross-talk between calcium-dependent protein kinase and MAPK signaling controls stress responses in plants. Proc Natl Acad Sci USA 102, 10736–10741.
Ma, S. and Bohnert, H. J. (2007). Integration of Arabidopsis thaliana stress-related transcript profiles, promoter structures, and cell-specific expression. Genome Biol. 8, R49.
Mohanty, B., Herath, V., Wijaya, E., Yeo, H. C., de los Reyes, B. G. and Lee, D.-Y. (2012). Patterns of cis- element enrichment reveal potential regulatory modules involved in the transcriptional regulation of anoxia response of japonica rice. Gene 511, 235–242.
Morita, S., Tsukamoto, S., Sakamoto, A., Makino, H., Nakauji, E., Kaminaka, H., et al. (2012). Differences in intron-mediated enhancement of gene expression by the first intron of cytosolic superoxide dismutase gene from rice in monocot and dicot plants. Plant Biotechnol. J. 29, 115–119.
Nakano, T., Suzuki, K., Fujimura, T. and Shinshi, H. (2006). Genome-wide analysis of the ERF gene family in Arabidopsis and rice. Plant Physiol 140, 411–432.
Narusaka, Y., Nakashima, K., Shinwari, Z. K., Sakuma, Y., Furihata, T., Abe, H., et al. (2003). Interaction between two cis-acting elements, ABRE and DRE, in ABA-dependent expression of Arabidopsis rd29A gene in response to dehydration and high-salinity stresses. Plant J 34, 137–148.
Parra, G., Bradnam, K., Rose, A. B. and Korf, I. (2011). Comparative and functional analysis of intron- mediated enhancement signals reveals conserved features among plants. Nucleic Acids Res 39, 5328–5337.
Pastori, G. M. and Foyer, C. H. (2002) Common components, networks, and pathways of cross-tolerance to stress. The central role of “redox” and abscisic acid-mediated controls. Plant Physiol 129, 460–468
Peleg, Z. and Blumwald, E. (2011). Hormone balance and abiotic stress tolerance in crop plants. Curr Opin Plant Biol 14, 290–295.
Ramirez-Carrozzi, V. R., Braas, D., Bhatt, D. M., Cheng, C. S., Hong, C., Doty, K. R., et al. (2009). A Unifying Model for the Selective Regulation of Inducible Transcription by CpG Islands and Nucleosome Remodeling. Cell 138, 114–128.
Rasmussen, S., Barah, P., Suarez-Rodriguez, M. C., Bressendorff, S., Friis, P., Costantino, P., et al. (2013).
Transcriptome responses to combinations of stresses in Arabidopsis. Plant Physiol 161, 1783–1794.
Ren, X. Y., Vorst, O., Fiers, M. W. E. J., Stiekema, W. J. and Nap, J. P. (2006). In plants, highly expressed genes are the least compact. Trends Genet. 22, 528–532.
Riley, R. M., Jin, W. and Gibson, G. (2003) Contrasting selection pressures on components of the Ras-mediated
signal transduction pathway in Drosophila. Mol Ecol 12: 1315–1323
Rombauts, S., Florquin, K., Lescot, M., Marchal, K., Rouzé, P., and Van de Peer, Y. (2003) Computational Approaches to Identify Promoters and cis-Regulatory Elements in Plant Genomes. Plant Physiol 132: 1162–1176 Rose, A. B. and Beliakoff, J. A. (2000). Intron-mediated enhancement of gene expression independent of unique intron sequences and splicing. Plant Physiol 122, 535–542.
Schweighofer, A., Kazanaviciute, V., Scheikl, E., Teige, M., Doczi, R., Hirt, H., et al. (2007). The PP2C-type phosphatase AP2C1, which negatively regulates MPK4 and MPK6, modulates innate immunity, jasmonic acid, and ethylene levels in Arabidopsis. Plant Cell 19, 2213–2224.
Shan, X., Li, Y., Jiang, Y., Jiang, Z., Hao, W. and Yuan, Y. (2013). Transcriptome Profile Analysis of Maize Seedlings in Response to High-salinity, Drought and Cold Stresses by Deep Sequencing. Plant Mol Biol Rep 31, 1485–1491.
Shepherd, T. and Wynne Griffiths, D. (2006). The effects of stress on plant cuticular waxes. New Phytol 171, 469–499.
Slotte, T., Bataillon, T., Hansen, T. T., St Onge, K., Wright, S. I. and Schierup, M. H. (2011) Genomic determinants of protein evolution and polymorphism in Arabidopsis. Genome Biol Evol 3: 1210–1219
Stuart, J. M., Segal, E., Koller, D. and Kim, S. K. (2003). A gene-coexpression network for global discovery of conserved genetic modules. Science 302, 249–255.
Subramanian, S. and Kumar, S. (2004) Gene Expression Intensity Shapes Evolutionary Rates of the Proteins Encoded by the Vertebrate Genome. Genetics 168: 373–381
Takai, D. and Jones, P. A. (2003). The CpG island searcher: a new WWW resource. In Silico Biol. (Gedrukt) 3, 235–240.
Trapnell, C., Roberts, A., Goff, L., Pertea, G., Kim, D., Kelley, D. R., et al. (2012). Differential gene and transcript expression analysis of RNA-seq experiments with TopHat and Cufflinks. Nat Protoc 7, 562–578.
Wang, K. L. C., Li, H. and Ecker, J. R. (2002). Ethylene biosynthesis and signaling networks. Plant Cell 14 Suppl, S131–51.
Wang, L., Czedik-Eysenberg, A., Mertz, R. A., Si, Y., Tohge, T., Nunes-Nesi, A., et al. (2014). Comparative analyses of C₄ and C₃ photosynthesis in developing leaves of maize and rice. Nat. Biotechnol. 32, 1158–1165.
Warren, A. S., Anandakrishnan, R. and Zhang, L. (2010). Functional bias in molecular evolution rate of Arabidopsis thaliana. BMC Evol. Biol. 10, 1.
Wei, T., Bin Ou, Li, J., Zhao, Y., Guo, D., Zhu, Y., et al. (2013). Transcriptional Profiling of Rice Early Response to Magnaporthe oryzae Identified OsWRKYs as Important Regulators in Rice Blast Resistance. PLoS ONE 8, e59720.
Wu, J., Hettenhausen, C., Meldau, S. and Baldwin, I. T. (2007). Herbivory rapidly activates MAPK signaling in attacked and unattacked leaf regions but not between leaves of Nicotiana attenuata. Plant Cell 19, 1096–1122.
Xiong, L. and Yang, Y. (2003). Disease resistance and abiotic stress tolerance in rice are inversely modulated by an abscisic acid-inducible mitogen-activated protein kinase. Plant Cell 15, 745–759.
Yamaguchi-Shinozaki, K. and Shinozaki, K. (1994). A novel cis-acting element in an Arabidopsis gene is involved in responsiveness to drought, low-temperature, or high-salt stress. Plant Cell 6, 251–264.
Yamanouchi, U., Yano, M., Lin, H., Ashikari, M. and Yamada, K. (2002). A rice spotted leaf gene, Spl7, encodes a heat stress transcription factor protein. Proc Natl Acad Sci USA 99, 7530–7535.
Yang, C., Cangjing, Y., Liu, J., Jingjing, L., Dong, X., Xinran, D., et al. (2014). Short-term and continuing
stresses differentially interplay with multiple hormones to regulate plant survival and growth. Mol Plant 7, 841–
855.
Yang, L. and Gaut, B. S. (2011) Factors that contribute to variation in evolutionary rate among Arabidopsis genes. Mol Biol Evol 28: 2359–2369
Yeats, T. H. and Rose, J. K. C. (2013). The formation and function of plant cuticles. Plant Physiol 163, 5–20.
Yeh, Y.-H., Chang, Y.-H., Huang, P.-Y., Huang, J.-B. and Zimmerli, L. (2015). Enhanced Arabidopsis pattern-triggered immunity by overexpression of cysteine-rich receptor-like kinases. Front Plant Sci 6, 488–12.
Yu, G., Wang, L.-G., Han, Y. and He, Q.-Y. (2012). clusterProfiler: an R Package for Comparing Biological Themes Among Gene Clusters. OMICS 16, 284–287.
Zadražnik, T., Hollung, K., Egge-Jacobsen, W., Meglič, V. and Šuštar-Vozlič, J. (2013). Differential proteomic analysis of drought stress response in leaves of common bean (Phaseolus vulgaris L.). Journal of Proteomics 78, 254–272.
Zhang, B. and Horvath, S. (2005). A general framework for weighted gene co-expression network analysis. Stat Appl Genet Mol Biol 4, Article17.
Zhang, Z., Li, J., Zhao, X.-Q., Wang, J., Wong, G. K.-S. and Yu, J. (2006). KaKs_Calculator: calculating Ka and Ks through model selection and model averaging. Genomics Proteomics Bioinformatics 4, 259–263.
Zhu, J. K. (2002) Salt and drought stress signal transduction in plants. Annu Rev Plant Biol 53, 247–273 Zou, C., Sun, K., Mackaluso, J. D., Seddon, A. E., Jin, R., Thomashow, M. F. and Shiu, S. H. (2011). Cis- regulatory code of stress-responsive transcription in Arabidopsis thaliana. Proc Natl Acad Sci USA 108, 14992–
14997.
Tables
Table 1. Significant cis-element enrichment motifs in early-transient (ET), early-constant (EC) and delayed (DL) genes.
Cis-element motif ET genes with motif
EC genes with motif
DL genes with
motif Matched
CSCRCSCGC 23 (23.5)*
p = 0.0027
14 (8.4) p = 0.7412
2 (6.9)
p = 0.5775 DREB2C
GCAWGCA 50 (51.0)
p = 0.0246
78 (47.0) p = 0.0379
26 (89.7)*
p = 0.0001
SWGCADGC 27 (27.5)
p = 0.8458
43 (25.9) p = 0.9352
24 (82.8)*
p = 0
KGCCKYGC 12 (12.2)
p = 0.4326
18 (10.8) p = 0.2063
14 (48.3)*
p = 0.0004 SPL7
Date are no. (%). *, p < 0.01 by permutation test.
Table 2. Gene structure information for of ET, EC, and DL gene sets from rice reference genome.
Category Exon count Intron count 1st exon length (bp) Total intron length (bp)
cDNA length (bp)
ET 4.13 ± 0.4 p = 0.79
3.13 ± 0.4 p = 0.79
667.0 ± 54.9 p = 0.17
1,272.6 ± 199.7 p = 0.96
1,709.1 ± 84.2 p = 0.59
EC 3.08 ± 0.27*
p = 4.0e-05
2.08 ± 0.27*
p = 4.0e-05
789.5 ± 51.4*
p = 1.6e-04
917.3 ± 141.8*
p = 1.1e-09
1,550,1 ± 58.5 p = 0.055
DL 2.31 ± 0.31*
p = 8.1e-07
1.31 ± 0.31*
p = 8.1e-07
847.2 ± 110.3*
p = 0.03
864.8 ± 241.1 p = 0.09
1,323.7 ± 115.3*
p = 4.24e-12
Date are mean ± SEM. *, p < 0.05 by Student t test.
Table&3.&Gene&structure&validation&via&RNA7seq&assembled&transcriptome.&
Category Exon count Intron count 1st exon length (bp)
Total intron length
(bp) cDNA length (bp)
ET 5.78 ± 0.5
p = 0.37
4.8 ± 0.5 p = 0.35
626.6 ± 58.2 p = 0.75
1,831.5 ± 203.1 p = 0.92
1,966.2 ± 145.1 p = 0.43
EC 3.11 ± 0.3*
p = 5.2e-10
2.12 ± 0.3*
p = 5.6e-10
777.0 ± 61.1*
p = 0.03
1,346.2 ± 304.4 p = 0.13
1,498.8 ± 64.1*
p = 2.7e-07
DL 2.11 ± 0.3*
p = 2.6e-09
1.16 ± 0.5*
p = 2.2e-09
842.2 ± 118.4 p = 0.11
949.3 ± 299.4*
p = 0.009
1,323.2 ± 155.0*
p = 0.003
Data are mean ± SEM. *, p < 0.05 by Student t test.