探討水溶性大蒜萃取物S-allylcysteine對非小細胞肺癌細胞株的影響; The effect of garlic water-soluble compounds S-allylcysteine (SAC) on non-small cell lung cancer (NSCLC) A549 cell line.
50
0
0
全文
(2) 中文摘要 肺癌於癌症造成的相關死亡中居於前位。儘管目前的醫療進步,非 小細胞肺癌 (non small cell lung cancer ; NSCLC) 的病人對於治療及恢 復的反應仍然偏低。因此本研究之目的為探討大蒜水溶性萃取物 S-allycysteine (SAC) 對非小細胞肺癌 A549 細胞株生長之影響。在裸鼠 xenograft 動物實驗中,每天給予管餵 SAC 240 mg/kg BW (low SAC group) 與 480 mg/kg BW (high SAC group),再利用非侵入式活體影像系 統 Non-invasive In vivo imaging system (IVIS) 每週追蹤腫瘤生長的大 小。在持續管餵 52 天後觀察到給予 SAC 的組別其腫瘤體積與重量皆 明顯較腫瘤組小。在動物血清 ELISA 實驗中,發現血清 TIMP-1 與 MMP-9 濃度在給予 SAC 的組別中顯著較腫瘤組低。另外,給予 SAC 的組別發現 p-Akt、p-mTOR 和 NF-κB 表現量皆較腫瘤組低。此結果 顯示在體內 (in vivo) 實驗中, SAC 能影響非小細胞肺癌 A549 的 MMP-9 表現,且 SAC 可透過調控 p-Akt/p-mTOR 來影響 A549 非小 細胞肺癌細胞的生長。. 關鍵詞: S-allycysteine (SAC), non small cell lung cancer (NSCLC), Non-invasive In vivo imaging system (IVIS). I.
(3) Abstract Lung cancer is the leading cause of cancer-related deaths. Despite the recent advances in the treatment of lung cancer, the response and remission rates in non-small cell lung cancer (NSCLC) patients remain relatively low. Therefore, the objective of this study is to evaluate the effect of S-allylcysteine (SAC) on non-small cell lung cancer (NSCLC) A549 cell line. In nude mice xenograft model experiment, we gave SAC 240 mg/kg BW (low SAC group) and 480 mg/kg BW (high SAC group) by oral administration everyday. The tumor size was observed by Non-invasive in vivo imaging system (IVIS). After 52 days oral gavage of SAC, the tumor volume and weight in SAC treating group were significantly lower than in tumor group. The serum levels MMP-9 and TIMP-1 in SAC treating group were significantly lower than in tumor group. Furthermore, the protein expression of p-Akt, p-mTOR and NF-κB in SAC treatment group were lower than in tumor group. Results from our in vivo experiments indicated that SAC treatment could lower MMP-9 levels in A549 lung cancer cells. Furthermore, SAC may inhibit the growth of A549 lung cancer cells through mediated p-Akt/p-mTOR pathway.. Key words: S-allycysteine (SAC), non small cell lung cancer (NSCLC), Non-invasive In vivo imaging system (IVIS). II.
(4) Contents 中文摘要…………..…………………………………………………………I Abstract……………….………..…………………………………………..II Contents……………………………………………………………..……III Figure Index…………………………………………………………….. IV Introduction……………………………………………………………......1 Study purpose…………………………………………………………..3 Background, hypothesis and specific aim……………………………..4 Literature Review…………………………………………………………. 5 Experimental design……………………………………………….……..9 Materials and Methods………………………………………………….10 Nude mice xenograft model for A549 lung cancer cells…………..10 Nude mice oral gavage experiment for SAC…………………….....11 Animal serum ELISA for MMP-9 and TIMP-1……………...........12 Western blotting for animal tissue p-Akt, p-mTOR and NF-B….14 Animal tissue protein sample preparation………………………...14 Colorimetric detection and quantitation of total protein................16 Western blotting analysis…………………........................................17 Results……………………………………………………………………...21 Discussion………………………………………………………………….35 References……………………………………………………………….38 Appendix………………………………………………………………...43. III.
(5) Figure Index Figure 1. The tumor formation after A549 xenograft implantation for 1 and 2 weeks………………………………..………………….24 Figure 2. The average dietary intake during SAC treatment……......25 Figure 3. The average body weight during SAC treatment…………..26 Figure 4. The tumor volume during SAC treatment……………….…27 Figure 5 The growth of A549 tumor in nude mice xenografts model during SAC treatment.………………….…………………….28 Figure 6. The mean weight of tumors after SAC treatment…………..29 Figure 7. MMP-9 concentration in nude mice serum………..……….....31 Figure 8. TIMP-1 concentration in nude mice serum……….………….32 Figure 9. SAC treatment influenced p-Akt and its downstream expression in vivo…………………………………………….34. IV.
(6) Introduction The morbidity and mortality rate of lung cancer have been trending up these years all over the world (Stewart and Kleihues, 2003). Lung cancer becomes the most common malignant disease world wide (Greenlee et al., 2001). In Taiwan, lung cancer is also the leading cause of cancer-related deaths in recent years. There are two major types of lung cancer including small cell lung cancer (SCLC) and non-small cell lung cancer (NSCLC). Small cell lung cancer is less common, accounting for less than 20 percent of all lung cancer cases. Non-small cell lung cancer including squamous cell carcinoma, adenocarcinoma, and large cell carcinoma accounts for the remaining 80 percent of lung cancer cases. Adenocarcinoma is the most frequent type of lung cancer in the United States (American lung association, 2005). Human NSCLC A549 cells is an adenocarcinoma epithelial cell line was derived from human lung carcinoma. Up to 30 % of human cancers are probably related to diet and nutrition (Stewart and Kleihues, 2003). Many in vitro and epidemiological studies suggest that phytochemicals in fruits and vegetables may have benefit to prevent cancer (Amin et al., 2009; Beliveau and Gingras, 2007; Lampe, 2009). Allium vegetable is believed to have anticancer effect. One of these allium vegetables is garlic. Garlic has been suggested as an anticancer agent for several decades in epidemiological studies (Thomson and Ali, 2003). Therefore, garlic and its derivative constituents were suggested to be. 1.
(7) effective chemopreventive agents (Hsing et al., 2002). It contains high levels of organosulphur compounds. S-allylcysteine (SAC) is one of the main bioactive components in garlic (Amagase et al., 2001). Many studies have demonstrated that SAC has strong antioxidative effect, antiamyloidogenic activity, cardioprotection, antidiabetic and antiinflammation effects (Chuah et al., 2007; Chung, 2006; Gupta and Rao, 2007; Sheela et al., 1995; Yan and Yin, 2007). Studies of SAC on many types of cancer including prostate, breast and oral cancers demonstrated the antitumor effect of SAC (Chu et al., 2007; Gapter et al., 2008; Hsing et al., 2002; Tang et al., 2009).. 2.
(8) Study purpose According to previous studies indicated that SAC had antitumor effect in many types of cancer cells (Chu et al., 2007; Gapter et al., 2008; Hsing et al., 2002; Tang et al., 2009). In a study about SAC its antitumor effect on breast cancer cells showed that SAC could reduce the activity of MMPs and inhibit the growth of breast cancer cells (Gapter et al., 2008). Many studies indicate that Akt pathway plays an important role in NSCLC cell growth, tumour progression and antiapotosis. Akt pathway may also enhance the risk of NSCLC tumor progression and malignancy (Balsara et al., 2004; David et al., 2004). However, the effects of S-allylcysteine (SAC) on human non small cell lung cancer A549 cells have not been studied. In this study, our objective is to evaluate the inhibitory effects of S-allylcysteine (SAC) on non-small cell lung cancer (NSCLC) A549 cells. The aim of our study is whether SAC could inhibit the activity of MMP-9. If the anticancer ability of SAC is through mediate Akt pathway.. 3.
(9) Background S-allylcysteine ( SAC ). Akt pathway P. Akt. MMPs at 40mM in breast cancer and The growth of breast cancer cell. NSCLC progression. (Leslie A. et al., 2008). (Balsara et al., 2004). Hypothesis and Specific Aim S-allylcysteine (SAC). In vivo. MMP-9. Akt pathway. A549 lung cancer. 4. ?.
(10) Literature Review The major bioactive components in garlic. Allium sativum L. is commonly known as garlic. Garlic contains high levels of organosulphur compounds which are the major bioactive components. Allium bulbs contain γ-glutamylcysteines and cysteine sulfoxides as the major organosulfur compounds. These organosulphur compounds can be primarily devied into two groups. One group is lipid-soluble garlic extract, including diallyl sulfide (DAS), diallyl disulfide (DADS) and diallyl trisulfide (DATS). The other group is water-soluble garlic extract, including S-allyl cysteine (SAC) and S-allylmecaptocysteine (SAMC). These organosulphur compounds in garlic can be converted form γ-glutamylcysteines. γ-glutamylcysteines are converted to DAS, DADS and DATS through alliin/allicin pathway. However, γ-glutamylcysteines are converted to S-allyl cysteine (SAC) via a pathway other than the alliin/allicin pathway (Amagase et al., 2001).. (Amagase et al., 2001) 5.
(11) Aged garlic extract. Aged garlic extract (AGE) is aged for up to 20 months. The odorous, harsh and irritating compounds in garlic are converted naturally into more stable and safe sulfur compounds after aging. The contents of SAC and SAMC are high in aged garlic extract (Amagase et al., 2001). SAC content in the intact garlic is very small, not more than 30 μg/g-fresh weight (Kodera et al., 2002).. Bioavailability and safety of SAC. Analysis of SAC bioavailability in animal studies indicated that SAC was rapidly and easily absorbed in vivo. The bioavailability of SAC was 98.2 % in rats, 103 % in mice, and 87.2 % in dogs. SAC distributed mainly in plasma, liver, and kidney after absorption. SAC was mainly excreted into urine in the N-acetyl form in rats; however, mice excreted both SAC and the N-acetyl form (Nagae et al., 1994). The chronic toxicity test of aged garlic extract was examined orally in Wistar rats for 6 months. However, there were no toxic symptoms even at a high dose level of 2000 mg/kg (Sumiyoshi et al., 1984). In human study, SAC showed high bioavailability, reabsorption and stability in blood. SAC also showed low toxicity in human (Kodera et al., 2002).. 6.
(12) MMP-9 and TIMP-1. The matrix metalloproteinases (MMPs) are a large family of structurally and functionally related proteolytic enzymes. MMPs are involved in the breakdown of extracellular matrix (ECM) during metastasis. Studies also indicated that MMP-9 is required for tumor progression (Bergers et al., 2000). Based on structure similarities and substrate specificity, MMPs were divided into many subclasses including collagenases, stromelysins, metalloelastases, membrane-type MMPs (MT-MMPs) and gelatinases. MMP-2 (72 kDa) and MMP-9 (92 kDa) were gelatinases (Jinga et al., 2006). MMP-2 and MMP-9 were the major type of MMP involved in tumor initiation, growth and metastasis (Duffy et al., 2000). Tissue inhibitors of metalloproteinases (TIMPs) are important controlling factors of MMPs in normal and disease processes. The balance between MMPs and TIMPs is tightly regulated. TIMP-1 appeared to be the major inhibitor of MMP-9. The abnormal MMP-9/TIMP-1 balance influenced breast tumor growth (Jinga et al., 2006). However, many studies also suggested that TIMP-1 stimulated the growth of several cancer cell lines (Hayakawa et al., 1992; Porter et al., 2004). Studies indicated that high expression of TIMP-1 in some cancer patients is linked to a poor prognosis (McCarthy et al., 1999; Porter et al., 2005; Ree et al., 1997). Therefore, TIMP-1 may act as a multifunctional protein that possess either MMP inhibitory activities or promote tumor progression (Baker et al., 2002).. 7.
(13) Akt pathway and cancer. Akt is frequently activated in various cancers, including pancreas, gastric, prostate and breast cancers (Cinti et al., 2008; Graff et al., 2000; Schlieman et al., 2003; Vestey et al., 2005). In lung cancers, especially in the non-small cell lung cancers showed that Akt activation is a frequent and early event during lung tumorigenesis, which may enhance the risk of tumor progression and malignancy (Balsara et al., 2004). Phosphorylation of Akt regulates the phosphorylation of its several downstream such as NF-κB and mTOR (David et al., 2004). These phosphorylation of its downstream mediate the effects of Akt on cell growth, proliferation and antiapoptosis (Lawlor and Alessi, 2001; Mori and Sairenji, 2006; Romashkova and Makarov, 1999). Study also indicated that inhibit Akt phosphorylation could suppress the proliferation, invasion of A549 cells and induce apoptosis (Zhang et al., 2008).. 8.
(14) Experimental Design. Nude mice xenograft model IVIS observed tumor size for 2 weeks.. Control (C) x2. Tumor (T) x9. SAC. SAC. 240 mg/kg BW. 480 mg/kg BW. (HS) x9. (HS) x9. (HS) x9. (HS) x9. Oral gavage with SAC for 52 days. IVIS observed tumor growth every week.. ELISA. Western blot. Serum MMP-9 Serum TIMP-1. p-Akt p-mTOR NF-κ B. 9.
(15) METERIALS AND METHODS 1. Nude mice xenograft model for A549 lung cancer cells Materials and reagents 4 weeks old Female BALB/c nu/nu nude mice were purchased from Taiwan National laboratory animal center. Growth factor reduced metri-gel was purchased from BD (Franklin Lakes, NJ, U.S.A.). M199 medium was purchased from Sigma (St. Louis, MO 63103, U.S.A.). Luciferin, Non-invasive in vivo imaging system (IVIS), 29G 1/2 ml and 25G 1 ml needles were used in this experiment. Prolab RMH 2500 diet was purchased from U.S.A... Procedure In nude mice xenograft model experiment, 32 female BALB/c nu/nu nude mice of 4 weeks old were purchased from National laboratory animal center. Before the A549 cancer cell injection, the nude mice were adapted for 1 week and housed with a regular 12 hour light/12 hour dark cycle in Specific pathogen free (SPF) room at the Laboratory Animal Center. 100 μl 1.5×10⁶ A549 cell were injected subcutaneously with growth factor reduced metri-gel (4 folds dilute in M199) 100 μl by 25G 1 ml needle into the left thigh of 30 mice. 2 mice were used as health control. After xenograft. 10.
(16) implantation, the tumor size was observed by Non-invasive in vivo imaging system (IVIS) for 2 weeks and then the mice were equally and randomly divided into three groups (N=9 for each group) according to the tumor size. The tumor expression was not observed in 3 mice. Therefore they were not continued the following experiment. Intraperitoneal injection of 140 μl 60 mg/ml luciferin (dilute in PBS) into mice was injected by 29G needle. And the tumor size was observed by Non-invasive in vivo imaging system (IVIS) every week. After 52 days (about 7 weeks) oral gavage of SAC, the animals were sacrificed and blood was collected from the heart. 2 mg Heparin were added in about 400-500 μl blood well mixed immediately and put on ice for 15 mins. 15 mins later, the blood samples were centrifuged for 5 minutes at 4℃ at 5000 rpm. The serum sample of the supernatants were collected carefully and saved at -80℃ for further analysis. Animal tissues were stored at -80℃ for further analysis.. 2. Nude mice oral gavage experiment for SAC Materials and reagents Nude mice were feed with Laboratory chow diet. The diet contains crude protein not less than 23 %, crude fat not less than 4.5 %, crude fiber not more than 6 %, Ash not more than 8 % and added minerals not more than 2.5 %. S-allylcysteine (SAC) was purchased from LKT Laboratories (St. Paul,. 11.
(17) MN, U.S.A.). Oral gavage tubes and 25G 1 ml needles were used in this experiment.. Procedure SAC was dissolved in PBS. Therefore, the tumor group and health control group were fed by oral gavage with PBS. The low SAC group and high SAC group were fed by oral gavage with 240 mg/kg BW/mice/day and 480 mg/kg BW/mice/day which were diluted in PBS. The oral gavage volume of SAC group of each mouse was corrected by body weight at each 7 days. We fed mice by oral gavage everyday and avoid prepare SAC in direct light for 52 days (about 7 weeks).. 3. Animal serum ELISA for MMP-9 and TIMP-1 Materials and reagents DuoSet mouse TIMP-1 ELISA development system kit, DuoSet mouse pro-MMP-9 ELISA development system kit and Tetramethylbenzidine were purchased from R&D (Minneapolis, MN, U.S.A.). NaCl, KCl , Na2HPO4 and KH2PO4 were purchased from J.T. Baker (Phillipsburg, NJ, U.S.A.). Tween 20 was purchased from Sigma (St. Louis, MO, U.S.A.). ELISA 96-well microplate was purchased from costar (U.S.A.). H2SO4 and ELISA reader (TECAN) were also used in this experiment.. 12.
(18) Solutions required PBS for ELISA 137 mM NaCl, 2.7 mM KCl, 8.1 mM Na2HPO4, 1.5 mM KH2PO4 at pH 7.27.4 and autoclaved before to use.. wash buffer 0.05 % Tween 20 in PBS at pH 7.2- 7.4. Procedure 1. The capture antibody was diluted into the working concentration in PBS. 2. ELISA 96-well microplate were coated with 100 μl per well of the working concentration capture antibody. 3. The plate was sealed with a adhesive strip and incubated at room temperature overnight. 4. The next day, we aspirated each well and washed each well with wash buffer by filling each well with 400 μl wash buffer and for a total of three washes by using a autowasher. After the last wash, we removed any remaining wash buffer by aspirating and by inverting the plate and blotting it against clean paper towels. 5. The plate was block with 300 μl block buffer to each well and sealed the plate to incubate at room temperature for 1 hour. 6. We repeated the same wash step (in step 4.) then added 50 μl serum sample (10X dilute for TIMP-1 and 7.5X dilute for pro-MMP-9) or. 13.
(19) standards diluted in reagent diluent to each well and each serum sample or standards were 2 repeat. The plate was covered with a adhesive strip and incubate at room temperature for 2 hours. 7. We repeated the same wash step (in step 4.) then add 100 μl working concentration of the detection antibody diluted in reagent diluent to each well. Cover the plate with a adhesive strip and incubate 2 hours at room temperature. 8. We repeated the same wash step (in step 4.) and avoided adding 100 μl working concentration of the streptavidin-HRP to each well in direct light. The plate was sealed and incubated 20 minutes at room temperature avoid placing in direct light. 9. We repeated the same wash step (in step 4.) and avoided adding 100 μl substrate solution (Tetramethylbenzidine) to each well in direct light. The plate was sealed and incubated 20 minutes at room temperature avoided placing the plate in direct light. 10. We added 50 μl stop solution (2 N H2SO4) to each well the gently tap the plate to ensure through mixing. 11. The optical density of each well was determined immediately by using ELISA reader (TECAN) set to 450 nm.. 4. Western blotting for animal tissue p-Akt, p-mTOR and NF-B (1) Animal tissue protein sample preparation. 14.
(20) Materials and reagents T-PER tissue protein extraction reagent and Protease inhibitor were purchased from PIERCE (Rockford, IL, U.S.A.). Na3VO4 was purchased from Sigma (St. Louis, MO, U.S.A.).. Solutions required T-PER 100 μl Protease inhibitor + 100 μl 2 M Na3VO4 in 10 ml T-PER tissue protein extraction reagent. Procedure 1. We weighed tissue samples. And we used a ratio of 1 g of tissue to 10 ml T-PER. 2. The appropriate amount of T-PER was added to the tissue and homogenize. 3. The tissue samples were sonicated for 30 seconds. The whole procedure was prepared on ice. 4. The samples were centrifuged at 10,000 ×g at 4 ℃ for 10 minutes to pellet. 5. The supernatants were collected carefully and stored at -80 ℃ for further analysis.. 15.
(21) (2) Colorimetric detection and quantitation of total protein Materials and reagents Albumin (BSA) Standards and BCA Protein Assay Kit were purchased from PIERCE (Rockford, IL, U.S.A.). 96 wells plate was purchased from Nunc (DK-4000 Roskilde, Denmark.). The microplate reader used in this experiment is from TECAN.. Procedure 1. To Dilute one Albumin Standard (BSA) ampule into several concentrations (0, 125, 250, 500, 750 and 1000 μg/ml) with d.d. H2O as the standard curves. The albumin Standards were stored at 4 ℃. 2. 25 μl standard curves were added for 2 replicates of each concentration into 96 wells plate. 3. 2 μl protein samples were added with 23 μl d.d. H2O for 2 replicates into 96 wells plate. 4. 200 μl working reagent were added by mixing 50 parts of BCA Reagent A with 1 part of BCA Reagent B (50:1, Reagent A:B) into each well. 5. The plate was incubated at 37 ℃ for 30 minutes. 6. The optical density of each well was determined immediately in 96-well plates by microplate reader set to 570 nm. Protein samples are quantified to 100 μg protein.. 16.
(22) (3) Western blotting analysis Materials and reagents 30% acrylamide, ammonium persulfate (APS), Laemmli sample buffer, Tetramethylethylenediamine (TEMED) and nitrocellulose membranes were purchased from Bio Rad Laboratories (Hercules, CA, U.S.A.). Tris-HCl, Tris-base and Glycine were purchased from J.T. Baker (Phillipsburg, NJ, U.S.A.). Sodium dodecyl sulfate (SDS), 2-mercaptoethanol (2-ME) and Tween 20 were purchased from Sigma (St. Louis, MO, U.S.A.). Methanol was purchased from ECHO (Miaoli 351 Taiwan, R.O.C.) ECL reagent was purchased from visual protein. LAS 4000 system was used to detect protein expression on nitrocellulose membrane.. Solutions required 10 % SDS polyacrylamide gel electrophoresis Upper gel 4.95 % acrylamide, 125 mM Tris-HCl pH 6.8, 0.1 % SDS, 0.1 % APS, 0.1 % TEMED in d.d. H2O. Lower gel 10 % acrylamide, 375 mM Tris-HCl pH 8.8, 0.1 % SDS, 0.1 % APS, 0.05 % TEMED in d.d. H2O. 17.
(23) 6x loading dye 7:3, Laemmli sample buffer: 2-mercaptoethanol. Running buffer 25 mM Tris-base, 198 mM Glycine, 0.1 % SDS in d.d.H2O at pH 8.4. Transfer buffer 48 mM Tris-Base, 39 mM Glycine, 0.037 % SDS, 20 % methanol in d.d.H2O at pH 8.4. TTBS 10 mM Tris-HCl, 150 mM NaCl, 0.1 % Tween 20 in d.d.H2O at pH 8.4. Stripping buffer 200 mM glycine, 1 % Tween 20 and 0.1 % SDS at pH 2.2. ECL reagent 1:1, reagent A: reagent B. Antibodies Cell signaling (Danvers, MA, U.S.A.) p-Akt (1:1000) and NFκB (1:1000). 18.
(24) R&D (Minneapolis, MN, U.S.A.) p-mTOR (1:2000).. Jackson ImmunoReserch (West Grove, PA, U.S.A.) Goat anti-mouse IgG Goat anti-rabbit IgG. Procedure 1. Protein samples are quantified to 100 μg protein and added with 6x loading dye and heated at 90 ℃ for 5 minutes then put on ice immediately before loading. 2. Protein samples are separated in 10% SDS polyacrylamide gel electrophoresis with 6x loading dye and running at 80 V in upper gel and 100 V in lower gel with running buffer. 3. Protein samples were transferred to nitrocellulose membranes with 400 mA for 4 hours in transfer buffer. 4. The membranes are washed with TTBS for 5 minutes then blocked with TTBS contain 5 % non-fat dried milk for 1 hour. 5. The membranes are incubated at 4 ℃ overnight with specific primary antibody diluted in TTBS contain 5 % non-fat dried milk. 6. Before exposing to secondary antibody, the membranes are washed with TTBS 5 minutes repeat for 3 times then incubate at room temperature for at least 1 hour with specific secondary antibody diluted in TTBS. 19.
(25) contained 5 % non-fat dried milk. 7. The membranes are washed with TTBS 5 minutes repeat for 3 times then added ECL reagent to detect protein level expression by using LAS 4000 system to take the pictures of the membranes. 8. The stripping buffer was used when the membranes needed to be deprobed. Before reprobed the next primary antibody, the membranes were washed with stripping buffer 5 minutes repeat for 3 times and then washed with TTBS 5 minutes repeat for 3 times.. 20.
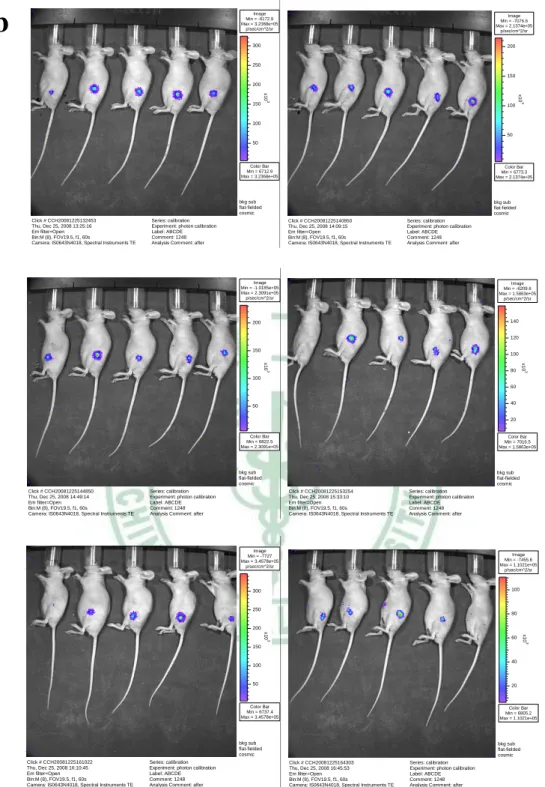
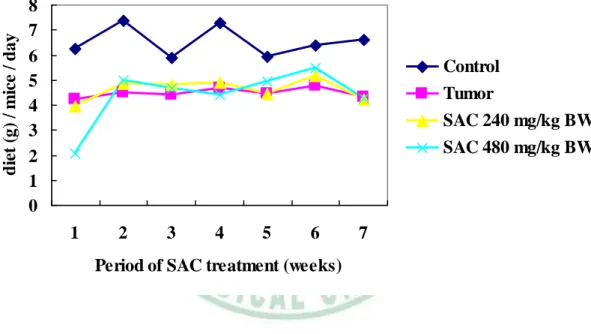
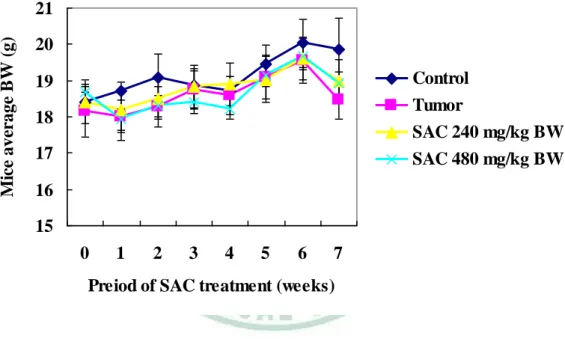
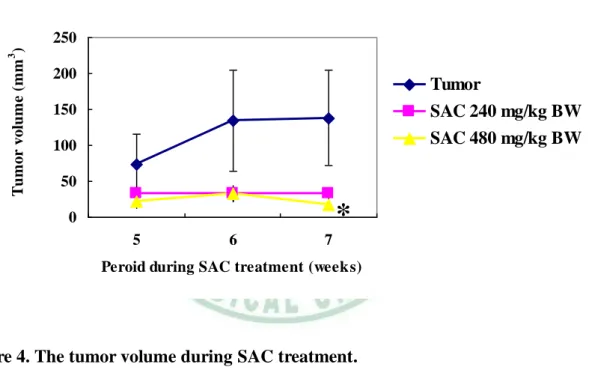
(26) Results SAC suppressed growth of A549 human lung cancer cell xenograft in BALB/c nu/nu nude mice To evaluate the effect of SAC on tumor growth, tumor xenografts were used by implanting A549 cells subcutaneously into the left thigh of mice. After xenograft implantation, the tumor size was observed by Non-invasive in vivo imaging system (IVIS) for 2 weeks. However, the tumor formation was not similar after A549 xenograft implantation in each mouse. Total of 3 mice were not observed the tumor expression. Therefore were not continued the following experiment (Fig.1). The mice were equally and randomly divided into three groups (N=9 for each group) according to their tumor size. The tumor group and health control group was fed by oral gavage with PBS. The low SAC group and high SAC group were fed by oral gavage with 240 mg/kg BW/mice/day and 480 mg/kg BW/mice/day diluted in PBS. During the period of SAC treatment, the diet intake for the first week was lower in high SAC group when compared to other groups. However, the diet intake became normal from the second weeks in high SAC group (Fig.2). During the period of SAC treatment, the initial and final body weights showed no significantly differences in each group when compared to the control group (Fig.3). The tumor volume was substantially smaller than the tumor group mice after SAC oral gavage from 5 to 7 weeks (Fig.4). During SAC treatment, we used Non-invasive in vivo imaging system (IVIS) to observe tumor size. 21.
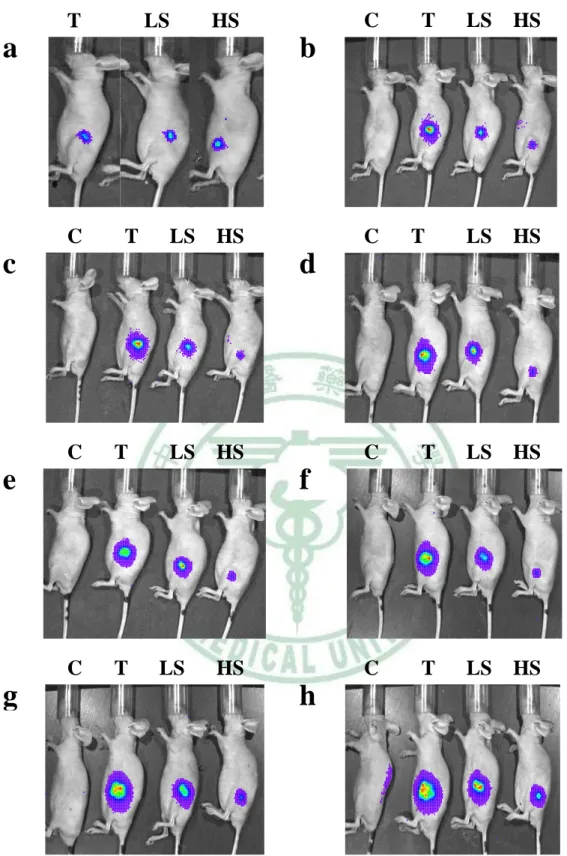
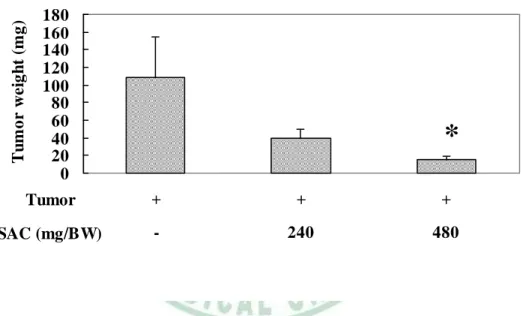
(27) every week. Before SAC treatment, the tumor size was similar. Interestingly, the tumor size was smaller than the tumor group mice after SAC oral gavage since the first week (Fig.5). The mean weight of tumors in SAC treatment group was also significantly lower than the tumor group (Fig.6). Therefore, SAC treatment markedly decreased tumor weight and volume when compared to the tumor group. These results indicated that SAC can reduce tumor formation in BALB/c nu/nu nude mice.. 22.
(28) a. Image Min = -6068.8 Max = 9.8115e+05 p/sec/cm^2/sr. Image Min = -5670.4 Max = 7.7106e+05 p/sec/cm^2/sr. 800 600. 600 x10. x10. 400. 3. 3. 400. 200 200. Color Bar Min = 5478.8 Max = 9.8115e+05. Color Bar Min = 5486.3 Max = 7.7106e+05. bkg sub flat-fielded cosmic Click # CCH20081215123950 Mon, Dec 15, 2008 12:39:53 Em filter=Open Bin:M (8), FOV19.5, f1, 60s Camera: IS0643N4018, Spectral Instruments TE. bkg sub flat-fielded cosmic. Series: calibration Experiment: photon calibration Label: ABCDE Comment: 1248 Analysis Comment: after. Click # CCH20081215131901 Mon, Dec 15, 2008 13:19:04 Em filter=Open Bin:M (8), FOV19.5, f1, 60s Camera: IS0643N4018, Spectral Instruments TE. Series: calibration Experiment: photon calibration Label: ABCDE Comment: 1248 Analysis Comment: after. Image Min = -8432.7 Max = 1.0929e+06 p/sec/cm^2/sr. Image Min = -5899.9 Max = 8.9753e+05 p/sec/cm^2/sr. 1.0. 800. 0.8 600. x10. x10. 0.6. 3. 6. 400 0.4. 200 0.2. Color Bar Min = 5480.7 Max = 1.0929e+06. Color Bar Min = 5523.1 Max = 8.9753e+05. bkg sub flat-fielded cosmic Click # CCH20081215135636 Mon, Dec 15, 2008 13:56:41 Em filter=Open Bin:M (8), FOV19.5, f1, 60s Camera: IS0643N4018, Spectral Instruments TE. bkg sub flat-fielded cosmic. Series: calibration Experiment: photon calibration Label: ABCDE Comment: 1248 Analysis Comment: after. Click # CCH20081215143333 Mon, Dec 15, 2008 14:33:37 Em filter=Open Bin:M (8), FOV19.5, f1, 60s Camera: IS0643N4018, Spectral Instruments TE. Series: calibration Experiment: photon calibration Label: ABCDE Comment: 1248 Analysis Comment: after. Image Min = -5927.9 Max = 1.2624e+06 p/sec/cm^2/sr. Image Min = -6310.8 Max = 1.1988e+06 p/sec/cm^2/sr. 1.2. 1.2. 1.0. 1.0. 0.8. 0.8. 0.4. 0.4. 0.2. 0.2. Color Bar Min = 6312.2 Max = 1.2624e+06. Color Bar Min = 5994.2 Max = 1.1988e+06. bkg sub flat-fielded cosmic. bkg sub flat-fielded cosmic Click # CCH20081215150916 Mon, Dec 15, 2008 15:09:20 Em filter=Open Bin:M (8), FOV19.5, f1, 60s Camera: IS0643N4018, Spectral Instruments TE. Series: calibration Experiment: photon calibration Label: ABCDE Comment: 1248 Analysis Comment: after. 6. 6. 0.6. x10. x10. 0.6. Click # CCH20081215154423 Mon, Dec 15, 2008 15:44:26 Em filter=Open Bin:M (8), FOV19.5, f1, 60s Camera: IS0643N4018, Spectral Instruments TE. 23. Series: calibration Experiment: photon calibration Label: ABCDE Comment: 1248 Analysis Comment: after.
(29) b. Image Min = -6172.9 Max = 3.2368e+05 p/sec/cm^2/sr. Image Min = -7076.6 Max = 2.1374e+05 p/sec/cm^2/sr. 300. 200. 250 150. 200. 100. 3. 3. x10. x10. 150. 100 50. 50. Color Bar Min = 6712.9 Max = 3.2368e+05. Color Bar Min = 6773.3 Max = 2.1374e+05. bkg sub flat-fielded cosmic Click # CCH20081225132453 Thu, Dec 25, 2008 13:25:16 Em filter=Open Bin:M (8), FOV19.5, f1, 60s Camera: IS0643N4018, Spectral Instruments TE. bkg sub flat-fielded cosmic. Series: calibration Experiment: photon calibration Label: ABCDE Comment: 1248 Analysis Comment: after. Click # CCH20081225140850 Thu, Dec 25, 2008 14:09:15 Em filter=Open Bin:M (8), FOV19.5, f1, 60s Camera: IS0643N4018, Spectral Instruments TE. Series: calibration Experiment: photon calibration Label: ABCDE Comment: 1248 Analysis Comment: after. Image Min = -1.0185e+05 Max = 2.3091e+05 p/sec/cm^2/sr. Image Min = -6209.6 Max = 1.5863e+05 p/sec/cm^2/sr. 140. 200. 120. 150. 100. 3. 3. x10. x10. 80. 100 60 40. 50. 20. Color Bar Min = 6822.5 Max = 2.3091e+05. Color Bar Min = 7016.5 Max = 1.5863e+05. bkg sub flat-fielded cosmic Click # CCH20081225144850 Thu, Dec 25, 2008 14:49:14 Em filter=Open Bin:M (8), FOV19.5, f1, 60s Camera: IS0643N4018, Spectral Instruments TE. bkg sub flat-fielded cosmic. Series: calibration Experiment: photon calibration Label: ABCDE Comment: 1248 Analysis Comment: after. Click # CCH20081225153254 Thu, Dec 25, 2008 15:33:10 Em filter=Open Bin:M (8), FOV19.5, f1, 60s Camera: IS0643N4018, Spectral Instruments TE. Series: calibration Experiment: photon calibration Label: ABCDE Comment: 1248 Analysis Comment: after. Image Min = -7727 Max = 3.4578e+05 p/sec/cm^2/sr. Image Min = -7455.6 Max = 1.1021e+05 p/sec/cm^2/sr. 100. 300. 250. 80. 200 3. x10. x10. 60. 3. 150 40. 100. 50. 20. Color Bar Min = 6737.4 Max = 3.4578e+05. Color Bar Min = 6805.2 Max = 1.1021e+05. bkg sub flat-fielded cosmic Click # CCH20081225161022 Thu, Dec 25, 2008 16:10:45 Em filter=Open Bin:M (8), FOV19.5, f1, 60s Camera: IS0643N4018, Spectral Instruments TE. bkg sub flat-fielded cosmic. Series: calibration Experiment: photon calibration Label: ABCDE Comment: 1248 Analysis Comment: after. Click # CCH20081225164303 Thu, Dec 25, 2008 16:45:53 Em filter=Open Bin:M (8), FOV19.5, f1, 60s Camera: IS0643N4018, Spectral Instruments TE. Series: calibration Experiment: photon calibration Label: ABCDE Comment: 1248 Analysis Comment: after. Figure 1. The tumor formation after A549 xenograft implantation for 1 and 2 weeks. (a) The tumor size expressed after A549 xenograft implantation for 1 week. (b) The tumor size expressed after A549 xenograft implantation for 2 weeks.. 24.
(30) diet (g) / mice / day. 8 7 6 5 4 3 2 1 0. Control Tumor SAC 240 mg/kg BW SAC 480 mg/kg BW. 1. 2. 3. 4. 5. 6. 7. Period of SAC treatment (weeks). Figure 2. The average dietary intake during SAC treatment.. 25.
(31) Mice average BW (g). 21 20 Control Tumor SAC 240 mg/kg BW SAC 480 mg/kg BW. 19 18 17 16 15 0. 1. 2. 3. 4. 5. 6. 7. Preiod of SAC treatment (weeks). Figure 3. The average body weight during SAC treatment. Values are expressed as mean ± SEM.. 26.
(32) Tumor volume (mm 3 ). 250 200. Tumor. 150. SAC 240 mg/kg BW SAC 480 mg/kg BW. 100 50. *. 0 5. 6. 7. Peroid during SAC treatment (weeks). Figure 4. The tumor volume during SAC treatment. One way ANOVA was used to compare the differences. Values are expressed as mean ± SEM. *: Statistically significant differences compared with tumor group (P<0.05).. 27.
(33) T. Image Min = -1.0185e+05 Max = 2.3091e+05 p/sec/cm^2/sr. LS. C. HS. a. Image Min = -7076.6 Max = 2.1374e+05 p/sec/cm^2/sr. T. b. LS. HS. Image Min = -1.0185e+05 Max = 2.3091e+05 Image p/sec/cm^2/sr Min = -7716.4 Max = 8.3349e+05 p/sec/cm^2/sr. 200. 800. 200. 200. 150. 600. 150. 150. 3. x10. 3. 400. x10. x10. x10. 3. 3. 100. 100. 100. 200. C. T. LS. HS 50. c. Image Min = -5442.8 Max = 9.8915e+05 p/sec/cm^2/sr. C. 50. T. LS. HS. d. Color Bar Min = 5410.9 Max = 8.3349e+05. 2.0 Color Bar Min = 6822.5 Max = 2.3091e+05. Color Bar Min = 6773.3 Max = 2.1374e+05. 800. Color Bar Min = 6822.5 Max = 2.3091e+05. Image Min = -6183.4 Max = 2.3898e+06 50p/sec/cm^2/sr. bkg sub flat-fielded 1.5 cosmic. 600 x10. Series: calibration. 3. bkg sub Experiment: photon calibration flat-fieldedLabel: ABCDE Bin:M (8), FOV19.5, f1, 60s Comment: 1248 cosmic Camera: IS0643N4018, Spectral Instruments TE Analysis Comment: after. x10. Click # CCH20090105161630 Mon, Jan 05, 2009 16:16:57 Em filter=Open 400. Click # CCH20081225140850 Series: calibration Click # CCH20081225144850 Series: calibration Thu, Dec 25, 2008 14:09:15 Experiment: photon calibration 200 Thu, Dec 25, 2008 14:49:14 Experiment: photon calibration Em filter=Open Label: ABCDE Em filter=Open Label: ABCDE Bin:M (8), FOV19.5, f1, 60s Comment: 1248 Bin:M (8), FOV19.5, f1, 60s Comment: 1248 Camera: IS0643N4018, Spectral Instruments TE Analysis Comment: after Image Camera: IS0643N4018, Spectral Instruments TE Analysis Comment: after. CH20081225144850 25, 2008 14:49:14 Open FOV19.5, f1, 60s S0643N4018, Spectral Instruments TE. C. T. LS. HS. e. Min Bar = -5702.4 Color Max==5367 3.9652e+06 Min Max = p/sec/cm^2/sr 9.8915e+05. C. bkg sub flat-fielded1.0 cosmic. Series: calibration Experiment: photon calibration Label: ABCDE Comment: 1248 Analysis Comment: after. T. LS. 0.5 Image Min = -7089.2 Max = 4.1102e+06 p/sec/cm^2/sr. HS. Color 4 Bar Min = 11949 Max = 2.3898e+06. f bkg sub flat-fielded cosmic 3 Series: LPS20090106 check Experiment: 6-10 Label: Comment: Analysis Comment:. 3. bkg sub flat-fielded cosmic 6. Series: LPS20090106 check Experiment: 6-10 Label: Comment: Analysis Comment:. 2. 1. 1. C. T. LS. HS. Image Min = -5327.1 Color Bar Max = 2.5203e+06 Min = 19826 p/sec/cm^2/sr. C. T. LS. HS. Max = 3.9652e+06. g. h. Image Min = -5318.1 M a x = Color 3 . 0 Bar 105e+06 Min = 20551 p / Max s e c=/ 4.1102e+06 cm^2/sr. 3.0. 2.5. bkg sub flat-fielded 2.0 cosmic. 1.5. Click # CCH20090203152226 Tue, Feb 03, 2009 15:22:57 Em filter=Open Bin:M (8), FOV19.5, f1, 60s Camera: IS0643N4018, Spectral Instruments TE. Series: LPS20090106 check Experiment: 6-10 Label: Comment: Analysis Comment:. 2.0. 6. 6. 1.5. x 1 0. Series: LPS20090106 check Experiment: 6-10 Label: Comment: Analysis Comment:. bkg sub 2.5 flat-fielded cosmic. x10. Click # CCH20090124161045 Sat, Jan 24, 2009 16:11:13 Em filter=Open Bin:M (8), FOV19.5, f1, 60s Camera: IS0643N4018, Spectral Instruments TE. 6. Click # CCH20090119165255 Mon, Jan 19, 2009 16:53:23 Em filter=Open Bin:M (8), FOV19.5, f1, 60s Camera: IS0643N4018, Spectral Instruments TE. x10. 2. x10. Click # CCH20090112165154 Mon, Jan 12, 2009 16:52:22 Em filter=Open Bin:M (8), FOV19.5, f1, 60s Camera: IS0643N4018, Spectral Instruments TE. 6. bkg sub flat-fielded cosmic. 1.0 1.0 0.5. 0.5. Figure 5. The growth of A549 tumor in nude mice xenografts model during SAC treatment. (a) The tumor size before SAC treatment. (b) After 1 week (c) After 2 weeks Color Bar Color Bar Min = 12601 Min = 15053 = 2.5203e+06 (g) After 6 weeks (h) After 7 weeks Max = 3.0105e+06 (d) After 3 weeks (e) After 4 weeks (f) After 5Maxweeks of SAC treatment. bkg sub. bkg sub. flat-fielded flat-fielded C, control group. T, tumor group. LS, SAC 240 cosmic mg/BW/day. HS, SAC 480 mg/BW/day. cosmic Click # CCH20090210155853 Tue, Feb 10, 2009 15:59:17 Em filter=Open Bin:M (8), FOV19.5, f1, 60s Camera: IS0643N4018, Spectral Instruments TE. Series: 11111 Experiment: 22222 Label: 33333 Comment: 44444 Analysis Comment: 555555. Click # CCH20090216163727 Series: 11111 Mon, Feb 16, 2009 16:37:49 Experim ent: 22222 Em filter=Open Label: 33333 Bin:M (8), FOV19.5, f1, 60s Comment: 44444 C a m e r a : I S 0 6 4 3 N 4 0 1 8 , S p e c t r a l I nAsnt ar ul yms ei sn t Cs oTmEm e n t : 5 5 5 5 5 5. 28.
(34) Tumor weight (mg). 180 160 140 120 100 80 60 40 20 0. *. Tumor. +. +. +. SAC (mg/BW). -. 240. 480. Figure 6. The mean weight of tumors after SAC treatment. One way ANOVA was used to compare the differences. Values are expressed as mean ± SEM. *: Statistically significant differences compared with tumor group (P<0.05).. 29.
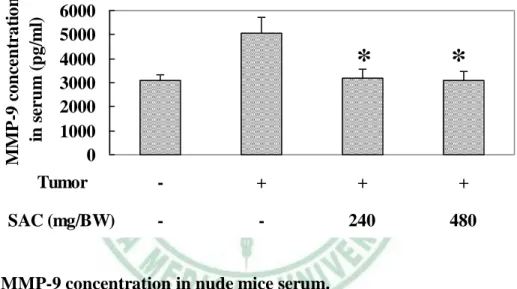
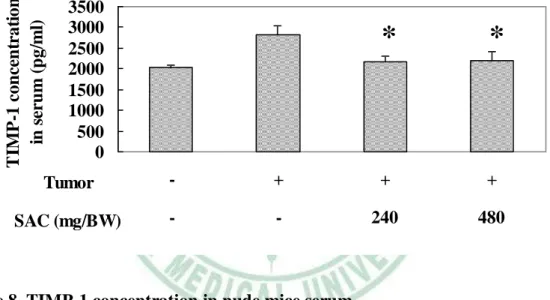
(35) The serum levels of MMP-9 and TIMP-1 were decreased by SAC treatment. Matrix metalloproteinase-9 (MMP-9) was one type of the gelatinases (Jinga et al., 2006). MMP-9 was the most involved in tumor initiation, growth and metastasis (Duffy et al., 2000). Studies also indicated that MMP-9 is required for tumor progression (Bergers et al., 2000). In this study, the serum levels of MMP-9 were higher in tumor group mice when compared with health control mice. However, the serum MMP-9 levels were decreased in SAC-treated mice when compared with tumor group mice. Furthermore, the serum levels of MMP-9 in SAC-treated mice and control mice were similar (Fig.7). Tissue inhibitors of metalloproteinases (TIMPs) are important controlling factors of MMPs in normal and disease processes. TIMP-1 appeared to be the major inhibitor of MMP-9. However, many studies also suggested that TIMP-1 stimulated the growth of several cancer cell lines (Hayakawa et al., 1992; Porter et al., 2004). In our study, the serum levels of TIMP-1 were higher in tumor group mice. However, the serum TIMP-1 levels were decreased after administration of SAC. Furthermore, the serum levels of TIMP-1 in SAC group mice and control group mice were similar (Fig.8). The balance between MMPs and TIMPs is tightly regulated. The abnormal MMP-9/TIMP-1 balance influenced breast tumor growth (Jinga et al., 2006). Our results also showed that the ratio of MMP-9/TIMP-1 was higher in tumor group mice. And the ratio of MMP-9/TIMP-1 was decreased after administration of SAC (Fig.9).. 30.
(36) MMP-9 concentration in serum (pg/ml). 6000 5000 4000 3000 2000 1000 0 Tumor. -. SAC (mg/BW). -. *. *. +. +. +. -. 240. 480. Figure 7. MMP-9 concentration in nude mice serum. Student’s t-test was used to compare the differences. Values are expressed as mean ± SEM. *: Statistically significant differences compared with tumor group (P<0.05).. 31.
(37) TIMP-1 concentration in serum (pg/ml). 3500 3000 2500 2000 1500 1000 500 0. *. *. Tumor. -. +. +. +. SAC (mg/BW). -. -. 240. 480. Figure 8. TIMP-1 concentration in nude mice serum. Student’s t-test was used to compare the differences. Values are expressed as mean ± SEM. *: Statistically significant differences compared with tumor group (P<0.05).. 32.
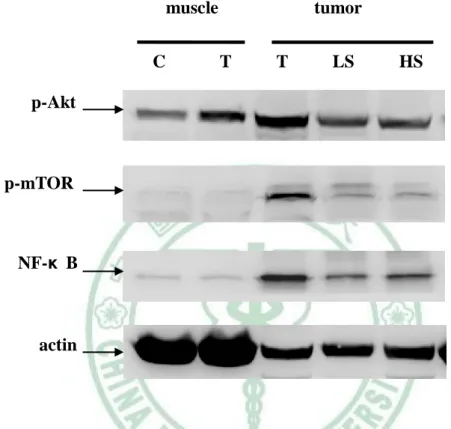
(38) SAC treatment influenced p-Akt and its downstream expression in vivo The AKT signaling pathway plays an important role in the regulation of cancer cell proliferation and survival. In our study, SAC treatment decreased the phosphorylation level of Akt in tumor section when compared to the tumor group. The expression of Akt downstream proteins included p-mTOR and NK-κ B was also decreased by SAC treatment in tumor section. Interestingly, the expression of p-Akt in muscle was also higher in tumors group when compared to the control group (Fig.10). These results indicated that SAC treatment decreased p-Akt and its downstream expression to reduce A549 lung cancer cell proliferation in vivo.. 33.
(39) muscle C. tumor T. T. LS. HS. p-Akt. p-mTOR. NF-κ B. actin. Figure 9. SAC treatment influenced p-Akt and its downstream expression in vivo. C, control group. T, tumor group. LS, SAC 240 mg/BW/day. HS, SAC 480 mg/BW/day.. 34.
(40) Discussion This study was designed to evaluate the in vivo anticancer potential of SAC in A549 human non small cell lung cancer. Our results showed that SAC could suppress the growth of A549 human lung cancer cells in nude mice xenograft model. These results showed that SAC has anticancer potential on A549 cancer cells. Aged garlic extract (AGE) is aged for up to 20 months. The odorous and harsh compounds in garlic are converted naturally into more stable and safe sulfur compounds after aging (Amagase et al., 2001). However, the diet intake was lower than the other group in the first week in high SAC group. And the diet intake was returned to normal form the second week. Therefore, SAC its special odor may influence appetite of mice. However, the effect of SAC on appetite could be adapted by mice from the second week. There were no toxic symptoms even at a high dose level of 2000 mg AGE/kg BW in Wistar rats for 6 months (Sumiyoshi et al., 1984). There was also a high dose of 1000 mg SAC/kg BW/day in prostate cancer nude mice xenograft model with no detectable toxic effect on nude mice (Chu et al., 2007). In our study, the high SAC group was administrated with 480 mg SAC/kg BW. Therefore, the dosage of SAC which used in our study was within the safety range. In our studies, SAC treatment significantly decreased MMP-9 levels in serum. Studies indicated that MMP-9 is required for tumor progression (Bergers et al., 2000). Recent studies extended a role for MMPs during. 35.
(41) multiple stages of tumor progression to include other functions such as growth, angiogenesis, migration and invasion (McCawley and Matrisian, 2000). Our study also showed that SAC inhibited A549 tumor growth in nude mice xenograft model. Therefore, SAC may be inhibited tumor progression through influenced MMP-9 expression. Our results showed that SAC treatment could reduce NF-kB levels in vivo. The expression of MMP-9 is partly controlled by NF-kB (Moon et al., 2004). The levels of Akt phosphorylation in tumor tissues were decreased by SAC treatment. The expresion of NF-κB is partly controlled by Akt pathway (David et al., 2004). Therefore, SAC may be regulated MMP-9 via Akt/NF-κB pathway and then inhibited A549 lung tumor growth. The balance between MMPs and TIMPs is tightly regulated. Tissue inhibitor of metalloproteinase-1 (TIMP-1) appeared to be the major inhibitor of MMP-9. However, TIMP-1 also stimulates proliferation of human cancer cells by inhibiting a metalloproteinase (Porter et al., 2004). In some studies, high expression of TIMP-1 in some cancer patients is linked to a poor prognosis (McCarthy et al., 1999; Porter et al., 2005; Ree et al., 1997). One possibility is that TIMP-1 prevents the degradation of a newly synthesised growth factor by a constitutively active metalloproteinases (McCawley and Matrisian, 2001). A more speculative mechanism would be TIMP-1 acts by binding to a membrane-type MMP and causing the activation of a signal transduction pathway. This proposed pathway could lead to the upregulation of growth factor genes or the downregulation of growth inhibitor genes (Baker et al., 2002; Lehti et al., 2000; Lehti et al., 2002; Porter et al., 2005).. 36.
(42) In our study, SAC treatment not only decreased MMP-9 levels but also reduced TIMP-1 levels in serum. One possibility is that SAC could also inhibit A549 tumor growth through reduced TIMP-1 levels. The activation of the Akt/NF-κB cell survival pathway occurs early during human lung tumorigenesis (David et al., 2004). Therefore, the inhibition of Akt pathway by using chemopreventive agents may prevent tumor progression. mTOR plays a important role in cellular growth and homeostasis (Brown et al., 1994). Patients with biliary tract adenocarcinoma and p-mTOR-positive tumors have a significantly shorter overall survival than patients with p-mTOR-negative tumors (Herberger et al., 2007). Previous studies have shown that decreasing activation of NF-κ B inhibited the proliferation of several cancer cell lines (Ban et al., 2009; Wang et al., 2003). In Our results showed that SAC treatment decreased the phosphorylation levels of Akt and its downstream p-mTOR and NF-κB expression in vivo. These results suggested the anticancer ability of SAC is through inhibition of Akt pathway and its downstream p-mTOR and NF-κB. These data indicated that SAC treatment could influence MMP-9 expression and SAC may be influenced A549 tumor growth through mediated p-Akt/p-mTOR pathway in A549 cells. These results suggested the SAC anticancer potential on A549 lung cancer cells.. 37.
(43) References Amagase,H., Petesch,B.L., Matsuura,H., Kasuga,S., and Itakura,Y. (2001) Intake of garlic and its bioactive components. J Nutr 131: 955S-962S. Amin,A.R., Kucuk,O., Khuri,F.R., and Shin,D.M. (2009) Perspectives for cancer prevention with natural compounds. J Clin Oncol 27: 2712-2725. Baker,A.H., Edwards,D.R., and Murphy,G. (2002) Metalloproteinase inhibitors: biological actions and therapeutic opportunities. J Cell Sci 115: 3719-3727. Balsara,B.R., Pei,J., Mitsuuchi,Y., Page,R., Klein-Szanto,A., Wang,H. et al. (2004) Frequent activation of AKT in non-small cell lung carcinomas and preneoplastic bronchial lesions. Carcinogenesis 25: 2053-2059. Ban,J.O., Oh,J.H., Hwang,B.Y., Moon,D.C., Jeong,H.S., Lee,S. et al. (2009) Inflexinol inhibits colon cancer cell growth through inhibition of nuclear factor-kappaB activity via direct interaction with p50. Mol Cancer Ther 8: 1613-1624. Beliveau,R. and Gingras,D. (2007) Role of nutrition in preventing cancer. Can Fam Physician 53: 1905-1911. Bergers,G., Brekken,R., McMahon,G., Vu,T.H., Itoh,T., Tamaki,K. et al. (2000) Matrix metalloproteinase-9 triggers the angiogenic switch during carcinogenesis. Nat Cell Biol 2: 737-744. Brown,E.J., Albers,M.W., Shin,T.B., Ichikawa,K., Keith,C.T., Lane,W.S., and Schreiber,S.L. (1994) A mammalian protein targeted by G1-arresting rapamycin-receptor complex. Nature 369: 756-758. Chu,Q., Lee,D.T., Tsao,S.W., Wang,X., and Wong,Y.C. (2007) S-allylcysteine, a water-soluble garlic derivative, suppresses the growth of a human androgen-independent prostate cancer xenograft, CWR22R, under in vivo conditions. BJU Int 99: 925-932. Chuah,S.C., Moore,P.K., and Zhu,Y.Z. (2007) S-allylcysteine mediates cardioprotection in an acute myocardial infarction rat model via a hydrogen sulfide-mediated pathway. Am J Physiol Heart Circ Physiol 293: H2693-H2701. Chung,L.Y. (2006) The antioxidant properties of garlic compounds: allyl cysteine, alliin, allicin, and allyl disulfide. J Med Food 9: 205-213.. 38.
(44) Cinti,C., Vindigni,C., Zamparelli,A., La,S.D., Epistolato,M.C., Marrelli,D. et al. (2008) Activated Akt as an indicator of prognosis in gastric cancer. Virchows Arch 453: 449-455. David,O., Jett,J., LeBeau,H., Dy,G., Hughes,J., Friedman,M., and Brody,A.R. (2004) Phospho-Akt overexpression in non-small cell lung cancer confers significant stage-independent survival disadvantage. Clin Cancer Res 10: 6865-6871. Duffy,M.J., Maguire,T.M., Hill,A., McDermott,E., and O'Higgins,N. (2000) Metalloproteinases: role in breast carcinogenesis, invasion and metastasis. Breast Cancer Res 2: 252-257. Gapter,L.A., Yuin,O.Z., and Ng,K.Y. (2008) S-Allylcysteine reduces breast tumor cell adhesion and invasion. Biochem Biophys Res Commun 367: 446-451. Graff,J.R., Konicek,B.W., McNulty,A.M., Wang,Z., Houck,K., Allen,S. et al. (2000) Increased AKT activity contributes to prostate cancer progression by dramatically accelerating prostate tumor growth and diminishing p27Kip1 expression. J Biol Chem 275: 24500-24505. Greenlee,R.T., Hill-Harmon,M.B., Murray,T., and Thun,M. (2001) Cancer statistics, 2001. CA Cancer J Clin 51: 15-36. Gupta,V.B. and Rao,K.S. (2007) Anti-amyloidogenic activity of S-allyl-L-cysteine and its activity to destabilize Alzheimer's beta-amyloid fibrils in vitro. Neurosci Lett 429: 75-80. Hayakawa,T., Yamashita,K., Tanzawa,K., Uchijima,E., and Iwata,K. (1992) Growth-promoting activity of tissue inhibitor of metalloproteinases-1 (TIMP-1) for a wide range of cells. A possible new growth factor in serum. FEBS Lett 298: 29-32. Herberger,B., Puhalla,H., Lehnert,M., Wrba,F., Novak,S., Brandstetter,A. et al. (2007) Activated mammalian target of rapamycin is an adverse prognostic factor in patients with biliary tract adenocarcinoma. Clin Cancer Res 13: 4795-4799. Hsing,A.W., Chokkalingam,A.P., Gao,Y.T., Madigan,M.P., Deng,J., Gridley,G., and Fraumeni,J.F., Jr. (2002) Allium vegetables and risk of prostate cancer: a population-based study. J Natl Cancer Inst 94: 1648-1651. Jinga,D.C., Blidaru,A., Condrea,I., Ardeleanu,C., Dragomir,C., Szegli,G. et al. (2006). 39.
(45) MMP-9 and MMP-2 gelatinases and TIMP-1 and TIMP-2 inhibitors in breast cancer: correlations with prognostic factors. J Cell Mol Med 10: 499-510. Kodera,Y., Suzuki,A., Imada,O., Kasuga,S., Sumioka,I., Kanezawa,A. et al. (2002) Physical, chemical, and biological properties of s-allylcysteine, an amino acid derived from garlic. J Agric Food Chem 50: 622-632. Lampe,J.W. (2009) Interindividual differences in response to plant-based diets: implications for cancer risk. Am J Clin Nutr 89: 1553S-1557S. Lawlor,M.A. and Alessi,D.R. (2001) PKB/Akt: a key mediator of cell proliferation, survival and insulin responses? J Cell Sci 114: 2903-2910. Lehti,K., Lohi,J., Juntunen,M.M., Pei,D., and Keski-Oja,J. (2002) Oligomerization through hemopexin and cytoplasmic domains regulates the activity and turnover of membrane-type 1 matrix metalloproteinase. J Biol Chem 277: 8440-8448. Lehti,K., Valtanen,H., Wickstrom,S.A., Lohi,J., and Keski-Oja,J. (2000) Regulation of membrane-type-1 matrix metalloproteinase activity by its cytoplasmic domain. J Biol Chem 275: 15006-15013. McCarthy,K., Maguire,T., McGreal,G., McDermott,E., O'Higgins,N., and Duffy,M.J. (1999) High levels of tissue inhibitor of metalloproteinase-1 predict poor outcome in patients with breast cancer. Int J Cancer 84: 44-48. McCawley,L.J. and Matrisian,L.M. (2000) Matrix metalloproteinases: multifunctional contributors to tumor progression. Mol Med Today 6: 149-156. McCawley,L.J. and Matrisian,L.M. (2001) Matrix metalloproteinases: they're not just for matrix anymore! Curr Opin Cell Biol 13: 534-540. Moon,S.K., Cha,B.Y., and Kim,C.H. (2004) ERK1/2 mediates TNF-alpha-induced matrix metalloproteinase-9 expression in human vascular smooth muscle cells via the regulation of NF-kappaB and AP-1: Involvement of the ras dependent pathway. J Cell Physiol 198: 417-427. Mori,T. and Sairenji,T. (2006) Functional role of phosphatidylinositol 3-kinase/Akt pathway on cell growth and lytic cycle of Epstein-Barr virus in the Burkitt's lymphoma cell line, P3HR-1. Virus Genes 32: 327-334.. 40.
(46) Nagae,S., Ushijima,M., Hatono,S., Imai,J., Kasuga,S., Matsuura,H. et al. (1994) Pharmacokinetics of the garlic compound S-allylcysteine. Planta Med 60: 214-217. Porter,J.F., Sharma,S., Wilson,D.L., Kappil,M.A., Hart,R.P., and Denhardt,D.T. (2005) Tissue inhibitor of metalloproteinases-1 stimulates gene expression in MDA-MB-435 human breast cancer cells by means of its ability to inhibit metalloproteinases. Breast Cancer Res Treat 94: 185-193. Porter,J.F., Shen,S., and Denhardt,D.T. (2004) Tissue inhibitor of metalloproteinase-1 stimulates proliferation of human cancer cells by inhibiting a metalloproteinase. Br J Cancer 90: 463-470. Ree,A.H., Florenes,V.A., Berg,J.P., Maelandsmo,G.M., Nesland,J.M., and Fodstad,O. (1997) High levels of messenger RNAs for tissue inhibitors of metalloproteinases (TIMP-1 and TIMP-2) in primary breast carcinomas are associated with development of distant metastases. Clin Cancer Res 3: 1623-1628. Romashkova,J.A. and Makarov,S.S. (1999) NF-kappaB is a target of AKT in anti-apoptotic PDGF signalling. Nature 401: 86-90. Schlieman,M.G., Fahy,B.N., Ramsamooj,R., Beckett,L., and Bold,R.J. (2003) Incidence, mechanism and prognostic value of activated AKT in pancreas cancer. Br J Cancer 89: 2110-2115. Sheela,C.G., Kumud,K., and Augusti,K.T. (1995) Anti-diabetic effects of onion and garlic sulfoxide amino acids in rats. Planta Med 61: 356-357. Sumiyoshi,H., Kanezawa,A., Masamoto,K., Harada,H., Nakagami,S., Yokota,A. et al. (1984) [Chronic toxicity test of garlic extract in rats]. J Toxicol Sci 9: 61-75. Tang,F.Y., Chiang,E.P., Chung,J.G., Lee,H.Z., and Hsu,C.Y. (2009) S-Allylcysteine modulates the expression of E-cadherin and inhibits the malignant progression of human oral cancer (in press). J Nutr Biochem. Thomson,M. and Ali,M. (2003) Garlic [Allium sativum]: a review of its potential use as an anti-cancer agent. Curr Cancer Drug Targets 3: 67-81. Vestey,S.B., Sen,C., Calder,C.J., Perks,C.M., Pignatelli,M., and Winters,Z.E. (2005) Activated Akt expression in breast cancer: correlation with p53, Hdm2 and patient outcome. Eur J Cancer 41: 1017-1025.. 41.
(47) Wang,J., Huang,Q., and Chen,M. (2003) The role of NF-kappaB in hepatocellular carcinoma cell. Chin Med J (Engl ) 116: 747-752. Yan,S.L. and Yin,M.C. (2007) Protective and alleviative effects from 4 cysteine-containing compounds on ethanol-induced acute liver injury through suppression of oxidation and inflammation. J Food Sci 72: S511-S515. Zhang,Q.F., Huang,Q., Liu,N., Jiang,L.L., Qiu,X.S., and Wang,E.H. (2008) [Effects of heparanase inhibition by RNA interference on proliferation, invasiveness and apoptosis of lung cancer cells]. Zhonghua Bing Li Xue Za Zhi 37: 826-830.. 42.
(48) Appendix 10 % SDS polyacrylamide gel electrophoresis for western Upper gel (4.95 % acrylamide, 125 mM Tris-HCl pH 6.8, 0.1 % SDS, 0.1 % APS, 0.1 % TEMED in d.d. H2O ) 30 % acrylamide 0.5 M Tris-HCl pH 6.8 10 % SDS 10 % APS TEMED d.d. H2O. 335 250 20 20 2 1350. μl μl μl μl μl μl. Lower gel (10 % acrylamide, 375 mM Tris-HCl pH 8.8, 0.1 % SDS, 0.1 % APS, 0.05 % TEMED in d.d. H2O ) 30 % acrylamide 1.5 M Tris-HCl pH 8.8 10 % SDS 10 % APS TEMED d.d. H2O. 1650 1250 50 75 2.5 1974.5. μl μl μl μl μl μl. Standard curves preparation Standard curves (μg/ml) 125 250 500 750 1000. BSA 2000 μg/ml (μl) 12.5 25 50 75 100. 43. d.d.H2O (μl) 187.5 175 150 125 100.
(49) 6x loading dye for western (7:3, Laemmli sample buffer: 2-mercaptoethanol) Laemmli sample buffer 2-mercaptoethanol. 700 μl 300 μl. Running buffer (25 mM Tris-base, 198 mM Glycine, 0.1 % SDS in d.d.H2O at pH 8.4) Tris-base 3g Glycine 14.7 g 10 % SDS 10 ml d.d. H2O to 1 L (pH=8.4). Transfer buffer (48 mM Tris-Base, 39 mM Glycine, 0.037 % SDS, 20 % methanol in d.d.H2O at pH 8.4) Tris-base 5.8 g Glycine 2.9 g 10 % SDS 3.7 ml methanol 200 ml d.d. H2O to 1 L (pH=8.4). TTBS (10 mM Tris-HCl, 150 mM NaCl, 0.1 % Tween 20 in d.d.H2O at pH 8.4) 1 M Tris-HCl 10 ml 5 M NaCl 30 ml Tween 20 1 ml d.d. H2O to 1 L (pH=8.4). 44.
(50) Stripping buffer (200 mM glycine, 1 % Tween 20 and 0.1 % SDS at pH 2.2) Glycine 1.5 g Tween 20 1 ml 10 % SDS 1 ml d.d. H2O to 100 ml (pH=2.2). PBS for ELISA (137 mM NaCl, 2.7 mM KCl, 8.1 mM Na2HPO4, 1.5 mM KH2PO4 at pH 7.2- 7.4 and autoclaved before to use.) NaCl 8g KCl 0.201 g Na2HPO4 1.149 g KH2PO4 0.204 g d.d. H2O to 1 L (pH=7.2- 7.4). wash buffer for ELISA (0.05 % Tween 20 in PBS at pH 7.2- 7.4) NaCl 8g KCl 0.201 g Na2HPO4 1.149 g KH2PO4 0.204 g d.d. H2O to 1 L (pH=7.2- 7.4) Tween 20 500 μl. 45.
(51)
數據
+6
Outline
相關文件
the lymphocyte function-associated antigen 1, or LFA-1, was so named because antibodies recognizing this structure interfere with lymphocyte cell adhesion events and
本案件為乳癌標準化化學藥物治療與個人化化學治 療處方手術前化學治療療效比較之國內多中心研 究,於 2008 年 8 月 1 日由
一項第二期、隨機、雙盲、安慰劑對照試驗,評估鐳-223 二氯 化合物併用諾曼癌素 (exemestane) 及癌伏妥 (everolimus),對 照安慰劑併用諾曼癌素及癌伏妥,用於罹患轉移性
10 SF12259A 黃文豊 一項隨機分配、開放性、多中心臨床 試驗,對於先前未接受過治療的 CD20 表面抗原陽性之瀰漫性大型 B 細胞淋 巴瘤或 CD20 表面抗原陽性之濾泡性
SF11310 張基晟 比較 Ipilimumab 加上 Etoposide/Platinum 與 Etoposide/Platinum
評估以 S-649266 或最佳現有療法進行治療罹患抗 Carbapenem 革蘭氏陰性菌感染的患者的臨床結果 (包括詴驗用藥 S-649266
第一期至第三期 實體癌,經標準 治療無效;癌症 別:上皮性卵巢 癌、肺癌、肝 癌、乳癌、大腸 直腸癌、胰臟癌. 長聖國際生
提高免疫力上有良好的功效。可治 療糖尿病血管併發症及扁平疣、傳染性疣。在動物 試驗中,利用環磷醯胺製出免
