奈米碳管化學表面改質應用於直接甲醇燃料電池陰極電極之研究
89
0
0
全文
(2) 奈米碳管化學表面改質應用於直接甲醇燃料電池 陰極電極之研究 Study of Chemical Surface Modifications of CNTs as cathode electrode for DMFC 研 究 生:莊方慈. Student:Fang-Tzu Chuang. 指導教授:陳家富 教授. Advisor:Prof.Chia-Fu Chen. 國立交通大學 材料科學與工程研究所 碩士論文. A Dissertation Submitted to Institute of Material Science and Engineer College of Engineering National Chiao Tung University in partial Fulfillment of the requirements for the Degree of Master of Science in Material Science and Engineerung July, 2006 Hsinchu, Taiwan, Republic of China 中華民國 九十五年七月.
(3) 誌 謝 很幸運能來到交大材料所研習,並且在學術研究上作出貢獻,當然除了是自己本身 要努力外,而身邊的人亦予我許多協助。本論文能順利完成,首先感謝指導教授陳家富 老師,感謝老師這二年來,在研究大方向及儀器設備提供指導,且在修課時以予專業知 識的教導,故能在研習的領域有所進展。 在實驗部分,則首先感謝陳建仲學長,龔亮仁學長予我在設計實驗的構想及規劃; 除此之外,他們不吝與我一同討論分析結果,協助我克服許多實驗上的問題。再來特別 感謝清大的陳燦耀學長及實驗室的劉厥揚學長,協助我在實驗中重要部分的製程及試片 分析。然而當實驗遇到困境時,陳建銘學長,徐振航學長,羅鴻鈞學長,施騰凱學長, 洪淙琦學長以及王瑞豪學長都會適時予我些想法及鼓勵;再加上平日與陳宜輝同學互相 勉勵下,督促自己順利將實驗完成。 最後感謝國家科學委員會給予經費補助(NSC95-2218-E-009-009.).
(4) 奈米碳管化學表面改質應用於直接甲醇燃料電池 陰極電極之研究 研究生:莊方慈. 指導教授:陳家富 教授 國立交通大學 材料科學與工程研究所 摘要. 本研究是以多壁奈米碳管作為直接甲醇燃料電池陰極部分的鉑觸媒載體,因 此先在碳布上直接生成大量且具方向性的多壁奈米碳管;此方法可以簡化碳管應 用於陰極的製程,且碳布上的奈米碳管具有高附著性。 再以高溫條件,使用 HNO3、H2SO4、KOH 作為多壁奈米碳管的化學表面改質溶 液,以產生官能基鍵結在奈米碳管上,促進鉑離子均勻地及高密度地披覆在多壁 奈米碳管表面上。並探討溫度、時間、濃度對多壁奈米碳管化學表面改質之效應, 而利用 FTIR、XPS、EDX、CV 的分析,我們發現多壁奈米碳管在 6 小時的 14M HNO3 處理下,可以產生大量官能基以協助電化學觸媒鉑金屬的披覆,進而提升陰極部 分的電池效能。. I.
(5) Study of Chemical Surface Modifications of CNTs as cathode electrode for DMFC Student: Fang-Tzu Chuang. Advisor: Prof. Chia-Fu Chen. Institute of Material Science and Engineering National Chiao-Tung University Abstract In this study, multi-wall carbon nanotubes (MWNTs) are used as Pt catalyst support for cathode electrode in the direct methanol fuel cell (DMFC). Thus, a lot of well-align MWNTs are fabricated on carbon cloth directly. The method in the cathode electrode of DMFC is easy to constructed and sticking on the carbon cloth tightly. Then, MWNTs are modified by HNO3, H2SO4, and KOH at high temperature may produce different functional groups to attract more Pt ions nucleating uniformly and densely. Moreover, there are the other parameters, temperature, time, and concentration, in the function of chemical modification for MWNTs. In this way, we would find 14M-MWNTs at 6 hours by using FTIR, XPS, EDX, and CV may produce a lot of functional groups to increase Pt anchoring sites. Finally, it could improve the efficiency of half-cell test.. II.
(6) Contents Abstract (Chinese)………………………………………………………...……..…….I Abstract (English) …………………………………………………………...…..…....II Contents……………………….…………………………………………..………….III Figure Caption…………………………………………………………..…..….…….VI Table Caption……………………………………………………………...………......X Chapter 1.Introduction…...………….………………………………………...….....1 1.1 Preface.……………………………………………..………………...…………..1 1.2 Background of the study…………………………………………………..……..5 1.2.1 Pt/Carbon black for DMFC electrode (commerce)……………………...…5 1.2.2 Carbon nanomaterials for DMFC electrode......……………………….…...7 1.2.3 Modification of CNTs powder for DMFC electrode……………………….8 1.3 Motivation…………………………………………………………......................9. Chapter 2.Fundamentals of MEA for DMFC and Modification of CNT…....….10 2.1 Assemble of MEA for DMFC………………………….…………………..…...10 2.1.1 Proton Exchange Membrane……………………………………………...10 2.1.2 Catalyst Layer…………………………………………………..………...10 2.1.3 Gas diffusion layer…………………………………………………..……11 2.2 Principle of DMFC....………………………………………………….....…….13 2.3 Growth and Characterization of Carbon Nanotube……………………………..15 2.3.1 Growth Methods……………………………………………………...…...15 2.3.2 The growth mechanism of Carbon nanotubes……………………...……..18 2.4 Modification of Carbon Nanotube.……………………………………………..19. III.
(7) Chapter 3.Experimental Procedures ……………………...……….……………...20 3.1 Fabrication of CNT on C Cloth...…………………..…………….………...…...21 3.2 Modification of carbon nanotube on carbon cloth…...………………….…...…22 3.3 Dispersing of Pt on Prepared Carbon Cloth…..…………………….…….…….23 3.4 Analysis Instruments………………………………………………………..…..24 3.4.1 Scanning Electron Microscopy (SEM)………………………….…...…....24 3.4.2 Transmission Electron Microscopy (TEM)………………………....…….24 3.4.3 X-ray Photoelectron Spectroscopy (XPS)……..………………....……….25 3.4.4 Fourier Transform Infrared Spectrometer (FTIR)……………....………...26 3.4.5 Cyclic Voltammetry (CV) Potentiostat………………………….………...26 3.4.6 Energy Dispersive X-ray (EDX)....…………………..…….......................27 3.4.7 X-Ray Diffraction (XRD)……………………………………….….…….28. Chapter 4.Results and Discussion………………………….……………...……….30 4.1 Morphology of carbon nanotube on carbon cloth…………………….………...30 4.2 Multi-wall carbon nanotubes are modified by HNO3, H2SO4, and KOH……....32 4.2.1 Analysis of functional groups………………………………………...…...33 4.2.2 Qualitative analysis of Pt on MWNTs…………………………...….…….37 4.2.3 Analysis of dispersive Pt on MWNTs……………………..……….……..40 4.2.4 EDX analysis of Pt on MWNTs………………………………..….……...40 4.2.5 Half-cell test……………………………………………………….……...44 4.2.6 Summary………………………………………………………….………44 4.3 Multi-wall carbon nanotubes are modified by HNO3 with Temperature (T), time (t), and concentration (conc.)……………….………………..…….….…..46 4.3.1.1 Analysis of MWNTs morphology with T……………………..….……..47 4.3.1.2 Analysis of functional groups with T…………………………..…….…47 IV.
(8) 4.3.2.1 FTIR of 2M HNO3-MWNTs with t…………………………..….……...50 4.3.2.2 EDX analysis of Pt/2M HNO3-MWNTs………………….….….……...50 4.3.2.3 Half-cell test……………………………………………………….……51 4.3.2.4 Effective activating area…………………………………….….….……51 4.3.3.1 FTIR of 14M HNO3-MWNTs with t……………………………...…….58 4.3.3.2 EDX analysis of Pt/14M HNO3-MWNTs………………………...…….58 4.3.3.3 Half-cell test…………………………………………………....….……58 4.3.3.4 Effective activating area…………………………………………...……59 4.3.4 Summary…………………………………………………………….……59 4.4 Analysis of 14M HNO3-MWNTs..……………………………………..………66 4.4.1 Analysis of mean Pt nanoparticle size.……………………………...…….66 4.4.2 Analysis of MWNTs morphology……….……………………..….………68 4.4.3 Summary……………………………………..…………..……….….……68. Chapter 5.Conclusions……………….……………………………………...….......72 Reference…..…………………....………………………………………….………...73. V.
(9) Figure Captions Chapter 1. Fig.1.1 Fuel cell stack the application on several electronic productions...…….....….4 Fig.1.2 The development of fuel cell………………………………….…….….……..4 Fig.1.3 Thin-film methods for commercial electrode (Pt/C black)……………...........6 Fig.1.4 PTFE-bound methods and thin-film technique………………..……...............6 Fig.1.5 TEM images of microwave-synthesized Pt nanoparticles supported on different carbon: (a) Vulcan XC-72 carbon; (b) carbon nanotubes.….……….7 Fig.1.6 MWNTs are modified by HNO3 and followed by reduction of metals…….....8. Chapter 2. Fig.2.1 The schematic of a unit cell of DMFC……………………………………….11 Fig.2.2 MEA structure……………………………………………………………......12 Fig.2.3 The chemical formula and physical structure of the membrane Nafion®…...12 Fig.2.4 Illustration of DMFC in Principles……………………...…………………...13 Fig.2.5 (a)-(c) Schematic experimental setups for nanotube growth methods…...…..17 Fig.2.6 Two general growth modes of nanotube in chemical vapor deposition……...18 Fig.2.7 MWNTs are modified by HNO3……………………………………………..19. Chapter 3. Fig.3.1 Flow chart of experimental procedures……………….……………………...20 Fig.3.2 Schematic diagram of the MPECVD system………………………..…….…21 Fig.3.3 Schematic diagram of the chemical modification………………………...….22 Fig 3.4 The experimental procedures of polyol process……………..………………23 Fig.3.5 Diagram of a Scanning Electron Microscopy……….……………………….24 VI.
(10) Fig.3.6 Diagram of a X-ray Photoelectron Spectroscopy……….……….……….….25 Fig.3.7 Diagram of a Fourier Transform Infrared Spectrometer………..………....…26 Fig.3.8 Schematic of a Cyclic Voltammetry (CV) Potentiostat…………..…….........27 Fig.3.9 Elements in an EDX spectrum are identified based on the energy content of the X-rays...…...….…………………………………………………………..28 Fig.3.10 Schematic of X-Ray Diffraction……………………………………………29. Chapter 4. Fig.4.1 SEM images of pristine carbon cloth with different magnitude…….……….31 Fig.4.2 SEM images of MWNTs on carbon cloth with different magnitude…….......31 Fig.4.3 The length of MWNTs is about 20 μm and its diameter is about 20 nm.........31 Fig.4.4 MWNTs display hollow tubes with amorphous and crystalline layer.............31 Fig 4.5 The absorption spectra of MWNTs modified by HNO3, H2SO4, and KOH…34 Fig.4.6 XPS survey spectra of MWNTs modified by HNO3, H2SO4, and KOH….....35 Fig.4.7 (a) The C 1s spectrum of HNO3-MWNTs…..………………….....................35 Fig.4.7 (b) The C 1s spectrum of H2SO4-MWNTs…..…….…………………………36 Fig.4.7 (c) The C 1s spectrum of KOH-MWNTs……..….…………………………..36 Fig.4.8 The mapping of EDX for HNO3-MWNTs……………………………...…....38 Fig.4.9 The XPS survey spectrum of HNO3-MWNTs after the reduction...…………38 Fig.4.10 Chemical shift of binding energy in Pt4f7/2 and Pt4f5/2 with Ar+ etching..…39 Fig.4.11 Pt nanoparticles are agglomerated like a larger nanoparticle……………….41 Fig.4.12 Pt nanoparticles disperse uniformly on HNO3-MWNTs.…………………...41 Fig.4.13 The amount of Pt loading on raw MWNTs is 16.88 wt%.………….............42 Fig.4.14 The amount of Pt loading on KOH -MWNTs is 21.23 wt%.…….…………42 Fig.4.15 The amount of Pt loading on H2SO4 -MWNTs is 22.84 wt%.…..……….…42 Fig.4.16 The amount of Pt loading on HNO3-MWNTs is 26.08 wt%.………...……..43 VII.
(11) Fig.4.17 Pt loading on MWNTs with different chemical modification……………....43 Fig.4.18 Electrocatalytic activity is evaluated by the current peaks………………....45 Fig.4.19 Little damage for 14M HNO3-MWNTs at 800C…..………….……….…....48 Fig.4.20 Little damage for 14M HNO3-MWNTs at 900C…………………….….......48 Fig.4.21 A serious damage for 14M HNO3-MWNTs at 1000C….……………….......48 Fig.4.22 (a) FTIR of 2M HNO3-MWNTs with different T………………….……….49 Fig.4.22 (b) FTIR of 14M HNO3-MWNTs with different T…………………………49 Fig.4.23 The number of -COOH would increase with t gradually………….………..53 Fig.4.24 The amount of Pt loading on raw MWNTs is 14.37 wt%…….…………….53 Fig.4.25 The amount of Pt loading on 2M HNO3-MWNTs at 6 hr is 16.72 wt%…....54 Fig.4.26 The amount of Pt loading on 2M HNO3-MWNTs at 12 hr is 24.38 wt%..…54 Fig.4.27 The amount of Pt loading on 2M HNO3-MWNTs at 18 hr is 28.21 wt%…..54 Fig.4.28 The amount of Pt loading on 2M HNO3-MWNTs at 24 hr is 26.99 wt%…..55 Fig.4.29 2M HNO3-MWNTs from 12 hr to 24 hr may anchor the most Pt………….55 Fig.4.30 The currents peaks represent the activity of Pt with t……………………....56 Fig.4.31 Electrochemically active surface areas of Pt with t………………….……..57 Fig.4.32 The number of -COOH would increase with t gradually……….…………..61 Fig.4.33 The amount of Pt loading on raw MWNTs is 15.38 wt%..............................61 Fig.4.34 The amount of Pt loading on 14M HNO3-MWNTs at 6 hr is 26.52 wt%......62 Fig.4.35 The amount of Pt loading on 14M HNO3-MWNTs at 12 hr is 27.94 wt%....62 Fig.4.36 The amount of Pt loading on 14M HNO3-MWNTs at 18 hr is 25.79 wt%....62 Fig.4.37 The amount of Pt loading on 14M HNO3-MWNTs at 24 hr is 25.95 wt%....63 Fig.4.38 14M HNO3-MWNTs from 6 hr to 24 hr may anchor the most Pt………….63 Fig.4.39 The currents peaks represent the activity of Pt with t………………………64 Fig.4.40 Electrochemically active surface areas of Pt with t………………………...65 Fig.4.41 XRD patterns of Pt on raw-MWNTs and 14M HNO3-MWNTs…….……...69 VIII.
(12) Fig.4.42 The average diameters for Pt/raw-MWNTs is 5.8802 nm………………….70 Fig.4.43 The average diameters for Pt/14M HNO3-MWNTs is 7.29 nm…………….70 Fig.4.44 (a) raw MWNTs (b) 14M HNO3-MWNTs………………………………….70 Fig.4.45 (a) raw MWNTs with Pt (b) 14M HNO3-MWNTs with Pt……….………...71 Fig.4.46 Hypothetical model for stable state of 14M HNO3-MWNTs………………71. IX.
(13) Table Captions Chapter 1 Table 1.1 Five types of fuel cell characteristics.............................................................3. Chapter 3 Table 3.1 The parameters of the growth of MWNTs....................................................21. Chapter 4 Table 4.1 MWNTs are modified by HNO3, H2SO4, and KOH…….……………..…..32 Table 4.2 The absorption spectra ranges of several functional groups...……………..34 Table 4.3 The development of the binding energy of Pt4f7/2 and Pt4f5/2 with time......39 Table 4.4 HNO3-MWNTs with different T…………………………………………...46 Table 4.5 MWNTs are modified by HNO3 at 900C for 2M and 14M with t……….....50 Table 4.6 The value of electrochemically active surface areas of the Pt with the t…..57 Table 4.7 The value of electrochemically active surface areas of the Pt with the t…..65 Table 4.8 The average size of Pt/raw-MWNTs and Pt/14M HNO3-MWNTs…..……69. X.
(14) Chapter 1 Introduction 1.1 Preface Over the past few years, the direct conversion of chemical into electrical energy via fuel cells has been at the center of attention of electrochemical research and technology development. This is due not only to the scientifically fascinating complexity of fuel cell reactions and the general awareness of the technological potential of fuel cells, but is also a result of society’s strive towards developing environmentally-harmless power generation. Direct methanol fuel cell (DMFC) for instance, the product of the reaction is only little water and carbon dioxide and is free of nitrogen oxide, carbon monoxide, sulfite, and hydrocarbon. W. R. Grove reported that the reaction between hydrogen and oxygen in 1839. However, the first application of fuel cell was in the 1960s as an auxiliary power source in the Gemini space flights. Subsequently, advances in this technology were stagnant until the late 1980s when the fundamental design underwent significant reconfiguration. In the recent years, the new applications are in decentralized power supply systems, in portable products, and in sensor technology. In the quest for a highly efficient, emission-free drive system, the development of mobile automotive fuel cell units is proving to be quite promising. A variety of fuel cells are in different stages of development. The most common classification of fuel cells is on the basis of the type of electrolyte used in the cells and includes (1) polymer electrolyte fuel cell (PEFC), (2) alkaline fuel cell (AFC), (3) phosphoric acid fuel cell (PAFC), (4) molten carbonate fuel cell (MCFC), and (5) solid oxide fuel cell (SOFC). The basic characteristics of these five types of fuel cell are listed in Table 1.1 and Fig 1.1 show present fuel cell stack application on several electronic productions. In recent years, the DMFC used for vehicle transportation and local power generation has received increasing attention in Fig 1.2. Due to its high electrochemical performance efficiency, simple stack design, pollution-free, noise-free, and low temperature operation, DMFC has become a promising candidate for portable power source. Besides, DMFC with the promises 1.
(15) such as the elimination of electrolyte leakage and lower corrosion has applications in the areas of military, aerospace and transportation. The electrode of DMFC is consistent of electro-chemical catalyst Pt / C. Many researches about rising Pt performance efficiency and Pt amount reduction are still facing the challenge the widely application of the membrane and electrode assembly (MEA). In this study, multi-wall carbon nanotubes (MWNTs) modified by chemical solution are acted as support instead of commercial carbon black to support and disperse Pt. It is allowed to rise performance efficiency of Pt in the electrode.. 2.
(16) Table 1.1 Five types of fuel cell characteristics PEFC. AFC. PAFC. MCFC. SOFC. Hydrated Polymeric Ion Exchange Membranes. Mobilized or Immobilized Potassium Hydroxide in asbestos matrix. Immobilized Liquid Phosphoric Acid in SiC. Immobilized Liquid Molten Carbonate in LiAlO2. Perovskites (Ceramics). Electrodes. Carbon. Transition metals. Carbon. Nickel and Nickel Oxide. Perovskite and perovskite / metal cermet. Operating Temperature. 40 – 80 °C. 65 – 220 °C. 205 °C. 650 °C. 600 - 1000 °C. Charge Carrier. H+. OH-. H+. CO32-. O2-. Catalyst. Pt. Pt. Pt. Ni. Perovskites/Ni. CO impact. Poison. Poison. Poison. Fuel. Fuel. Gas + Electrolyte Circulation. Process Gas + Liquid cooling medium or steam generation. Internal Reforming + Process Gas. Internal Reforming + Process Gas. 30-50%. 30-45%. 45-60%. 45-75%. Pure H2 Good performance Expensive. Lower performance than AFC Expensive. Electrolyte. Process Gas + Product Heat Liquid Cooling Management Medium Efficiency (LHV). 30-45%. Quick start-up Major H2 preferable Advantages / Heat & water Disadvantages management issues Example of installed units. 250 kW (Ballard). Major Applications. Transportation Stationary. Wider fuel All ceramic choices Wider fuel Cogeneration choices Corrosive liquid Co-generation electrolyte Durability. 12 kW (for 2 MW 4,000 h 1.2 MW 5,000 h space shuttles) (Fuel Cell (Milan) (ZeTek) Energy) Space Stationary Transportation. Stationary. Stationary Stationary Transportation Transportation (APU) (APU). [http://www.ip3.unipg.it/FuelCells/en/whatisit.asp]. 3. 300, 220 kW; 100kW-17500h (SWPC).
(17) Fig 1.1 Fuel cell stack the application on several electronic productions [engadget.com ; pr.fujitsu.com ; www.maxmoto.co.uk ; files.automotiveforums.com]. Fig 1.2 The development of fuel cell [www-cms.llnl.gov/ s-t/carbon_con.html. 4.
(18) 1.2 Background of the Study (Literature Review) 1.2.1 Pt/Carbon black for DMFC electrode (Commerce) Before the development of the thin-film catalyst layer [1], PTFE-bound catalyst layers were the convention [2–5]. In these catalyst layers, the catalyst particles were bound by a hydrophobic PTFE structure commonly cast to the diffusion layer. This method was able to reduce the platinum loading of prior direct methanol fuel cells (DMFC) by a factor of 10; from 4 to 0.4 mg/cm2 [5]. In order to provide ionic transport to the catalyst site, the PTFE-bound catalyst layers are typically impregnated with Nafion by brushing or spraying. However, platinum utilization in PTFE-bound catalyst layers remains approximately 20 wt% [4, 6]. Nevertheless, researchers have continued to work on developing new strategies for Nafion impregnation [3]. The present convention in fabricating catalyst layers for DMFC is to employ thin-film methods in Fig. 1.3. In his 1993 patent, Wilson [1] described the thin-film technique for fabricating catalyst layers for DMFC with catalyst loadings less than 0.35 mg/cm2. In this method the hydrophobic PTFE traditionally employed to bind the catalyst layer is replaced with hydrophilic perfluorosulfonate ionomer (Nafion). Thus, the binding material in the catalyst layer is composed of the same material as the membrane. Even though PTFE features effective binding qualities and imparts beneficial hydrophobicity in the gas diffusion layers, there is no particular benefit to its presence in the catalyst layer [7]. Thin-film catalyst layers have been found to operate at almost twice the power density of PTFE-bound catalyst layers. This correlates with an active area increase from 22 to 45.4% when a Nafion-impregnated and PTFE-bound catalyst layer is replaced with a thin-film catalyst layer. Their methodology is schematically described in Fig. 1.4.. 5.
(19) Fig. 1.3 Thin-film methods for commercial electrode (Pt/C black). Fig. 1.4 PTFE-bound methods and thin-film technique. 6.
(20) 1.2.2 Carbon nanomaterials for DMFC electrode In the last section, carbon blacks were mainly employed as supporting materials for fuel cell application. Uchida et al. [8] reported the effect of microstructure within various carbon blacks. Recently, nanostructured carbon materials [9], graphite carbon nanofiber [10,11], mesocarbon microbeads [12], and carbon nanotubes (CNTs) [13–17] were utilized as supporting materials of catalysts where the dispersion of platinum or platinum-based alloy nanoparticles were affected. Vulcan XC-72 carbon black is commonly used as a carbon supporting materials for electrode catalysts in DMFCs. In this report, CNTs were used as the supporting material. Fig. 1.5 (a) and (b) are typical TEM images of Vulcan carbon-supported and CNT supported catalysts, showing a remarkably uniform and high dispersion of metal particles on the surface of carbon material.. Fig. 1.5 TEM images of microwave-synthesized Pt nanoparticles supported on different carbon: (a) Vulcan XC-72 carbon; (b) carbon nanotubes. 7.
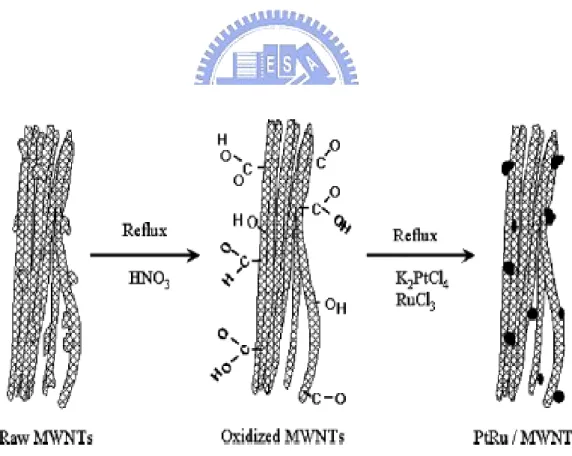
(21) 1.2.3 Modification of CNTs powder for DMFC electrode One method of metal deposition on CNT surface has been introduced: CNTs impregnated with an alcoholic solution of hexachloroplatinic acid was calcinated at high temperature, under nitrogen or hydrogen atmosphere to convert platinum ion to platinum crystallites whose size was dependent on the calcination temperature and time. Che et al. [16] prepared electrocatalysts (i.e., Pt, Ru, and PtRu nanoparticles on CNTs) by this method in Fig. 1.6. Another general method to obtain a more controlled and specific nucleation of metals and metal compounds on the surface is to modify the multi-wall carbon nanotubes (MWNTs) surface through oxidation to introduce anchoring sites, and then to attach metals on the sites through reduction.. Fig. 1.6 MWNTs are modified by HNO3 and followed by reduction of metals. 8.
(22) 1.3 Motivation In this study, multi-wall carbon nanotubes (MWNTs) are used as catalyst support. Attractive properties of nanotubes related with their good electrical conductivity and high specific surface area have been demonstrated in the electrochemical energy storage systems. Some researches have already used the application of carbon nanotubes powder as electrocatalyst, Pt and Pt/Ru, support for cathodic and anodic reactions in fuel cell [18–28]. However, there was little research that CNTs were fabricated on carbon cloth directly. The method in the electrode of DMFC is easy to constructed and sticking on the carbon cloth tightly. And then, the other researches were reported that the chemical modifications of the surface of CNTs powder by using HNO3 or H2SO4-HNO3 could improve the metal particle dispersion, increase the available metal specific surface area, reduce the amounts of the expensive active metal component, and open the cap of CNTs[29–30]. However, there was a lack of the correlation of the CNTs texture and structure with the chemical and electrochemical analysis. Our purpose is to find which chemical solution, temperature, concentration, and time parameter is the best way to modify CNTs in order to rise the efficiency of cathode in the DMFC.. 9.
(23) Chapter 2 Fundamentals of MEA for DMFC and Modification of Carbon nanotube (CNT) 2.1 Assemble of MEA for DMFC Typically, the DMFC is composed of a membrane electrode assembly (MEA) and two graphite flow-field plates, which are pressed against the MEA. The central component of the DMFC is the MEA composed of membrane, catalyst, and gas diffusion layers. Each of these layers has special functions in the DMFC and follows to explain its functions. For the interaction of the layers in the MEA it is important to define the respective functions of the individual components. Fig. 2.1 shows the description of the components in the DMFC. Fig. 2.2 shows the structure of the MEA.. 2.1.1 Proton Exchange Membrane The proton exchange membrane for DMFC is commercially available from DuPont Incorporation and has a commercial name, Nafion®. This organic proton-conductive membrane is a sulfonic acid-based perfluorinated polymer or polystryene sulfonate polymer. It is used as electrolyte and the protons (cations) are allowed to permeate through it, but anions are rejected. The Nafion® structure is composed of three different parts, namely, rigid hydrophobic backbone, flexible perfluorocarbon, and hydrated ionic cluster region. The chemical formula and physical structure of the membrane is shown in Fig. 2.3.. 2.1.2 Catalyst Layer The catalyst layer is in direct contact with the membrane and the gas diffusion layer. It is also referred to as the active layer. In both the anode and cathode, the catalyst layer is the location of the half-cell reaction in a DMFC. The catalyst layer is either applied to the membrane or to the gas diffusion layer. In either case, the objective is to place the catalyst particles,. 10.
(24) platinum or platinum alloys, within close proximity of the membrane.. 2.1.3 Gas diffusion layer The porous gas diffusion layer in DMFC ensures that reactants effectively diffuse to the catalyst layer. In addition, the gas diffusion layer is the electrical conductor that transports electrons to and from the catalyst layer. Typically, gas diffusion layers are constructed from porous carbon paper, or carbon cloth, with a thickness in the range of 100–300 mm. The gas diffusion layer also assists in water management. In addition, gas diffusion layers are typically wet-proofed and could ensure that the pores of the gas diffusion layer do not become congested with liquid water.. Fig.2.1 The schematic of a unit cell of DMFC [www.eng.wayne.edu/ page.php?id=1740]. 11.
(25) Fig.2.2 MEA structure [www.hidrotec-fuelcell.com.ar/ mea_esp.htm]. Fig.2.3 The chemical formula and physical structure of the membrane Nafion® [Dupont Products information about Nafion ]. 12.
(26) 2.2 Principle of DMFC. Fig.2.4 Illustration of DMFC in Principles [www.echem.titech.ac.jp/ ~dmfc/C01/C01mokuteki.html]. The schematic of a unit cell DMFC and its principle are in the Fig. 2.4. As soon as methanol attains to the surface of anode, it may be oxidized by electrocatalyst particle Pt and provide CO2, H+, and six electrons. The follow is the location of the half-cell reaction in the anode for DMFC. +. -. CH3OH + H2O → CO2 + 6H + 6e. E°=0.046V. (1). In the other hand, when electrons reach the cathode by external current loop, H+ ions transfer the proton exchange membrane to the cathode surface and provide water with oxygen from the air. The follow is the location of the half-cell reaction in the cathode for DMFC. +. -. 3/2O2 + 6H + 6e → 3H2O. E°=1.229V. (2). Finally, methanol is oxidized in the overall reaction for DMFC.. CH3OH + 3/2O2 → 2H2O + CO2. E°=1.183V. (3). As the assumption of the absorption, the detail reaction mechanism on the surface of the electrocatalyst Pt is below the equation.. 13.
(27) Pt + CH3OH → Pt-(CH3OH)ads. (4) +. Pt-(CH3OH)ads → Pt-(CH2OH)ads + H + e +. Pt-(CH2OH)ads → Pt-(CHOH)ads + H + e +. -. (5). -. (6). -. Pt-(CHOH)ads → Pt-(COH)ads + H + e +. (7). -. Pt-(CHO)ads → Pt-(CO)ads + H + e. (8). From all above equations, we could find that it is the complex in this reaction mechanism in the anode. There are many intermedium in the sequence reactions. The intermedium, Pt-(CO)ads, is formed by CO and Pt when all H+ leave the surface of Pt. Furthermore, Pt itself gets out of the ability for oxidizing methanol. It is named Poison Effect. In order to solve the problem, the second electrocatalyst, transitional metal (Sn、Ru、Re、Mo), is added to assist water segregate. Then, it allows Pt-(CO)ads to be reduced as Pt. +. -. M-(OH)ads + Pt-(CO)ads → Pt + M + CO2 + H + e. (9). Furthermore, some researches use three kinds of metal as the electrocatalyst on the anode. In the other hand, the electrocatalyst, Pt, is the single kind of metal on the cathode.. 14.
(28) 2.3 Growth and Characterization of Carbon Nanotube In 1991, Iijima of the NEC Laboratory in Japan reported the first observation of multi-walled carbon nanotubes (MWNTs) in carbon-soot made by arc-discharge. About two years later, he made the observation of single-walled carbon nanotubes (SWNTs). The past decade witnessed significant research efforts in efficient and high-yield nanotube growth methods. The success in nanotube growth has led to the wide availability of nanotube materials, and is a main catalyst behind the recent progress in basis physics studies and applications of nanotubes. Nanotubes can be utilized individually or as an ensemble to build functional device prototypes, as has been demonstrated by many research groups. Ensembles of nanotubes have been used for field emission based flat-panel display, composite materials with improved mechanical properties and electromechanical actuators. Bulk quantities of nanotubes have also been suggested to be useful as high-capacity hydrogen storage media. Individual nanotubes have been used for field emission sources, tips for scanning probe microscopy and nano-tweezers. Nanotubes also have significant potential as the central elements of nano-electronic devices including field effect transistors, single-electron transistors and rectifying diodes.. 2.3.1 Growth Methods Arc-Discharge In arc-discharge, carbon atoms are evaporated by plasma of helium gas ignited by high currents passed through opposing carbon anode and cathode in Fig. 2.5(a). Arc-discharge has been developed into an excellent method for producing both high quality multi-walled nanotubes and single-walled nanotubes. MWNTs can be obtained by controlling the growth conditions such as the pressure of inert gas in the discharge chamber and the arcing current. In1992, a breakthrough in MWNTs growth by arc-discharge was first made by Ebbesen and Ajayan who achieved growth and purification of high quality MWNTs at the gram level. The synthesized 15.
(29) MWNTs have lengths on the order of ten microns and diameters in the range of 5-30nm. The nanotubes aretypically bound together by strong van der Waals interactions and form tight bundles. MWNTs produced by arc-discharge are very straight, indicative of their high crystalline. For as grown materials, there are few defects such as pentagons or heptagons existing on the sidewalls of the nanotubes. The by-product of the arc-discharge growth process is multi-layered graphitic heating the as grown material in an oxygen environment to oxidize away the graphitic particles. The polyhedron graphitic particles exhibit higher oxidation rate than MWNTs; nevertheless, the oxidation purification process also removes an appreciable amount of nanotubes.. Laser Ablation The method utilized intense laser pulses to ablate a carbon target containing 0.5 atomic percent of nickel and cobalt. The target is placed in a tube-furnace heated to 1200oC in Fig. 2.5(b). During laser ablation, a flow of inert gas is passed through the growth chamber to carry the grown nanotubes downstream to be collected on a cold finger.. Chemical Vapor Deposition (CVD) A schematic experimental setup for CVD growth is depicted in Fig. 2.5(c). The growth process involves heating a catalyst material to high temperatures in a tube furnace and flowing a hydrocarbon gas through the tube reactor for a period of time. Materials grown over the catalyst are collected upon cooling the system to room temperature. The key parameters in nanotube CVD growth are the hydrocarbons, catalysts and growth temperature. The active catalytic species are typically transition-metal nanoparticles formed on a support material such as silicon.. 16.
(30) Fig. 2.5 (a)-(c) Schematic experimental setups for nanotube growth methods. 17.
(31) 2.3.2 The growth mechanism of Carbon nanotubes The general nanotube growth mechanism in a CVD process involves the dissociation of hydrocarbon molecules catalyzed by the transition metal, and dissolution and saturation of carbon atoms in the metal nanoparticle in Fig. 2.6. The precipitation of carbon from the saturated metal particle leads to the formation of tubular carbon solids in sp2 structure. Tube formation is favored over other forms of carbon such as graphitic sheets with open edges. This is because a tube contains no dangling bonds and therefore is in a low energy form. For MWNTs growth, most of the CVD methods employ ethylene or acetylene as the carbon feedstock and the growth temperature is typically in the range of 550-750oC. Iron, nickel or cobalt nanoparticles are often used as catalyst. The rationale for choosing these metals as catalyst for CVD growth of nanotubes lies in the phase diagrams for the metals and carbon. At high temperatures, carbon has finite solubility in these metals, which leads to the formation of metal-carbon solutions and therefore the aforementioned growth mechanism. Noticeably, iron, cobalt and nickel are also the favored catalytic metals used in laser ablation and arc-discharge. This simple fact may hint that the laser, discharge and CVD growth methods may share a common nanotube growth mechanism, although very different approaches are used to provide carbon feedstock.. Fig. 2.6 Two general growth modes of nanotube in chemical vapor deposition. 18.
(32) 2.4 Modification of Carbon Nanotube The components of the produced gas were identified as CO, CO2 and NO by the gas chromatographt (GC) and gas chromatography-mass spectrometry (GCMS) analyses. This implies that the carbon atoms constituting the MWNTs were partly removed by HNO3 oxidation [32].. 2HNO3 + 3C (MWNTs) →3CO + 2NO + H2O. (10). 4HNO3 + 3C (MWNTs) → 3CO2 + 4NO + 2H2O. (11). The reaction pathways for the functional group formation most probably involve the following two reactions in Fig. 2.7: (i) hydration of the olefinic C=C moieties released from the conjugation network by the decarbonization due to HNO3 oxidation. The nanotube sidewalls and more active top of the nanotube form the COOH and C–OH bonds) (ii) A hydration–dehydration equilibrium between adjoining C–OH groups and C=O ether groups.. Fig. 2.7 MWNTs are modified by HNO3. 19.
(33) Chapter 3 Experimental procedures New cathode material for direct Methanol Fuel Cells (DMFC) bases on multi-wall carbon nanotubes (MWNTs), aiming to improving the performance of the cell is analyzed. In this study, MWNTs are fabricated directly on carbon cloth by Microwave plasma enhanced chemical vapor deposition (MPECVD) and then functionalized by several chemical solutions. Therefore MWNTs can be functionalized with groups such as hydroxyl (-OH), carboxyl (-COOH), and carbonyl (>C=O) that are necessary to anchor metal ions to the tube. Pt catalyst is electroless deposited on MWNTs using a chloroplatinic acid solution, based on H2(PtCl6)*6H2O. The morphology of MWNTs and Pt nanoparticles are analyzed by SEM, TEM, and XRD. Surface-to-depth analysis of functionalized multi-wall carbon nanotubes is achieved by high resolution x-ray photoelectron spectroscopy (XPS) and Fourier Transform Infrared Spectroscopy (FTIR). Finally, half-cell test is determined by CV to compare its efficiency different. Fig. 3.1 shows the main experimental procedures. Carbon cloth Deposit Fe as catalyst MWNTs by MPECVD SEM. TEM Modification of MWNTs. XPS. FTIR. Reduction of H2PtCl4. TEM. XPS. CV. SEM. EDX. Fig.3.1 Flow chart of experimental procedures 20. XRD.
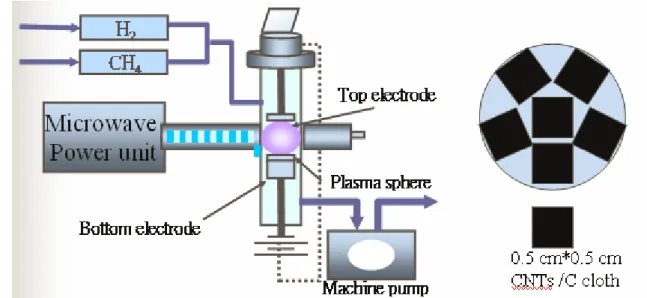
(34) 3.1 Fabrication of carbon nanotube on carbon cloth MWNTs on carbon cloth are fabricated by MPECVD without bias. The 20nm of Fe film is deposited on carbon cloth as catalyst for growth of carbon nanotubes by using ion-beam sputter. Its sample size is 0.5*0.5 cm2 and six samples are fabricated in the chamber together in order to keep the same condition. The chamber is evacuated at pressure of ~10-2 Torr with a mechanical pump. The reactive gases are mixture of H2 and CH4, which held a ratio of 90/30 sccm to a pressure set at 10 Torr. The microwave power of 300W is applied to light the plasma which let the temperature reaches up to 500°C ~ 600°C for 20 min without bias-assisted. Fig. 3.2 shows schematic diagram of the MPECVD system. Table 3.1 reports the parameters of the growth of MWNTs.. Fig. 3.2 Schematic diagram of the MPECVD system. Table 3.1 The parameters of the growth of MWNTs Metallic. Reactive. catalyst. gases. Fe: ~20nm. CH4: 30 sccm. Power. Pressure. Reaction. Bias. time 300 W. H2: 90 sccm. 21. 10 Torr. 20 min. 0V.
(35) 3.2 Modification of carbon nanotube on carbon cloth MWNTs on carbon cloth are functionalized by several chemical solutions in the sample tube with sand bath. The parameters of chemical modification are chemical solutions (HNO3, H2SO4, and KOH), temperature (800C, 900C, and 1000C), concentration (2M and 14M), and time (0 hr, 6 hr, 12 hr, 18 hr, 24 hr, and 48 hr). Then, the sample is collected after immersing with deionized water until the filtrate pH became nearly the pristine pH. Fig. 3.3 shows schematic diagram of the chemical modification. Fig. 3.3 Schematic diagram of the chemical modification. 22.
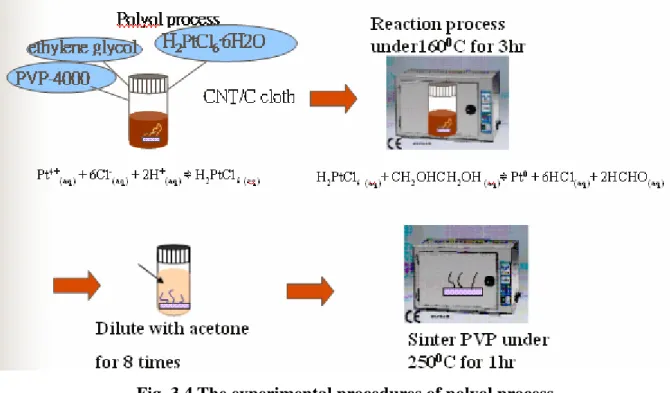
(36) 3.3 Dispersion of Pt on prepared carbon cloth The prepared carbon cloth is immersed in a chemical solution containing H2PtCl6·6H2O, PVP-4000, and ethylene glycol mixture diluted with acetone. Polymer (PVP) is the protection agent to limit metal particle growth spacing. Pt is deposited by synthesis from H2PtCl6·6H2O in ethylene glycol solution under 1600C for 3 hr, followed by filtration with acetone for 8 times and sintered for 1 hr at 2500C. This method, polyol process, is expected a uniformly homogeneous nucleation and growth mechanism of nanoparticle. The reaction dominates by temperature control and solvent plays as reductant as well. Fig 3.4 shows the experimental procedures of polyol process.. Fig. 3.4 The experimental procedures of polyol process. 23.
(37) 3.4 Analysis Instruments 3.4.1 Scanning Electron Microscopy (SEM) Scanning electron microscopy (SEM) is used to observe the surface morphology of wide range kinds of objects. There are many advantages including of easy sample preparation, high image resolution, large depth of field, and high magnification. [33] The SEM image is that signals (secondary electrons and backscattered electrons) emit from the sample surface as the sample is bombarded by the high energy incident electrons. The fabricating CNT morphology and the dispersing Pt on CNT morphology could be observed by JEOL JSM6500F in NCTU with field emission electron source and 15kV accelerate voltage.. Fig.3.5 Diagram of a Scanning Electron Microscopy [http://www.le.imm.cnr.it/sito/laboratories/jsm6500f.html]. 3.4.2 Transmission Electron Microscopy (TEM) In a typical TEM a static beam of electrons at 100-400kV accelerating voltage illuminate a region of an electron transparent specimen which is immersed in the objective lens of the microscope. The transmitted and diffracted electrons are recombined by the objective lens to form a diffraction patter in the back focal plane of that lens and a magnified image of the sample in its image plane. [33] The raw MWNTs and the modified MWNTs morphology could be compared by TEM using 24.
(38) a JEOL JEM 4000 system in NCTU operating at 200kV. And the particle morphology, size and size distribution of Pt nanoparticles dispersed on the surface of MWNTs are also characterized by TEM.. 3.4.3 X-ray Photoelectron Spectroscopy (XPS) The phenomenon is based on the photoelectric effect. The concept of the photon was used to describe the ejection of electrons from a surface when photons impinge upon it. The XPS technique is highly surface specific (< 5nm) due to the short range of the photoelectrons that are excited from the solid. The energy of the photoelectrons leaving the sample is determined using a Spherical Capacitor Analyzer (SCA) this gives a spectrum with a series of photoelectron peaks. The binding energy of the peaks is characteristic of each element. The peak areas can be used (with appropriate sensitivity factors) to determine the composition of the materials surface. [33] XPS could determine the difference of the raw CNT and the modified CNT due to the element C chemical shifts. Furthermore, it may ensure if Pt is reductive by the same way. In this study, XPS analysis is carried out on a ESCA PHI 1600 using an Mg Kα X-ray source in NTHU.. Fig.3.6 Diagram of a X-ray Photoelectron Spectroscopy [http://www.nscric.nthu.edu.tw/Other/augeresca/auesca.html]. 25.
(39) 3.4.4 Fourier Transform Infrared Spectrometer (FTIR) Fourier Transform Infrared Spectroscopy (FTIR) is an analytical technique used to identify organic and inorganic materials. This technique measures the absorption of various infrared light wavelengths by the material of interest. These infrared absorption bands identify specific molecular components and structures. [33] The functional groups on the surface of MWNTs modified by chemical solution could be determined by FTIR. The FTIR measurements are performed on a PROTEGE 460 series FTIR apparatus by transmission spectroscopy in NCTU.. Fig.3.7 Diagram of a Fourier Transform Infrared Spectrometer [http://www.forumsci.co.il/HPLC/FTIR_page.html]. 3.4.5 Cyclic Voltammetry (CV) Potentiostat A potentiostat is an electronic device that controls the voltage difference between a working electrode and a reference electrode. Both electrodes are contained in an electrochemical cell. The potentiostat implements this control by injecting current into the cell through an auxiliary, or counter, electrode. In almost all applications, the potentiostat measures the current flow between the working and auxiliary electrodes. The controlled variable in a potentiostat is the cell potential 26.
(40) and the measured variable is the cell current. The CHI Version 5.01 system in the potentiostat in NCTU is used to measure the electrochemical specific surface area of the dispersive Pt on the surface of MWNTs for the fuel-cell electrodes. From the CV, the charge equivalent to the area under the hydrogen desorption region is evaluated and the electrochemical specific surface area is calculated assuming that the charge is required for the adsorption-desorption of a monolayer of atomic hydrogen on the surface.. Fig.3.8 Schematic of a Cyclic Voltammetry (CV) Potentiostat [http://www.gamry.com/App_Notes/Potentiostat_Primer.htm#Workking]. 3.4.6 Energy Dispersive X-ray (EDX) It is a technique used for identifying the elemental composition of the specimen, or an area of interest thereof. The EDX analysis system works as an integrated feature of SEM (JEOL JSM6500F) in NCTU. An EDX spectrum plot not only identifies the element corresponding to each of its peaks, but the type of X-ray to which it corresponds as well. For example, a peak 27.
(41) corresponding to the amount of energy possessed by X-rays emitted by an electron in the L-shell going down to the K-shell is identified as a K-Alpha peak. The peak corresponding to X-rays emitted by M-shell electrons going to the K-shell is identified as a K-Beta peak. [33] EDX measurements show the element on the MWNTs and the content of Pt/MWNTs. It appears that the difference content of Pt is on the raw MWNTs and the modified MWNTs.. Fig.3.9 Elements in an EDX spectrum are identified based on the energy content of the X-rays [http://www.semiconfareast.com/edxwdx.htm]. 3.4.7 X-Ray Diffraction (XRD) X-ray Diffraction (XRD) is one of the primary techniques used by solid state chemists to characterize materials. XRD can provide information about crystalline structure and particle size in a sample even when the crystallite size is too small for single crystal x-ray diffraction. [33] An X-ray beam hits a sample and is diffracted. We can observe the diffraction peaks when the distances between the planes of the atoms apply to Bragg's Law. Bragg's Law is: nλ = 2d sin θ. (1). Where the integer n is the order of the diffracted beam,. is the wavelength of the incident. X-ray beam, d is the distance between adjacent planes of atoms (the d-spacings), and angle of incidence of the X-ray beam.. 28. is the.
(42) The broader diffraction peaks for the catalyst led to smaller average particle size as calculated by the Scherrer equation. L=. K λ Kα 1 B 2θ cos θ B. (2). Where L is the average particle size, K is the constant, λ. Kα1. is the X-ray wavelength. (1.54056 Ǻ for Cu Kα1 radiation), B2θ is the peak broadening, and θB is the angle corresponding to the peak maximum. In this study, the particle size calculated by XRD is compared with the data measured by TEM. It is determined how the functional group (COOH) on the MWNTs affects the Pt particle size forming.. Fig.3.10 Schematic of X-Ray Diffraction [http://pubs.usgs.gov/info/diffraction/html/index.html]. 29.
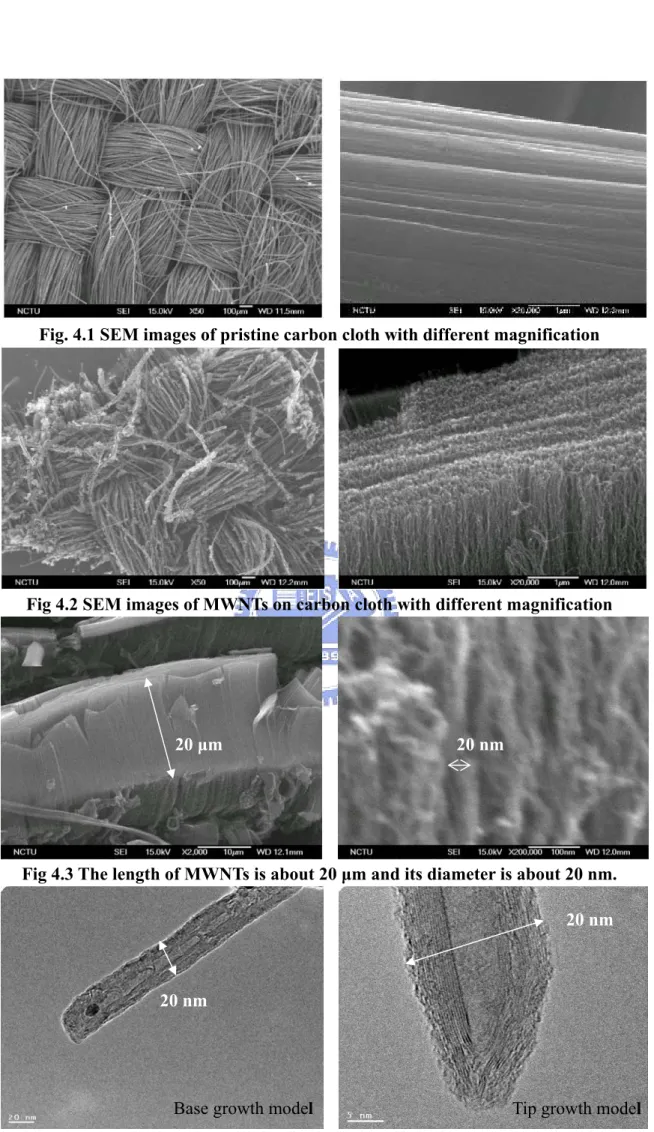
(43) Chapter 4 Results and Discussion 4.1 Morphology of carbon nanotube on carbon cloth In this study, the purpose is that the longer MWNTs are fabricated vertically by MPECVD. The use of a support, well-aligned MWNTs, for catalyst has many advantages including more the anchoring sites of available catalyst, producing a lot of functional groups to attract catalyst at the caps and the sidewalls of MWNTs easily by modified the surface structure, using inner specific surface area of tube by opening end of MWNTs. Fig 4.1 shows that a piece of carbon cloth without any treatment. It is composed of textured carbon fibers which have a smooth surface. Fig 4.2 shows that the images of long MWNTs fabricated on carbon cloth densely and vertically. Then, MWNTs are analyzed in the higher magnification. The length of MWNTs is about 20 μm and its diameter is about 20 nm in Fig 4.3. As shown in Fig. 4.4, the TEM images show that MWNTs display hollow tubes with amorphous and crystalline layers. On the other hand, the growth model of MWNTs could be found including tip growth model and base growth model. The density of the vertical MWNTs may not be controlled dispersedly so the spraying of Pt particle may just stop on the top surface. Therefore, even the high specific surface area of MWNTs still can not be utilized totally until Pt is deposited uniformly by using polyol process. However, the raw surface of MWNTs is relatively inert and difficult to support particles homogeneously, which often results in the agglomeration of nanoparticles. Thus, it is important to improve the adhesion through the following surface chemical modification techniques.. 30.
(44) Fig. 4.1 SEM images of pristine carbon cloth with different magnification. Fig 4.2 SEM images of MWNTs on carbon cloth with different magnification. 20 μm. 20 nm. Fig 4.3 The length of MWNTs is about 20 μm and its diameter is about 20 nm. 20 nm. 20 nm. Base growth model. Tip growth model. Fig. 4.4 MWNTs display hollow tubes with amorphous and crystalline layer 31.
(45) 4.2. Multi-wall carbon nanotubes are modified by HNO3, H2SO4, and KOH Surface chemical modification is a common method and is essential for the deposition of catalysts and other species onto carbon nanotube surfaces for nanocatalytic applications [34]. Oxidation, with popular oxidants including HNO3, KMnO4, HNO3 / H2SO4, is an often attempted approach to activate the surface of CNTs [35, 36]. However, there is little analysis about functional groups after surface chemical modification of CNTs. In this study, MWNTs are modified by HNO3, H2SO4, and KOH at 800C in Table 4.1 and may produce different functional groups to attract more Pt ions nucleating uniformly and densely. Thus, after the following experiments, it would be found that which chemical solution is better for surface chemical modification of MWNTs.. Table 4.1 MWNTs are modified by HNO3, H2SO4, and KOH Solution. HNO3. H2SO4. KOH. Concentration. 16M. 18M. 6M. Temperature. 800C. 800C. 800C. Time. 6 hr. 6 hr. 6 hr. Hypothetical. -COOH. -SO3H. -OH. functional groups. -OH. 32.
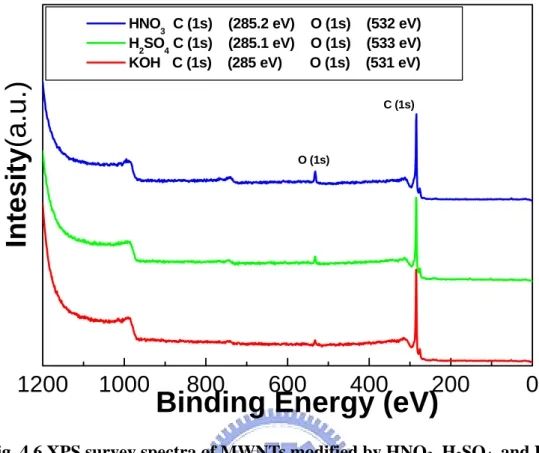
(46) 4.2.1 Analysis of functional groups The information on the surface chemistry of the modified nanotubes has been provided by the FTIR. Table 4.2 indicates the absorption spectra ranges of several functional groups. Fig 4.5 shows the absorption spectra of MWNTs modified by HNO3, H2SO4, and KOH at 800C for 6 hr. In fact, one broad intensive band observing at 1375 cm-1 is assigned to the alcoholic hydroxyl groups (-OH) or the carboxylic acids (-COOH) and the other observing at 1574 cm-1 is assigned to the carboxylic acids (-COOH). However, the functional group, sulfonic acid (-SO3H), can not be observed. Therefore, the reaction pathways for forming the functional group most probably involve the following reaction. Hydration of the olefinic C=C moieties is released from the conjugation network by decarbonization of the nanotube sidewalls due to HNO3, H2SO4, and KOH oxidation so the alcoholic hydroxyl groups (-OH) and carboxylic acids (-COOH) could be formed [32]. Indeed, we try to assay sulfonic acid (-SO3H) groups with FTIR. However, the detection is too difficult because of their weak response in the IR mode. For the reason, we used XPS to directly detect the sulfur atom [37]. No S spectra of various MWNTs, given in Fig. 4.6, show that there is no sulfonic acid (-SO3H). On the other hand, the carboxyl groups would be detected in Fig. 4.7(a) (b) (c). The C 1s spectrum appears to be composed of C=C (~284.6 eV), C-C (~285.85 eV), CO (287.46 eV), COO-(289.24 eV), OCOO- (~291.5 eV) functional groups [38]. The observed chemical shift following the chemical treatment is about 1 eV. Therefore, the result from the FTIR and XPS analysis indicates that MWNTs merely forms the alcoholic hydroxyl groups (-OH) and the carboxylic acids (-COOH) with chemical modification of HNO3, H2SO4, and KOH at 800C for 6 hr.. 33.
(47) Table 4.2 The absorption spectra ranges of several functional groups -1. Functional group. Wave number (cm ). -OH. alcoholic hydroxyl groups. 1410-1260. -SO3H. sulfonic acid. 1150-1250. -COOH. carboxylic acids. -C=O. carboxyl groups. 1610-1550. 1420-1300. 1690-1760. 0. 80 C 16MHNO3 06hr 0. 80 C 18MH2SO4 06hr. -COOH -OH -COOH. absorptions(a.u.). 0. 4000. 80 C 6MKOH 06hr w/o. 3000. 2000. -1. 1000. wave number (cm ) Fig 4.5 The absorption spectra of MWNTs modified by HNO3, H2SO4, and KOH. 34.
(48) (285.2 eV) (285.1 eV) (285 eV). Intesity(a.u.). HNO3 C (1s) H2SO4 C (1s) KOH C (1s). 1200. O (1s) O (1s) O (1s). (532 eV) (533 eV) (531 eV) C (1s). O (1s). 1000. 800. 600. 400. 200. Binding Energy (eV). 0. Intesity(a.u.). Fig. 4.6 XPS survey spectra of MWNTs modified by HNO3, H2SO4, and KOH. 294. C (1s) 2 sp C=C (284.6) 3 sp C-C (285.85) C-O (287.46) COO- (289.24) OCOO- (291.5). C=C. C-C -. OCOO. 292. COO. 290. -. C-O. 288. 286. 284. 282. Binding Energy (eV). Fig.4.7 (a) The C 1s spectrum of HNO3-MWNTs. 35. 280.
(49) Intesity(a.u.). C (1s) 2 sp C=C (284.6) 3 sp C-C (285.85) C-O (287.35) COO- (289.62) OCOO- (292.4). C=C. C-C. OCOO. -. 292. COO. 290. -. C-O. 288. 286. 284. Binding Energy (eV). 282. 280. Intesity(a.u.). Fig.4.7 (b) The C 1s spectrum of H2SO4-MWNTs. 300. C (1s) 2 sp C=C (284.8) 3 sp C-C (285.82) C-O (286.884) COO- (290.14). C=C. C-C COO. 295. -. C-O. 290. 285. Binding Energy (eV) Fig.4.7 (c) The C 1s spectrum of KOH-MWNTs. 36. 280.
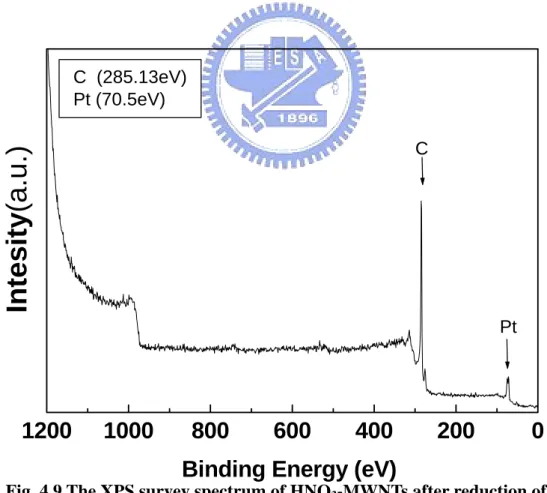
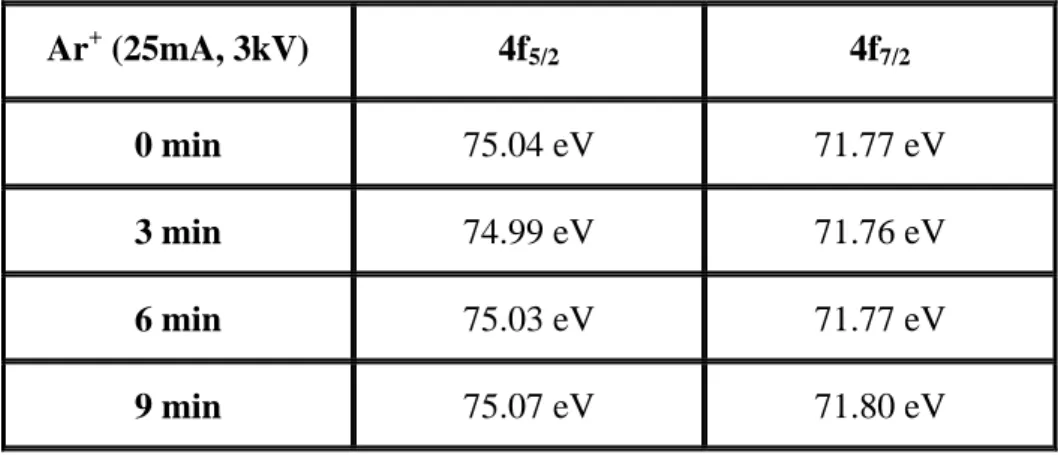
(50) 4.2.2 Qualitative analysis of Pt on MWNTs Pt particles are deposited on MWNTs by using polyol process after samples are modified chemically. Then, we take EDX and XPS of qualitative analysis for samples in order to be sure that polyol process is successful. Fig. 4.8 shows the mapping of EDX for HNO3-MWNTs. It indicates that the dispersive nanoparticles on MWNTs are Pt. On the other hand, Fig. 4.9 also shows the XPS survey spectrum of HNO3-MWNTs after the Pt reduction. Notably, a very strong Pt4f peak indicates that there are Pt nanoparticles on MWNTs because XPS is a surface-sensitive tool. The formation process of PVP-protected Pt nanoparticles synthesized in ethylene glycol is presented that the H2PtCl6 may be completely reduced according to the eq (1) and the eq (2).. Pt. 4+ (aq). -. +. + 6Cl (aq) + 2H (aq) ⇌ H2PtCl6 0. (aq). H2PtCl6(aq)+ CH2OHCH2OH(aq) ⇌ Pt + 6HCl(aq)+ 2HCHO(aq). (1) (2). As mentioned above, the Pt precursors are reduced to Pt0 atoms at 1600C for 3hr [39]. Fig. 4.10 shows that the dispersive Pt nanoparticles on MWNTs are Pt0 because there is no significant chemical shift of binding energy in Pt4f7/2 and Pt4f5/2 with Ar+ etching [40]. Table 4.3 shows that the binding energy of Pt4f7/2 and Pt4f5/2 are developed by Ar+ etching (25mA and 3kV) with time. Finally, the Pt0 nanoparticles are stabilized on MWNTs by using ethylene glycol.. 37.
(51) Fig. 4.8 The mapping of EDX for HNO3-MWNTs. C (285.13eV) Pt (70.5eV). Intesity(a.u.). C. Pt. 1200. 1000. 800. 600. 400. 200. 0. Binding Energy (eV) Fig. 4.9 The XPS survey spectrum of HNO3-MWNTs after reduction of Pt. 38.
(52) Intesity(a.u.). 00 min sputter 03 min sputter 06 min sputter 09 min sputter. 88. 86. 84. 82. 4f7/2. 4f5/2. 80. 78. 76. 74. 72. 70. 68. Binding Energy (eV) Fig. 4.10 Chemical shift of binding energy in Pt4f7/2 and Pt4f5/2 with Ar+ etching. Table 4.3 The development of the binding energy of Pt4f7/2 and Pt4f5/2 with time. Ar+ (25mA, 3kV). 4f5/2. 4f7/2. 0 min. 75.04 eV. 71.77 eV. 3 min. 74.99 eV. 71.76 eV. 6 min. 75.03 eV. 71.77 eV. 9 min. 75.07 eV. 71.80 eV. 39.
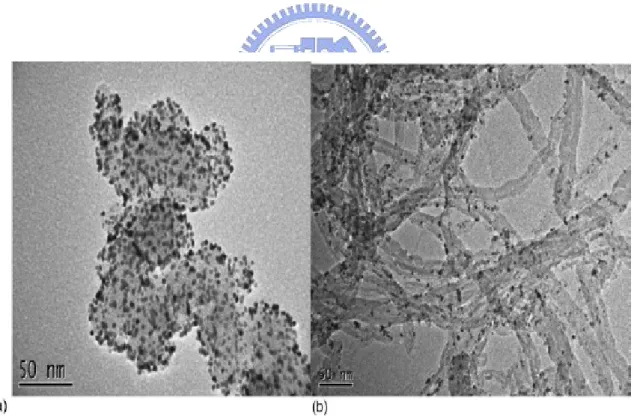
(53) 4.2.3 Analysis of dispersive Pt on MWNTs Pt nanoparticles are actually deposited onto the surface of MWNTs from the last section. Then, by comparing Pt on the raw and modified MWNTs, we would like to understand the influence of the functional groups on Pt dispersion on MWCTNs. Fig. 4.11 illustrates many Pt nanoparticles are agglomerated on some areas like a larger nanoparticle. Fig. 4.12 illustrates many Pt nanoparticles disperse uniformly on HNO3-MWNTs due to presence of the carboxylic acids (-COOH). If Pt nanoparticles were agglomerated, the total effective activating catalyst area would decrease due to the clustered shelter of Pt nanoparticles. Therefore, MWNTs have to be modified chemically in order to disperse Pt nanoparticles on MWNTs uniformly.. 4.2.4 EDX analysis of Pt on MWNTs Pt loading on carbon nanotube would be increased because more functional groups, the carboxylic acids (-COOH), act nucleation sites and make active catalyst areas large. The energy dispersive analysis in Fig. 4.13, Fig. 4.14, Fig. 4.15, and Fig. 4.16 show that the amount of Pt loaded on MWNTs with reference to carbon can be evaluated qualitatively as 16.88 wt%, 21.23 wt%, 22.84 wt%, and 26.08 wt% after the different chemical modification. The most Pt loading on MWNTs modified by HNO3 (strong oxidizing agent) in Fig. 4.17 may be suggested that the most functional groups would be formed on the surface of MWNTs at the same time with different chemical solutions.. 40.
(54) Fig. 4.11 Pt nanoparticles are agglomerated like a larger nanoparticle. Fig. 4.12 Pt nanoparticles disperse uniformly on HNO3-MWNTs. 41.
(55) Element. Weight%. Atomic%. C. 83.12. 98.77. Pt. 16.88. 1.23. Totals. 100.00 Fig. 4.13 The amount of Pt loading on raw MWNTs is 16.88 wt%.. Element. Weight%. Atomic%. C. 78.77. 98.26. Pt. 21.23. 1.74. Totals. 100.00 Fig. 4.14 The amount of Pt loading on KOH -MWNTs is 21.23 wt%.. Element. Weight%. Atomic%. C. 77.16. 98.09. Pt. 22.84. 1.91. Totals. 100.00 Fig. 4.15 The amount of Pt loading on H2SO4 -MWNTs is 22.84 wt%.. 42.
(56) Element. Weight%. Atomic%. C. 73.92. 97.87. Pt. 26.08. 2.13. Totals. 100.00 Fig. 4.16 The amount of Pt loading on HNO3-MWNTs is 26.08 wt%.. 40. Pt EDX. Pt weight %. 30 20 10 0 WO. KOH. H2SO4. HNO3. Fig. 4.17 Pt loading on MWNTs with different chemical modification. 43.
(57) 4.2.5 Half-cell test The activity of catalyst is practically important in the study on fuel cell, which is usually evaluated by the current peaks with the dispersion and the amount of catalyst. The electrocatalytic activity of Pt nanoparticles is obtained from the CV measurements performed in 1M methanol and 1M sulfuric acid electrolyte. Fig. 4.18 shows that the electrocatalytic activity of Pt nanoparticles is evaluated by the current peaks of methanol oxidation in eq. (3) and eq. (4) +. -. Pt-CO+Pt-OH. 2Pt+CO2+H +e. (3). Pt-(CH3OH)ads. Pt-(CO)ads+4H +4e. +. -. (4). As well known, it can be observed that the electrocatalytic activity of Pt nanoparticles on HNO3-MWNTs is higher than the others due to more amounts of dispersive Pt nanoparticles.. 4.2.6 Summary 1. Various solvents, eg. HNO3, H2SO4, and KOH (800C, 6 hr), modified MWNTs can form the same functional group -COOH and –OH. 2. Well-dispersed functional groups on MWNTs could improve the efficiency of half-cell test. 3. The functional groups on MWNTs increase anchoring sites of Pt precursor to increase the efficiency of half-cell test. 4. The amount of functional groups in order to attract Pt on HNO3-MWNTs is more than on H2SO4-MWNTs and on KOH-MWNTs due to a strong oxidizing agent HNO3.. 44.
(58) Current density (A/cm2). HNO3 6hr H2SO4 6hr KOH 6hr w/o. 0.08 0.06. (1). (2). 0.04 0.02 0.00 0.0. 0.2. 0.4. 0.6. 0.8. 1.0. 1.2. 2. Current density (A/cm ). Potential (V) 0.11 0.10 0.09 0.08 0.07 0.06 0.05 0.04 0.03 0.02 0.01 0.00. +. -. (1) Pt-CO+Pt-OH -> 2Pt+ CO2+H +e. W/O. KOH. H2SO4. HNO3. Chemical solution 0.08 +. Current density (A/cm ). 2. -. (2) Pt-(CH3OH)ads -> Pt-(CO)ads+4H +4e. 0.07 0.06 0.05 0.04 0.03 0.02 0.01 0.00. W/O. KOH. H2SO4. Chemical solution. HNO3. Fig. 4.18 Electrocatalytic activity is evaluated by the current peaks 45.
(59) 4.3. Multi-wall carbon nanotubes are modified by HNO3 with Temperature (T), time (t), and concentration (conc.). MWNTs are modified by HNO3, H2SO4, and KOH at high temperature in Section 4.2 and may produce the same functional groups, the alcoholic hydroxyl groups (-OH) and carboxylic acids (-COOH), to attract more Pt ions nucleating uniformly and densely. Moreover, the amount of functional groups in order to attract Pt on HNO3-MWNTs is more than on H2SO4-MWNTs and on KOH-MWNTs due to a strong oxidizing agent HNO3. However, there are the other parameters, temperature, time, and concentration, in the function of chemical modification for MWNTs. In this work, we would find the best temperature (T) for HNO3-MWNTs may produce a lot of functional groups to increase Pt anchoring sites in Table. 4.4. Furthermore, for 2M HNO3, the highest temperature would be lower 1000C to maintain the concentration.. Table 4.4 HNO3-MWNTs with different T Temperature (T). 800C. 900C. 1000C. 2M HNO3. 24 hr. 24 hr. 24 hr. 24 hr. 24 hr. 24 hr. (b.p. ~1050C) 14M HNO3 (b.p. ~1220C). 46.
(60) 4.3.1.1 Analysis of MWNTs morphology with T Fig. 4.19 and Fig. 4.20 show that there is little damage for 14 M HNO3-MWNTs at 800C and 900C for 24 hr. On the contrary, Fig. 4.21 shows that there is a serious damage for 14 M HNO3-MWNTs at 1000C for 24 hr. The total loading amount of Pt would decrease if the amount of MWCNT as support were broken. Therefore, the temperature of chemical modification would be lower than 1000C.. 4.3.1.2 Analysis of functional groups with T We try to assay the functional groups with FTIR after MWNTs are modified by 2 M or by 14 M HNO3 with temperature. Fig. 4.22(a) (b) show that oxidization with HNO3 at 900C and 1000C successfully introduced carboxylic acids (-COOH), carboxyl groups (-C=O), and alcoholic hydroxyl groups (-OH) on MWNTs surfaces. However, the functional groups of 2M and 14M HNO3-MWNTs at 800C would be difficult to be detected because of their weak response in the IR mode. It is suggested that temperature is a main factor if the oxidization of chemical reaction could proceed. Finally, 900C is the optimum temperature for 2M and 14M HNO3-MWNTs to form a lot of functional groups.. 47.
(61) Fig. 4.19 Little damage for 14M HNO3-MWNTs at 800C. Fig. 4.20 Little damage for 14M HNO3-MWNTs at 900C. Fig. 4.21 A serious damage for 14M HNO3-MWNTs at 1000C. 48.
(62) 0. 100 C 2M HNO3 24hr 0. 90 C 2M HNO3 24hr. -COOH -OH -COOH -C=O. 0. absorptions(a.u.). 80 C 2M HNO3 24hr w/o. 4000. 3000. 2000. -1. 1000. wave number (cm ) Fig. 4.22 (a) FTIR of 2M HNO3-MWNTs with different T 0. 100 C 14M HNO3 24hr. -COOH -OH -COOH -C=O. 0. 90 C 14M HNO3 24hr 0. absorptions(a.u.). 80 C 14M HNO3 24hr w/o. 4000. 3000. 2000. 1000 -1. wave number (cm ) Fig. 4.22 (b) FTIR of 14M HNO3-MWNTs with different T 49.
(63) From Section 4.3.1, the modified MWNTs at 900C form a lot of functional groups for 2 M HNO3 and 14 M HNO3. In the followed Section 4.3.2 and Section 4.3.3, we would find the other best parameters time (t) with high (14M) and low (2M) concentration (conc.) for HNO3-MWNTs may produce the most functional groups to increase Pt anchoring sites in Table. 4.5. Table 4.5 MWNTs are modified by HNO3 at 900C for 2M and 14M with t 900C. Time (hr). 2M HNO3. 00. 06. 12. 18. 24. 48. 14M HNO3. 00. 06. 12. 18. 24. 48. 4.3.2.1 FTIR of 2M HNO3-MWNTs with t The number of carboxylic acids (-COOH) would be expected by its intensity in the FTIR spectrum as MWNTs (0.01g) are diluted with a potassium bromide (KBr) dispersedly [32]. Fig. 4.23 shows that the number of carboxylic acids (-COOH) would increase with time gradually so more Pt could be anchored on MWNTs by more carboxylic acids (-COOH).. 4.3.2.2 EDX analysis of Pt/2M HNO3-MWNTs Pt loading on carbon nanotube would be increased because more functional groups, the carboxylic acids (-COOH), act nucleation sites and make active catalyst areas large. 50.
(64) The energy dispersive analysis in Fig. 4.24, Fig. 4.25, Fig. 4.26, Fig. 4.27 and Fig. 4.28 show that the amount of Pt loaded on MWNTs with reference to carbon can be evaluated qualitatively as 14.37 wt%, 16.72 wt%, 24.38 wt%, 28.21 wt%, and 26.99 wt% after the chemical modification of 2M HNO3 with time. As mentioned above, 2M HNO3-MWNTs from 12 hr to 24 hr may anchor the most amount of Pt in Fig. 4.29. Therefore, it is called stable state for the most loading of Pt.. 4.3.2.3 Half-cell test The activity of catalyst is practically important in the study on fuel cell, which is usually evaluated by the current peaks with the dispersion and the amount of catalyst. The electrocatalytic activity of Pt nanoparticles is obtained from the CV measurements performed in 1M methanol and 1M sulfuric acid electrolyte. Fig. 4.30 shows that the electrocatalytic activity of Pt nanoparticles is evaluated gradually by the current peaks of methanol oxidation. As a whole, it can be observed that the highest electrocatalytic activity of Pt nanoparticles for 2M HNO3-MWNTs range from 12 hr to 24 hr (stable state) due to the most amounts of dispersive Pt nanoparticles. However, the electrocatalytic activity of Pt nanoparticles for 2M HNO3-MWNTs decreases much significantly from 24 hr to 48 hr because MWNTs may be destroyed very much at 48 hr.. 4.3.2.4 Effective activating area The electrochemically active surface areas of the Pt nanoparticles are obtained from the CV measurements performed in 1M sulfuric acid electrolyte. A typical voltammogram is shown in Fig. 4.31, in which the potential is expressed versus that of a 51.
(65) reference platinum electrode. The hydrogen absorption and desorption peaks are clearly seen in the voltammogram at potentials between -0.1 and 0.2 V, which is consistent with those observed for platinized Pt. In detail, a redox peak at 0.5-0.7 V in all voltammograms can be attributed to the quinine and hydroquinone groups. Furthermore, there is a couple of redox peak at about 0.4 V, which may be associated with the C-O and C=O groups [41]. The electrochemically active surface area, Sact, in units of cm2/mg Pt, is calculated from the CV curves for Pt [42] by eq. (5) S act =. QH 210. (5). In which QH, in units of (mA/mg Pt) V, is the integrated area of the hydrogen adsorption region in the voltammogram and the charge for monolayer hydrogen adsorption on Pt equal to 210 μC/ cm2. To obtain the integrated area for the hydrogen adsorption peaks in Fig. 4.31, a horizontal line is drawn to correct the double-layer charging, and a vertical line is drawn to separate the molecular hydrogen region [42]. Thus, in Table 4.6, the electrochemically active surface areas of the Pt nanoparticles are evaluated gradually with the time of 2M HNO3-MWNTs due to the trend of the electrocatalytic activity of Pt nanoparticles.. 52.
(66) 0. 90 C 2MHNO3 24hr. -OH -COOH -COOH -C=O. 0. absorptions(a.u.). 90 C 2MHNO3 18hr 0. 90 C 2MHNO3 12hr 0. 90 C 2MHNO3 06hr w/o. 4000. 3000. 2000. 1000 -1. wave number (cm ) Fig. 4.23 The number of -COOH would increase with t gradually. Element. Weight%. Atomic%. C. 85.63. 98.98. Pt. 14.37. 1.02. Totals. 100.00 Fig. 4.24 The amount of Pt loading on raw MWNTs is 14.37 wt%. 53.
數據

+7

相關文件
※ Para efeitos de recolha de dados estatísticos sobre serviços e actividades do sector de convenções e exposições, foi dada continuidade à aplicação de um questionário
接枝共聚合反應是材料改質的主要技術之ㄧ,已廣泛應用於高分子材料及生
附表 1-1:高低壓電力設備維護檢查表 附表 1-2:高低壓電力設備維護檢查表 附表 1-3:高低壓電力設備(1/13) 附表 2:發電機檢查紀錄表. 附表
The prepared nanostructured titania were applied for the photoanodes of dye-sensitized solar cell.. The photoanodes were prepared by the doctor blade technique and the area
reference electrode:參考電極 indicator
Master of Arts in Interdisciplinary Cultural Studies FT, PT Master of Mediation and Conflict Resolution FT, PT Master of Social Sciences in Psychology PT The University of
雙極性接面電晶體(bipolar junction transistor, BJT) 場效電晶體(field effect transistor, FET).
[r]
