科技部補助專題研究計畫成果報告
期末報告
邁向永續消費與永續生產: 以責任歸屬為基礎之環境政策
的可計算一般均衡分析
計 畫 類 別 : 個別型計畫 計 畫 編 號 : MOST 102-2410-H-004-016- 執 行 期 間 : 102 年 08 月 01 日至 104 年 01 月 31 日 執 行 單 位 : 國立政治大學經濟學系 計 畫 主 持 人 : 李慧琳 計畫參與人員: 碩士班研究生-兼任助理人員:吳佳怡 碩士班研究生-兼任助理人員:黎俊廷 碩士班研究生-兼任助理人員:洪敏睿 碩士班研究生-兼任助理人員:林佩琪 大專生-兼任助理人員:黃家富 大專生-兼任助理人員:鄭朝元 報 告 附 件 : 出席國際會議研究心得報告及發表論文 處 理 方 式 : 1.公開資訊:本計畫涉及專利或其他智慧財產權,2 年後可公開查詢 2.「本研究」是否已有嚴重損及公共利益之發現:否 3.「本報告」是否建議提供政府單位施政參考:否中 華 民 國 104 年 04 月 30 日
中 文 摘 要 : 氣候變遷與環境問題已無時不刻在全球各地造成重大影響。 1992 年以永續發展為議題主軸的地球高峰會在 20 年後再度 於巴西里約熱內盧召開 Rio+20 會議,持續鼓吹各國採行永續 消費與永續生產(sustainable consumption and
production, SCP)策略。然而,時至此際,永續發展的挑戰 已然深化,尤其是聯合國氣候變化綱要公約國大會在過去 18 年來的氣候會議中並未達成任何實質的政策進展,這使得永 續發展的目標更加遙不可及。從政策分析的角度來看,也許 吾人該檢討現有環境經濟政策是否與國家在追求經濟發展與 強化國際競爭力的目標有所扞格,加以修訂,以期發揮預期 政策效果。需求面的有效管理(例如: 生產與消費方式的改 善)將會是最根本且具成本有效性(cost-effective)的策略。 一個有效的方式是透過價格機制來提供誘因引導生產者與消 費者改變現有生產與消費方式。然而這樣的價格機制(例如: 透過課稅以使生產與消費對於環境造成的外部成本轉化為生 產者及消費者的內部成本)應該要建立在好的計價基礎(或是 稅基)之上。本研究擬採用 Lenzen et al. (2007)所開發的 污染責任歸屬方法(shared responsibility for
environmental impact)來計算台灣經濟體中生產者與消費者 在水污染排放上的責任歸屬。此一責任分配結果可作為未來 新制環境稅的課稅基礎,據以分析此一以責任歸屬為原則的 新制稅基下消費與生產的可能衝擊與環境永續成效。 中文關鍵詞: 環境逆境、水汙染、責任歸屬、永續發展
英 文 摘 要 : Policymakers should take sustainability to heart in particular at this time when environmental pressure of all sorts loom even larger almost every day every place around the world with more and more frequent extreme weather and environmental infliction on human economies. Since the 1992 Rio Earth Summit, United Nations have been calling for sustainable
development. The “Rio+20" held in 2012 once again convened state and government heads together aiming to shape global environmental policy for sustainable development. Over the past decade, the goal of
sustainable development has been impeded due to the complication from various anthropogenic environmental pressures. It is imperative for nations to tackle the abovementioned problem and the current inefficacy in environmental economic policies—failing to spur enough motivation for conserving environment when
pursuing economic development. In the developed world, tremendous efforts have been injected into technological improvement in production, and it proves to be an effective way in augmenting the supply side. For the demand side management, a rudimentary solution to this sophisticated problem would be awareness enhancement and lifestyle change. Sound and sensible policies that offer incentives for awareness enhancement and lifestyle change will be critical to guide human behaviors towards sustainable development. Charging on the attributed
responsibility from environmental impact and pressure (pollution and resource use) could be an effective way to go towards sustainable consumption and production. In this project, we located the
responsibilities to be shared between producers and consumers, based on Lenzen et al. (2007) approach. The outcome of this study can serve as a basis for further tax incidence analysis in the aim to locate effectiveness of responsibility-based pricing
policies to reduce environmental stress while securing economic development.
英文關鍵詞: Environmental stress, water pollution, shared responsibility, sustainable development.
行政院國家科學委員會補助專題研究計畫成果報告
(□期中進度報告/▇期末報告)
邁向永續消費與永續生產: 以責任歸屬為基礎之環境政策的
可計算一般均衡分析
計畫類別:▇個別型計畫 □整合型計畫
計畫編號:
NSC 102-2410-H-004-016-
執行期間:
102 年 8 月 1 日至 104 年 1 月 31 日
執行機構及系所:國立政治大學經濟學系
計畫主持人:
李慧琳
本計畫除繳交成果報告外,另含下列出國報告,共 _1__ 份:
□執行國際合作與移地研究心得報告
▇出席國際學術會議心得報告
期末報告處理方式:
1. 公開方式:
□非列管計畫亦不具下列情形,立即公開查詢
□涉及專利或其他智慧財產權,□一年
▇
二年後可公開查詢
2.「本研究」是否已有嚴重損及公共利益之發現:▇否 □是
3.「本報告」是否建議提供政府單位施政參考 ▇否 □是,
(請列舉提供之單位;本會不經審議,依勾選逕予轉送)
中 華 民 國 104 年 4 月 20 日
Table of Contents:
ABSTRACT: ... 3
摘要: ... 4
1. INTRODUCTION ... 5
2. METHODOLOGY: APPORTIONING PRODUCERS’ AND CONSUMERS’ RESPONSIBILITY ... 11
3. KEY RESULTS AND DISCUSSION ... 22
4. CONCLUDING REMARKS ... 27
REFERENCES ... 28
Abstract:
Policymakers should take sustainability to heart in particular at this time when environmental pressure of all sorts loom even larger almost every day every place around the world with more and more frequent extreme weather and environmental infliction on human economies. Since the 1992 Rio Earth Summit, United Nations have been calling for sustainable development. The “Rio+20” held in 2012 once again convened state and government heads together aiming to shape global environmental policy for sustainable development. Over the past decade, the goal of sustainable development has been impeded due to the complication from various anthropogenic environmental pressures. It is imperative for nations to tackle the abovementioned problem and the current inefficacy in environmental economic policies—failing to spur enough motivation for conserving environment when pursuing economic development. In the developed world, tremendous efforts have been injected into technological improvement in production, and it proves to be an effective way in augmenting the supply side. For the demand side management, a rudimentary solution to this sophisticated problem would be awareness enhancement and lifestyle change. Sound and sensible policies that offer incentives for awareness enhancement and lifestyle change will be critical to guide human behaviors towards sustainable development. Charging on the attributed responsibility from environmental impact and pressure (pollution and resource use) could be an effective way to go towards sustainable consumption and production. In this project, we located the
responsibilities to be shared between producers and consumers, based on Lenzen et al. (2007) approach. The outcome of this study can serve as a basis for further tax
incidence analysis in the aim to locate effectiveness of responsibility-based pricing policies to reduce environmental stress while securing economic development.
Keywords: Environmental stress, water pollution, shared responsibility, sustainable development.
摘要:
氣候變遷與環境問題已無時不刻在全球各地造成重大影響。1992 年以永續 發展為議題主軸的地球高峰會在 20 年後再度於巴西里約熱內盧召開 Rio+20 會 議,持續鼓吹各國採行永續消費與永續生產(sustainable consumption and
production, SCP)策略。然而,時至此際,永續發展的挑戰已然深化,尤其是聯合 國氣候變化綱要公約國大會在過去 18 年來的氣候會議中並未達成任何實質的政 策進展,這使得永續發展的目標更加遙不可及。從政策分析的角度來看,也許吾 人該檢討現有環境經濟政策是否與國家在追求經濟發展與強化國際競爭力的目 標有所扞格,加以修訂,以期發揮預期政策效果。需求面的有效管理(例如: 生 產與消費方式的改善)將會是最根本且具成本有效性(cost-effective)的策略。一個 有效的方式是透過價格機制來提供誘因引導生產者與消費者改變現有生產與消 費方式。然而這樣的價格機制(例如: 透過課稅以使生產與消費對於環境造成的 外部成本轉化為生產者及消費者的內部成本)應該要建立在好的計價基礎(或是 稅基)之上。本研究擬採用 Lenzen et al. (2007)所開發的污染責任歸屬方法(shared responsibility for environmental impact)來計算台灣經濟體中生產者與消費者在水 污染排放上的責任歸屬。此一責任分配結果可作為未來新制環境稅的課稅基礎, 據以分析此一以責任歸屬為原則的新制稅基下消費與生產的可能衝擊與環境永 續成效。
1. Introduction
Policymakers should take sustainability to heart in particular at this time when climate change and environmental pressure loom even larger almost every day every place around the world with more and more frequent extreme weather and environmental infliction on human economies. Since the 1992 Rio Earth Summit, United Nations have been calling for sustainable development. In 2012, the United Nations
Conference on Sustainable Development was held in Rio de Janeiro, Brazil—an exact twenty years after the 1992 Rio Earth Summit, and thus this conference was
nicknamed as “Rio+20”—convening state and government heads together to shape global environmental policy for sustainable development. Over the past decade, the goal of sustainable development has been impeded due to the complication from the anthropogenic greenhouse gases emissions induced climate change. Sessions and sessions of United Nations Framework Convention on Climate Change (UNFCCC) Conference of Parties have not come up with global consensus on nations’ obligation to tackle climate change. This embarrassment indicates inefficacy in environmental economic policies—failing to spur enough motivation for conserving environment when pursuing economic development.
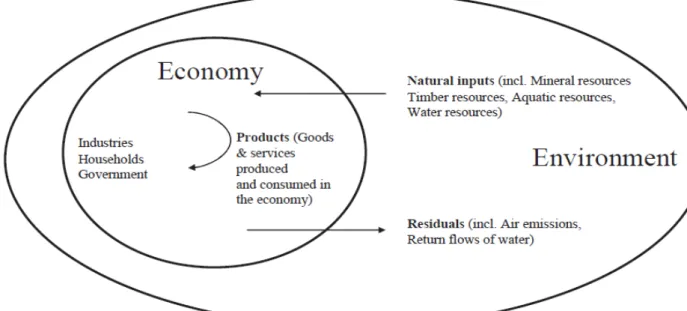
Smulders (2008) advocates that green national accounting, as opposed to the current popularly adopted national income accounting, would offer better assessment for economic welfare and sustainability of welfare by factoring in the environmental costs. Over the past two decades, tremendous research efforts have been committed to this issue, among which System of Environmental-Economic Accounting (SEEA; see Figure 1 for its role in assessing sustainable development policy) and National
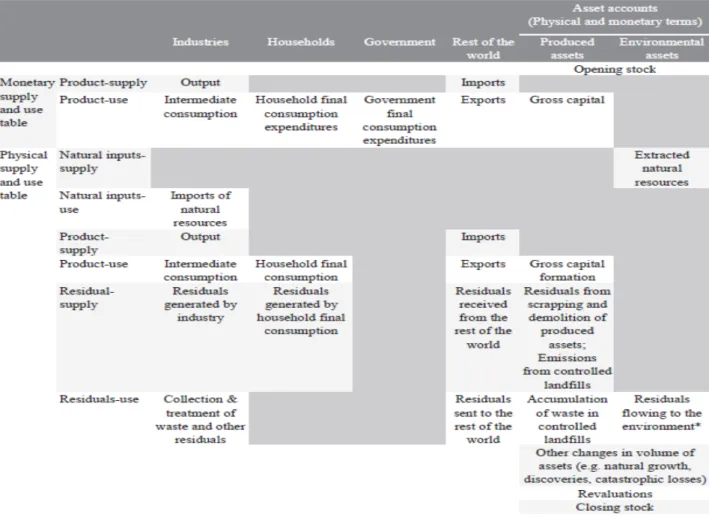
Accounting Matrix with Environmental Accounts (NAMEA; UN, 2005) enlisted international intellectuals to set up an environment integrated accounting system (see Figures 2 and 3) that are aimed at offering environmental indicators to inform
policymakers in evaluating policies towards sustainable development. Such integrated environmental economic accounting as SEEA and NAMEA has gained ground and popularity in most developed countries. SEEA and NAMEA accounting framework incorporates the environmental accounts by flanking the economic accounts in an integrated manner. SEEA and NAME record environmental impact and pressure (including air, water pollution, solid waste, natural resource use, environmental damage) caused by economic activities.
Figure 1. Role of SEEA in assessing sustainable development policy Source: UNSD (2012a).
Figure 2. Accounting scope of SEEA Source: UNSD (2012b, Figure 2.2.1)
Figure 3. Structure of SEEA
Source: UNSD (2012b, Table 2.3.4).
In addition to improved data intelligence, many methods are proposed for
evaluating sustainability-oriented policies. Environmental full cost accounting (EFCA) is suggested to be the basis for assessing economic, social, and environmental costs and benefits. This is referred to as Triple Bottom Line (TBL)—in which profit, people, and planet are considered in the policy evaluation with respect to economic, social, and ecological dimensions of a society. Various alternative approaches are also proposed for promotion of sustainable development. United Naitons Environment Programme (UNEP) proposed the ecoBUDGET (UNEP, 2012), an environmental management framework tool for local governments, in which ecological footprint is included as an indicator for sustainability. In private sectors, the concept of corporate social responsibility (CSR) (Wood, 1991) is also highly promoted and recent
development in the quantification of CSR includes the Triple Bottom Line (TBL) reporting.
such as Green Accounting and Triple Bottom Line. This is rooted in the
production-based accounting of environmental impact, with which levels of pollution, for example, is recorded on site of production. The IPCC suggested guideline (IPCC, 2006) for greenhouse gases inventory accounting takes this production perspective. Earlier international climate talks based the country-specific abatement obligations on a production accounting principle. For example, Kyoto Protocol and subsequent climate mitigation accords addressed national emissions abatement targets that only take into account emissions produced within the geographical territory of the nation. However, with the globally dispersed production network, it is difficult for
production-based accounting of environmental impact to be accepted by nations involved in exportation. Offshoring pollution by moving factories to countries with less stringent environmental regulation is readily observed over the past decade. Such carbon leakage offsets mitigation efforts of committed countries and stalls global climate talks for joint abatement of greenhouse gases emissions. The 2007-8 food price spike induced land grabbing (Borras, Hall, Scoones, White, and Wolford, 2011) and associated water grabbing (Mehta, Veldwisch and Franco, 2012; Franco and Kay, 2012) epitomized offshoring production chasing after natural resources.
Munksgaard and Pedersen (2001) proposed a consumption-based accounting principle to ascribe national responsibility for emissions. This consumption-based accounting principle attracted policymakers’ attention, especially those of
export-oriented developing countries’, as global trade becomes increasingly intensified due to the facilitation of technological progress in cross-continent
transportation. The ecological footprint (EF) indicator for measuring sustainability is also based on consumption perspective and it has recently become widely accepted in various developed and developing countries under the promotion of the Global Footprint Network (GFN, 2012a). The concept of Ecological footprint (EF) is coined by Rees (1992), Wackernagel and Rees (1998) and later further formulated by the researchers and organizations such as the Global Footprint Network (GFN, 2012b), and World Wildlife Foundation (WWF, 2008).
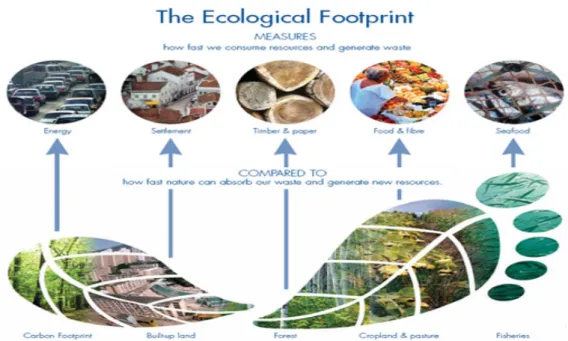
Ecological Footprint (EF) measures—in terms of global hectare (gha) which normalizes an one-hectare land based on the global average
productivity—environmental impact and pressure (e.g., pollution, and resource use) caused by human society on the capacity of the planet for sustaining the demand of global (or national) population (see Figure 4). WWF (2008) estimated that 13 billion global hectares (labeled as ecological footprint) is needed to sustain the demand of current global population. Wackernagel et al. (2002) and subsequent calculations (WWF, 2010) indicated that the global ecological footprint has been exceeding the planet’s bio-capacity every year since mid-1980’s and the gap keeps creeping up.
Figure 4. Scope of the ecological footprint indicator Source: GFN (2012).
With its current development, EF serves at best as a tool for environmental
education to promote sustainable consumption—or, as van den Bergh and Grazi (2010) criticizes, to turn unbelievers into believers in the seriousness of environmental
problems. Franz and Papyrakis (2011) argues that ecological footprint may end up dissuading behavior of sustainable consumption as the consumption of current population would in any case exceed the planet’s bio-capacity, even with the most prudent environmental friendliness in consumption. van den Bergh and Grazi (2010) raised six concerns about the Ecological Footprint indicator in its calculation method, applications and interpretations, and critiqued the policy irrelevance of EF in
suggesting the need of limiting consumption. Fiala (2008) criticizes that ecological footprint indicator did not factor in intensive production, and thus lead to erroneous comparisons to bio-capacity. Based on a developed welfare framework to analyze the spatial dimensions of sustainability which integrates relevant aspects of trade,
sustainability, global/local environmental externalities, and spatial economic structures with varying degree of industry and urban agglomeration, Grazi, van den Bergh, and Rietveld (2007) argues that ecological footprint indicator does not serve well as a good guide for regional sustainable development.
Neither allocating 100% of the responsibility of environmental impact to producers nor 100% to consumers is far from viable from the perspective of
proposes to apply the sustainomics framework (Munasinghe, 2009) by promoting joint effort by both producers and consumer to save the planet, with producers
re-examining, with the life-cycle perspective, the entire value chain from raw material extraction to consumer end use and disposal, and with consumers making informed decisions on sustainable choices of consumption. Munasinghe et al. (2009) offers illustration on how to encourage the 1.2 billion richer humans of the world that accounts for 75% of total emissions towards sustainable consumption.
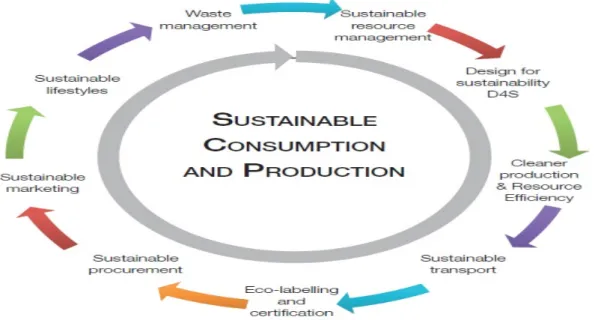
United Nations Environment Programme (UNEP) took the lead in incubating the concept of sustainable consumption and production (SCP, see Figure 5 for its
conceptual framework) since the 1992 UN Conference on Environment and
Development, held in Rio de Janeiro—from which the Agenda 21 report is developed, as a voluntary action plan towards sustainable development. Subsequent 2002 World Summit on Sustainable Development (WSSD) held in Johannesburg, South Africa, further called for countries to devote to “changing unsustainable patterns of
consumption and production” for global sustainable development. A follow-on 10-Year Framework of Programmes (10 YFP) was developed to accelerate the shift towards sustainable consumption and production, and to promote social and economic development within the carrying capacity of ecosystems by decoupling economic growth from environmental degradation (United Nations, 2002). SCP aims to help countries achieve overall development plans, reduce future economic, environmental and social costs, strengthen economic competitiveness and reduce poverty.
Figure 5. Sustainable Consumption and Production Cycle Source: UNEP (2010).
Tukker, Cohen, Hubacek, and Mont (2010) call for more research into questions pertaining to the role of policy measures to stimulate sustainable lifestyles, to
facilitate sustainable consumer behaviours, and to forge sustainable systems of
production and consumption. In the literature up-to-date, most research focused on the resulting environmental impact of production and consumption respectively.
Assessment for mitigation policies, such as carbon tax and cap-and-trade, are conducted based on the aforementioned calculation of environmental impact on site (of producers or consumers). Turner, Munday, McGregor, and Swales (2012) points out the need for identification of precisely whose responsibility for the gap between the local carbon emissions and the consumption-generated carbon footprint. Without proper attribution of the responsibility for pollution, an exporting country may well be absolved of its responsibility for pollution from exports production by switching from production accounting principle to consumption accounting principle in its
environmental accounting. In addition, it is also debatable whether 100% attribution of responsibility for the exports-produced pollution to consumers is legitimate.
Lenzen Murray, Sack, and Wiedmann (2007) proposed to split the pollution responsibility between the producers and consumer following the available economic indicator such as value-added. Attribution of the responsibility for environmental impact and pressure would be helpful for producers and consumers to make informed decision on the input selection and consumption choice. However, this responsibility map will be effective only in a society where both producers and consumers are environmentally-minded. For most countries, the status quo of economic thinking is still governed by market mechanism—that is, price (or cost) signals. With this observation and perception of the world, we adopted the Lenzen et al. (2007) approach to sharing the responsibilities for pollution (or environmental pressure) producer and consumer. This will serve as a basis for further environmental policy appraisal, particularly for tax incidence analysis and effectiveness assessment of responsibility-based environmental mitigation policies.
The report is organized as follows: Section 2 provides a description of the Lenzen et al. (2007); Section 3 presents and discusses the computation results; Section 4 concludes the report.
2. Methodology:
apportioning producers’ and consumers’ responsibility
We constructed the responsibility-apportioned environmental accounting for Taiwan of grey water (polluted water) by sector, following the approach of Lenzen et al. (2007) and Gallego and Lenzen (2005). The procedure for apportioning producers’and consumers’ responsibility for environmental impact is introduced as follows. Gallego and Lenzen (2005) first proposed a consistent formulation of shared producer and consumer responsibility based on the generalized input-output theory (Leontief, 1970). In this section we briefly introduced the Gallego and Lenzen (2005) approach in apportioning responsibility for on-site produced environmental impact among producer and consumer. Figure 6 shows the supply-chain relationship between the economic agents of a three-sector economy of electricity (e), steel (s) and car(c). Figure 7 shows the generalized input-output table of the three-sector economy, with national total produced environmental impact (CO2 emissions in this example), F, coming from on site of the electricity sector, Fe.
Figure 6. Supply chain of a hypothetical three-sector economy: electricity (e), steel (s), and car (c)
Source: Gallego and Lenzen (2005).
Electricity Steel Cars Final
demand Electricity 0 tes tec ye Steel 0 0 tsc 0 Cars 0 0 0 yc Primary inputs ve 0 vc CO2 emissions Fe 0 o
Figure 7. Generalized Input-Output table of the hypothetical three-sector economy Source: Gallego and Lenzen (2005).
Eq.
1 indicates that 100% of the responsibility is attributed to the producer on site
of CO2 emissions, Fe p , that is, the electricity sector. fe is the CO2 emissions
associated with per-unit output of electricity; xe is the output of electricity. Eq.
2
indicates that 100% of the responsibility, Fj c
, is attributed to the final consumer for
their consumption of commodity j, yj, that uses electricity as input and thus be responsible for the CO2 embodied.
p e e e x F F f (Eq. 1) e e c j j f lj F y (Eq. 2)
New formulation of the responsibility splitting starts below. Eq.
3 shows that
producer k is made to account, yk
, for its final demand (yk) and a fraction of
(1) for intermediate demand for its output, (xk – yk). The responsibility for the remaining
xkyk
is assigned to its intermediate users.
1
k k k k y y x y (Eq. 3) Eq.4 shows the allocation of responsibility associated with sector k’s output, x . k
Consumer is made accountable for a fraction of yk for its final consumption.
Sector k itself accounts for
1
yk
1
xk yk
for final consumption and the intermediate demand. Downstream sectors j are made accountable for
xk yk
assigned to final consumers of sector k
1 1 assigned to industry k
assigned to sectors j downstream from k
k k k k k k k j kj j y x y x y x y a x
(Eq. 4) Eq.5 follows similar allocation rule as in Eq. 4 to further allocation of
responsibility released from sector k to downstream sector j, according to the
input-output coefficient, a . kj
2assigned to final consumers of sector j
1 1 assigned to industry j
assigned to sectors i downstream from j
kj j kj j kj j j j kj j j kj i ji i a y a x a y x y a x y a a x
(Eq. 5)The same distribution process is repeated at each stage downstream along the
supply chain. Eq.
6 summarized the responsibility of a given sector i for buying from
a upstream sector k as lki yi , which correspond to the derivation of Leontief inverse (Leontief, 1970), that is, L
I A
1. lki yi includes the responsibility allocated to downstream sector i, lki
1
yi
1
xi yi
,
and to final consumer, lki . yi
2
ki aki ja akj ji yi lki yi
For a given sector i on the supply chain, its upstream shared responsibility, Fi , is summarized as Eq. 7.
i k fk ki yi F
l (Eq. 7)Summing all the downstream sectors i’s shared responsibility, as Eq.
8 does,
would give rise to the total upstream responsibility for the total environmental impact, F, from production.
' i ji i iF i j fjl y F
f L y (Eq. 8)Applying this responsibility sharing mechanism to the hypothetical economy as Figures 6 and 7, the electricity produced CO2 emissions, which is also the national
total, F, will be shared between the sectors along the supply chain, as Eq.
9 indicates.
That is, the electricity sector is responsible for Fe
, the steel sector responsible for
s
F , and the car sector responsible for Fc . e s c F F F F (Eq. 9)
Following the aforementioned allocation procedure, the electricity sector’s
responsibility would be calculated as Eq.
10; the steel sector’s responsibility
calculated as Eq.
11; and the car sector’s responsibility calculated as Eq. 12;
( ) ( ) ( )
[ (1 )( )]
e e ee e e e e e
F f l y f y x y
( ) ( ) ( ) (1 ) s e es s e es s F f l y fa x (Eq. 11) ( ) ( ) ( ) 2 ( ) c e ec c e ec es sc c F f l y f a a a y (Eq. 12)
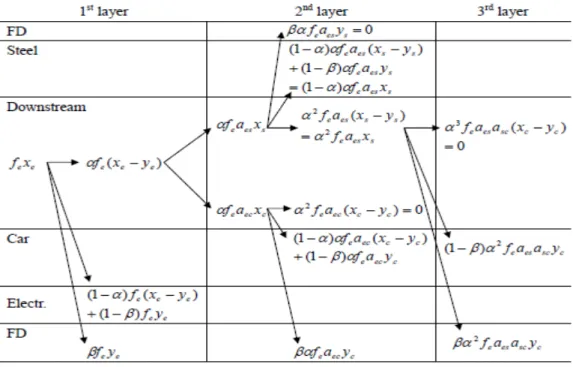
Figure 8 illustrates the multiple layers of responsibility sharing downstream along the supply chain. For a given sector, horizontal sum of the multiple layers of shared responsibility would give the shared responsibilities respectively for the
electricity sector, Fe
, the steel sector, Fs
, and the car sector, Fc . The portion e e f y in Fe
is allocated to final consumer. Similarly, a portion of
responsibility associated with car final demand, yc, is allocated to final consumers and the rest goes to the car sector.
Figure 8. Downstream re-allocation of responsibility for an initial impact (fexe) as upstream responsibilities to intermediate and final consumers (FD) Source: Gallego and Lenzen (2005).
The values of and range between 0 and 1. If is set at 0, producer takes 100% of the responsibility. If is set at 1, consumer takes 100% of the
responsibility. In addition, this approach manifests the property that the more distant a given receiving agent is away from the supplier, the less responsibility will be
supplier.
Value specification of the and transfer parameters could be chosen by the policymaker with a legitimate reasoning. Wiedmann and Lenzen (2006) use value
added as a proxy for the
1
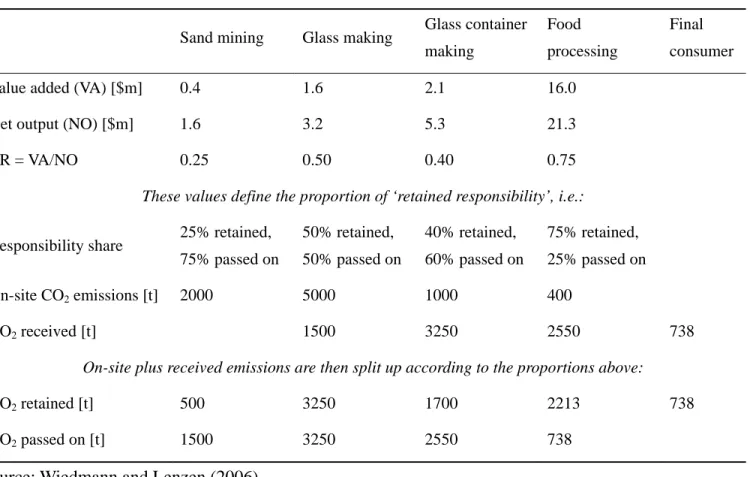
responsibility retention parameter, with the reasoning that value added of the sector reflects the capability of control and knowledge on the production process—the more knowledgeable and capable the producer is in its production, the more responsibility the producer should be ascribed with.Table 1 shows an example of sharing the responsibility for on-site CO2 emissions along a hypothetical supply chain with sand mining, glass making, glass container making, and food processing sectors, and the final consumer. The retained
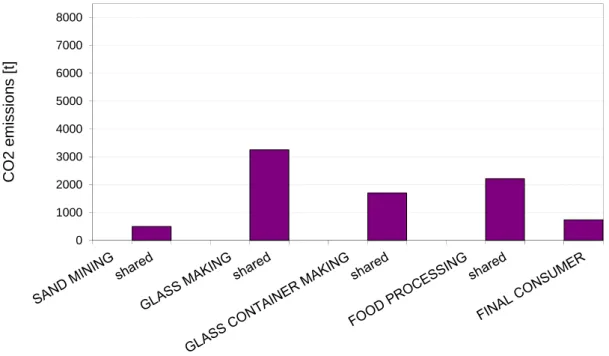
responsibility share (RR) is specified according to the ratio of value added to its net output. Figure 9 illustrates the responsibility transfer along the supply chain for each on-site emissions. The blue column of the left-hand bar for each sector indicates on-site emissions. The patterned column of the right-hand bar for each sector indicates the share transferred from one supplier to the next downstream buyer. The purple column of the right-hand bar for each sector indicates the retained
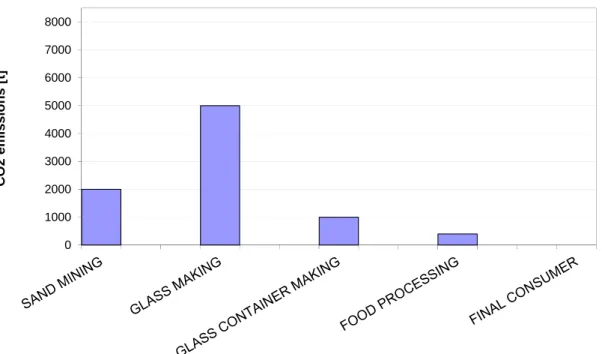
responsibility with the sector itself. Figure 10 shows the reshuffled shared
responsibility for all on-site CO2 emissions along the supply chain, as opposed to the sector-specific on-site emissions distribution (Figure 11). This hypothetical example of shared responsibility looks more convincing when one is to urge producers and consumer to be environmentally mindful.
Input-Output Accounts have been used for calculating the production-based environmental impact (e.g., pollution) as well as consumption-based ecological footprint accounting (see Wiedmann (2009) for an extensive survey of literature). Most countries compile extended input-output accounts (with environmental satellite accounts) for their national emissions estimation. Figure 12 shows the EUROSTAT estimation of CO2 emissions according either producer perspective or consumer perspective, with the concept of embodied emissions associated with imports and exports. However, either accounting principle does not offer producers and consumers enough incentive for being environmentally mindful. Environmental policies based on such emissions accounting principles could easily lead to unwelcome consequence, such as carbon leakage caused by carbon offshoring by overseas relocation of production, that end up not helping with environmental impact mitigation.
Table 1. Example of CO2 emissions responsibility sharing along a hypothetical supply chain
Sand mining Glass making Glass container making
Food processing
Final consumer Value added (VA) [$m] 0.4 1.6 2.1 16.0
Net output (NO) [$m] 1.6 3.2 5.3 21.3 RR = VA/NO 0.25 0.50 0.40 0.75
These values define the proportion of ‘retained responsibility’, i.e.:
Responsibility share 25% retained, 75% passed on 50% retained, 50% passed on 40% retained, 60% passed on 75% retained, 25% passed on On-site CO2 emissions [t] 2000 5000 1000 400 CO2 received [t] 1500 3250 2550 738
On-site plus received emissions are then split up according to the proportions above:
CO2 retained [t] 500 3250 1700 2213 738 CO2 passed on [t] 1500 3250 2550 738
0 1000 2000 3000 4000 5000 6000 7000 8000 CO2 e m issio n s [t]
Figure 9. Process of transferring responsibility for on-site emissions along the supply chain
Source: Wiedmann and Lenzen (2006).
0 1000 2000 3000 4000 5000 6000 7000 8000 C O 2 e m is s ion s [t]
Figure 10. Reshuffled shared responsibility for all on-site CO2 emissions along the supply chain
0 1000 2000 3000 4000 5000 6000 7000 8000 CO2 e m issio n s [t]
Figure 11. Sector-specific on-site CO2 emissions along a supply chain. Source: Wiedmann and Lenzen (2006).
Figure 12. Domestic and global CO2 emissions – production and consumption perspective, EU27 2006 (tonnes per capita)
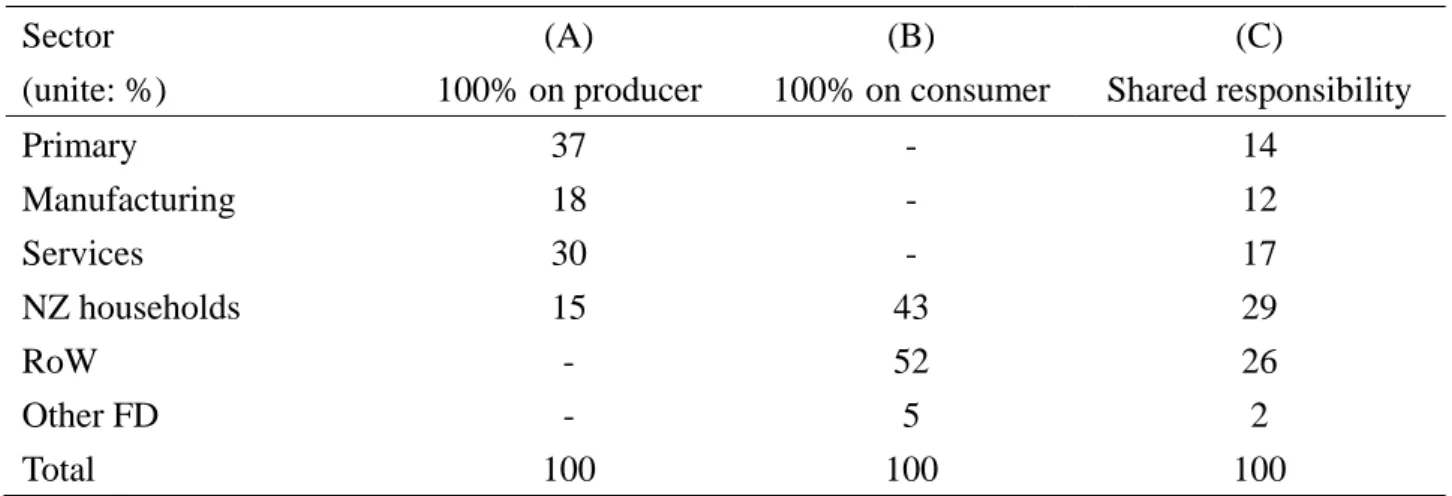
Table 2. Summaries of responsibilities for New Zealand's domestic greenhouse gas emissions using three perspectives: (A) producer responsibility, (B) consumer responsibility, and (C) shared responsibility
Sector (unite: %) (A) 100% on producer (B) 100% on consumer (C) Shared responsibility Primary 37 - 14 Manufacturing 18 - 12 Services 30 - 17 NZ households 15 43 29 RoW - 52 26 Other FD - 5 2 Total 100 100 100
Source: Andrew and Forgie (2008).
Table 2 shows the Andrew and Forgie (2008) comparison of sectoral
responsibility allocation of New Zealand’s domestic greenhouse gases emissions based on (a) producer accounting principle, (b) consumer accounting principle and (c) shared responsibility principle as proposed by Lenzen et al. (2007). Both producer accounting and consumer accounting principle give rather biased allocation of emission responsibility. The share responsibility principle would apportion more evenly among all the sectors involved in the supply chain, with both producers’ and consumers’ responsibilities reduced and foreign buyers taking some portion of New Zealand’s environmental responsibility. The shared responsibility approach proves to be favorable for an economy like New Zealand that exports in bulk emission-intensive products (e.g., meat products) to be partially absolved of its produced environmental impact. Lenzen and Murray (2010) summarizes with Table 3 the matching vocabulary for upstream and downstream responsibilities for better conceptual comprehension of this approach.
Table 3 Matching vocabulary for upstream and downstream responsibilities.
Upstream Downstream
Emissions are caused by our because we which enables
suppliers,
buy from our suppliers, our suppliers
customers,
sell to our customers,
our customers to operate. We are responsible for the
emissions that we enable by our purchases. enable by our sales. We are responsible for
emissions embodied in our purchases. enabled by our sales.
The more we buy form our suppliers, sell to our customers, the more we are responsible for their emissions.
Our responsibility is
calculated from the fraction of our purchases in the output of our
suppliers, and our suppliers’ emissions.
the fraction of our sales in the input of our customers, and our customers’ emissions. Ultimate responsibility rests
with upstream buyers of final outputs (eg households)
downstream sellers of primary inputs (eg workers and investors) Source: Lenzen and Murray (2010).
3. Key results and Discussion
We accounted for three types of water pollutants: BOD, COD and suspended solids. In this section, we use BOD as the example to present and explain for the computation results. Figure 13 shows the comparison of responsibility splits between producers and consumers. Legend PR-Z indicates producers’ wastewater responsibility for their intermediate input use; PR-y1 indicates producers’ wastewater responsibility for domestic (final) consumers; PR-y2 indicates producers’ wastewater responsibility for foreign (final) consumers; CR-y1 indicates domestic (final) consumers’ wastewater responsibility for their consumption; CR-y2 indicates foreign (final) consumers’ wastewater responsibility for their consumption (exports). Three approaches are used in this comparison. PB is the shortand for production-based acconting; SR for shared
emissions. By Lenzen et al. (2007) approach, producers’ responsibility is 1.35 times of consumers.
Figure 14 shows further split of producers’ share of responsibility by sources of demand (orders). Exports accounts for a sizable share in the composition (by order shource) of producers’ responsibility. Similarly, in the consumers’ part of the BOD responsibility, foreign demand should be responsile for nearly a half.
Figure 15 shows sectoral responsibility splits under thress alternative accounting approaches. Sectors like textile, wood products, furniture do not discharge wastewater. Nevertheless, through input use, these sectors also need to take the responsibility of wastewater emissions. Sectors, e.g., agriculture, chemical materials, pulp and paper industries, that discharged large volume of wastewater would share the wastewater responsibility with their downstream industries.
Figure 16 contrasts, by sector, producers’ and consumers’ responsibility, as well as foreigners’ share in consumers’ part. Sectors that exported the majority of their output would see significant share for foreigners’ responsibility. Such sectors are textile, chemical materials, basic metal, electronic parts, computers and optical product industries. Another reason for these sectors to see big shares is that they use inputs of high wastewater intensity.
Figure 16 tallies the decompostion of sectoral wastewater (BOD) responsibilities. Among all the sectors, textile, chemical materials, basic metal, and electronic parts industries could cut out a bigger share to their foreign consumers than the domestic counterparts (including producers and consumers). Based on our calculation, foreign consumers (exports) should be responsible for more than 40% of the sectoral
wastewater emissions.
Figure 13. Wastewater (BOD) responsibilities splits under 3 accounting approaches: macro perspective
Figure 14. Wastewater (BOD) responsibilities splits under 3 accounting approaches: domestic vs. export oriented
Figure 15. Wastewater (BOD) responsibilities splits under 3 accounting approaches: domestic vs. export oriented
4. Concluding
remarks
In this project, we located the responsibilities to be shared between producers and consumers, based on Lenzen et al. (2007) approach. The outcome of this study can serve as a basis for further tax incidence analysis in the aim to locate effectiveness of responsibility-based pricing policies to reduce environmental stress while securing economic development. Based on the Taiwan input-output accounts of 2006, as well as the wastewater emissions data of same year, we found that export-oriented
industries are currently taking a sizable share of the pollution burden for foreign consumers (export destination). If the water pollution cost is not reflected in the prices of exports, we end up subsidizing foreign consumers in terms of this externalty. It is imperative to institute pertinent policy so as not to undersell our products and resources thus consumed.
References
Alcamo, J., P.Döll, T. Henrichs, F.Kaspar, B. Lehner, T. Rösch and S. Siebert. (2003). Development and testing of theWaterGAP 2 global model of water use and availability. Hydrol. Sci. J., 48, 317-338.
Andrew, R., & Forgie, V. (2008). A three-perspective view of greenhouse gas emission responsibilities in New Zealand. Ecological Economics, 68(1–2), 201.
Chapagain, A.K. and Hoekstra, A.Y. (2008) The global component of freshwater demand and supply: An assessment of virtual water flows between nations as a result of trade in agricultural and industrial products, Water International 33(1): 19-32.
EUROSTAT. (2012). What do environmental accounts measure? Retrieved Dec. 20, 2012, from
http://epp.eurostat.ec.europa.eu/portal/page/portal/environmental_accounts/int roduction
Fiala, N. (2008). Measuring sustainability: Why the ecological footprint is bad economics and bad environmental science. Ecological Economics, 67(4), 519-525.
Fischer-Kowalski, M., Swilling, M., von Weizsäcker, E. U., Ren, Y., Moriguchi, Y., Crane, W., et al. (2011). Decoupling natural resource use and environmental impacts from economic growth, a report of the working group on decoupling to the international resource panel: United Nations Environment Programme (UNEP).
Franz, J., & Papyrakis, E. (2011). Online calculators of ecological footprint: Do they promote or dissuade sustainable behaviour? Sustainable Development, 19(6), 391-401.
Gallego, B., & Lenzen, M. (2005). A consistent input–output formulation of shared producer and consumer responsibility. Economic Systems Research, 17(4), 365-391.
GFN. (2012b). Global footprint network. from
http://www.footprintnetwork.org/en/index.php/GFN/ GFN. (2012a). National footprint accounts, 2006 edition. from
http://www.footprintnetwork.org/gfn_sub.php?content=nrb
Grazi, F., van den Bergh, J., & Rietveld, P. (2007). Spatial welfare economics versus ecological footprint: Modeling agglomeration, externalities and trade.
IPCC (2006). 2006 IPCC Guidelines for National Greenhouse Gas Inventories, Prepared by the National Greenhouse Gas Inventories Programme, Eggleston H.S., Buendia L., Miwa K., Ngara T. and Tanabe K. (eds). Published: IGES, Japan.
Kundzewicz, Z. W., Mata, L. J., Arnell, N. W., Döll, P., Kabat, P., Jiménez, B., et al. (2007). Freshwater resources and their management. In M. Parry, O. Canziani, J. Palutikof and P. van der Linden (Ed.), Climate change 2007: Impacts, adaptat ion, and vulnerability. Contribution of working group ii to the fourth assessment report of the intergovernmental panel on climate change (pp. 173-210). Cambridge University Press: Cambridge, United Kingdom. Lenzen, M., Murray, J., Sack, F., & Wiedmann, T. (2007). Shared producer and
consumer responsibility — theory and practice. Ecological Economics, 61(1), 27-42.
Lenzen, M., & Murray, J. (2010). Conceptualising environmental responsibility. Ecological Economics, 70(2), 263.
Munasinghe, M. (2009). Sustainable development in practice: Sustainomics methodology and applications. UK: Cambridge University Press.
Munasinghe, M., Dasgupta, P., Southerton, D., Bows, A., & McMeekin, A. (2009). Consumers, business and climate change. UK: Sustainable Consumption Insittute, University of Manchester.
Munasinghe, M. (2010). Can sustainable consumers and producers save the planet? Journal of Industrial Ecology, 14(1), 4-6.
Munksgaard, J., & Pedersen, K. A. (2001). CO2 accounts for open economies: Producer or consumer responsibility? Energy Policy, 29(4), 327-334. Rees, W. E. (1992). Ecological footprints and appropriated carrying capacity: What
urban economics leaves out. Environment and Urbanization, 4(2), 121-130. Smulders, S. (2008). Green national accounting. In S. N. Durlauf & L. E. Blume
(Eds.), The new palgrave dictionary of economics. Basingstoke: Palgrave Macmillan.
Tukker, A., Cohen, M. J., Hubacek, K., & Mont, O. (2010). Sustainable consumption and production. Journal of Industrial Ecology, 14(1), 1-3.
United Nations. (2002). Plan of implementation of the world summit on sustainable development. New York: United Nations.
United Nations, European Commission, International Monetary Fund, Organisation for Economic Co-operation and Development, World Bank, 2005, Handbook of National Accounting: Integrated Environmental and Economic Accounting 2003, Studies in Methods, Series F, No.61, Rev.1, Glossary, United Nations, New York, para. 2.73.
UNEP (2010). ABC of SCP clarifying concepts on sustainable consumption and production. UN: United Nations Environment Programme (UNEP). UNSD. (2012a). System of environmental-economic accounting (SEEA). United
Nations Statistics Department (UNSD). Retrieved Dec. 20, 2012, from https://unstats.un.org/unsd/envaccounting/seea.asp
UNSD (2012b). System of environmental-economic accounting: Central framework. by European Commission, Food and Agriculture Organization, International Monetary Fund, Organisation for Economic Co-operation and Development, United Nations, & World Bank. from
https://unstats.un.org/unsd/envaccounting/White_cover.pdf
Van Den Bergh, J., & Grazi, F. (2010). On the policy relevance of ecological footprints. Environmental Science & Technology, 44(13), 4843-4844.
Wackernagel, M., & Rees, W. E. (1998). Our ecological footprint : Reducing human impact on the earth. Gabriola Island, BC [u.a.]: New Society Publ.
Wackernagel, M., Schulz, N. B., Deumling, D., Linares, A. C., Jenkins, M., Kapos, V., et al. (2002). Tracking the ecological overshoot of the human economy.
Proceedings of the National Academy of Sciences, 99(14), 9266-9271. Wiedmann, T. & Lenzen, M. (2006). Sharing responsibility along supply chains - a
new life-cycle approach and software tool for triple-bottom-line accounting. Paper presented at the The Corporate Responsibility Research Conference 2006.
Wood, D. J. (1991). Corporate social performance revisited. The Academy of Management Review, 16(4), 691-718.
計畫成果自評
The outputs of this project are currently under revision for submitting to journal publication as well as conference presentation.
可供推廣之研發成果資料表
□ 可申請專利 □ 可技術移轉 日期: 年 月 日國科會補助計畫
計畫名稱: 計畫主持人: 計畫編號: 學門領域:技術/創作名稱
(無)發明人/創作人
技術說明
中文: (100~500 字) 英文:可利用之產業
及
可開發之產品
技術特點
推廣及運用的價值
※ 1.每項研發成果請填寫一式二份,一份隨成果報告送繳本會,一份送 貴單位 研發成果推廣單位(如技術移轉中心)。 ※ 2.本項研發成果若尚未申請專利,請勿揭露可申請專利之主要內容。 ※ 3.本表若不敷使用,請自行影印使用。1
國科會補助專題研究計畫出席國際學術會議心得報告
日期: 2014 年 1 月 20 日一、參加會議經過與心得
In this conference, I presented the papers titled as “China’s Spatially
Diverse Food Security under Imbalanced Population Expansion” at
the session of “China's Economy” on the first day of the conference.
This paper is not a direct output from this project, but it is an outcome
from previous year’s NSC funded project. This paper was accepted
for presentation right before the conference which was held at the
beginning of the current project.
The topics of papers presented at this conference were quite
comprehensively covering all fields of economics and issues
involving economic development particularly of Singaporean as well
as Asian economies. In addition to conventional topics in all
sub-fields of economics, themes covered in this conference are:
計畫編號
NSC 102-2410-H-004-016-
計畫名稱
邁向永續消費與永續生產: 以責任歸屬為基礎之環
境政策的可計算一般均衡分析
出國人員
姓名
李慧琳
服務機構
及職稱
國立政治大學經濟學系
副教授
會議時間
Aug. 6 – 8,
2013
會議地點
Singapore City,
Singapore
會議名稱
Singapore Economic Review Conference 2013
發表題目
China’s Spatially Diverse Food Security under
Imbalanced Population Expansion
Environmental and Energy Economics, Development Economics,
Economic & Policy Analysis, Behavioral Economics,
Neuroeconomics, Poverty, Inequality and Income Distribution, just to
name a few. The Singaporean government is very keen on economic
development, and it is also encouraging scholars in Singapore to
conduct research, be it theoretical, empirical or policy oriented, that
would be useful and of advice to the economic problems facing
Singapore. One can see from the Singaporean history how economists
have helped with the policy design and problem solving in the
development of the city state.
As a first-time participant in this convention, I learned a lot from
this conference. It was very helpful for me to attend the conference
and to get the up-to-date development in these fields. These
interesting presentations later attracted me to direct my research
interest towards development economics with IOA and CGE
modeling.
二、發表論文全文或摘要
In the governance process of China’s food security, quasi-government
regulated distribution through inter-provincial contracts is a dominant
approach not only to secure China’s food production but also to
stabilize its food price. As a result, a Chinese food policy, the
Provincial Governor’s Responsibility System (PGRS), which forces
provincial governors to assume responsibility for the grain supply [Mi
Daizi Shengzhang Zerenzhi], has been introduced in the mid-1990s
and completely implemented by the 2000s. Since then, the stability of
China’s food market has been largely contributed by the efforts of the
Chinese provinces. However, China’s dramatically surging
urbanization has challenged this quasi-government regulated
distribution, especially for this PGRS policy has discouraged local
provinces from building nationwide infrastructure to share their
surplus grain with other local provinces in need to feed increasing
urbanization immigrants. While the Chinese government has
re-emphasized the PGRS to deal with this provincial food insecurity
problem, recent research however considers the adoption of further
market liberalization to the Chinese food market in order to better
3
manage China’s food security. Therefore, starting from a research
question of whether reliance on market liberalization is better for
coping with the current urbanization challenge to China’s food
security, this paper argues that market liberalization should be
considered to meet China’s spatially imbalanced development in
different provinces. A multi-regional computable general equilibrium
(CGE) model is accordingly adopted for analysis. A major finding of
this paper is that market liberalization is more appropriate for China
to stabilize their food market.
三、建議
This is a very organized conference, involving a variety of fields in
economics. In particular, the studies focused on economic
development of the national economies. Strategies for economic
development were discussed with empirical investigations based on
sound theories. This offers a good example for economics sciences to
contribute to and to advise economic development policies. Japan and
Singapore have had such a tradition established. It would be good to
see in the near future in Taiwan that we can have such like
environment for economics researchers really advising economic
policies with sound empirical analyses based on practical and
functional theories that are capable of explaining and offering insight
and advice for the economic issues our society faces now and into the
future.
四、攜回資料名稱及內容
Material brought back from the conference was the Conference
Booklet. Proceedings and agenda of the conference are available
electronically from the Singapore Economic Review Conference 2013
website:
國科會補助專題研究計畫出席國際學術會議心得報告
日期: 2014 年 1 月 20 日一、參加會議經過
In this conference, I presented two papers, one in oral and the other in
poster, titles of which are as stated above. My oral presentation was
scheduled into the session of “Global and local analyses of food
security” on the first day of the conference program. A snapshot of the
poster presentation can be found at the end of this document.
In addition to the plenary sessions of keynote speeches, the
conference also covered the following topics of parallel sessions:
(a) Global and local analyses of food security,
(b) Enabling policies for local and global food security,
計畫編號
NSC 102-2410-H-004-016-
計畫名稱
邁向永續消費與永續生產: 以責任歸屬為基礎之環
境政策的可計算一般均衡分析
出國人員
姓名
李慧琳
服務機構
及職稱
國立政治大學經濟學系
副教授
會議時間
Sept 29 –
Oct. 2, 2013
會議地點
Noordwijkerhout,
Amsterdam, The
Netherlands
會議名稱
First International Conference on Global Food Security
發表題目
1. (Oral presentation) Grain self –sufficiency policy
shift in China posing a real challenge to global food
security: A multi-regional economy-wide impact
assessment with the GTAP model
2. (Poster presentation)
Will sea level rise threaten
food security in Asia?: A multi-regional
2
(c) Sustainable intensification of food production systems,
(d) Novel ways of feeding 9 billion,
(e) Learning from the past to understand the future,
(f) Land sparing, land sharing and trade-offs,
(g) Agricultural production as feedstock for renewables,
(h) Lost harvest and wasted food,
(i) Nutritional security, and
(j) Labelling, certifying and striving for quality and sustainability of
food production.
As the major organizer of the conference was the Elsevier
Publishing Co., an author workshop was arranged to introduce about
scientific publishing, as well as the dos and don’ts in scientific
research publication as Elservier advised. Ag. industries like
Monsanto, Unilever, Fertilizer Europe also set up exhibitions at this
conference.
二、與會心得
This interdisciplinary conference on global food security invited
state-of-the-art analysis, inspiring visions and innovative research
methods arising from research. I learned a lot from this conference.
Food security involves economic, social, biophysical, technological
and institutional aspects simultaneously. It is an issue that is affecting
the current generation and will also run into the future, with all
countries’ food policies affecting each other due to the highly
globalization in agricultural trade. The conference was nicely
arranged with a balanced composition of disciplines that addressed
food production and access, and the trade-offs between competing
environmental, economic or social objectives and outcomes.
The keynote speakers included (a) Prof. Chris Barrett from Cornell
University, USA, on “the global food security challenge: Constraints,
consequences and opportunities ahead”; (b) Prof. Louise Fresco from
University of Amsterdam, The Netherlands, on “where we stand in
understanding global food security”.
The AgMIP (Agricultural Model Intercomparison and
Improvement Project) teams also made presentations at this
conference. AgMIP is an international effort to link the dimensions of
climate, crop, and economic modeling with cutting-edge information
technology to produce improved crop and economic modeling and the
next generation of climate impact projections for the agricultural
sector (Rosenzweigh et al., 2012). The AgMIP aims to improve the
characterization of world food security due to climate change and to
enhance adaptation capacity in both developing and developed
countries. AgMIP involves multiple disciplines and conducts
trans-disciplinary analyses on the agricultural impacts of climate
variability and change for which climate scenarios and agronomic and
economic models are bundled for the purposes of a holistic analysis
on the food security issue.
It was very helpful for me to attend the conference and to get the
up-to-date development in these fields. These interesting
presentations later attracted me to direct my research interest towards
food security policy assessment with CGE on the adaptation
dimension.
三、發表論文全文或摘要
1
stpaper:
Current studies on China’s food security are mainly based on the
perspective of grain self-sufficiency that discusses whether China’s
grain production and grain stock system can feed itself at the national
level. As a result, the Chinese grain self-sufficiency policy of keeping
a self-sufficiency rate above 95% tends to be regarded as a
benchmark to evaluate China’s food security status. For the world,
this remarkably high rate of self-sufficiency in China has also helped
significantly maintain the global food security. As consistently
attained with the Chinese government’s good efforts since the 1980s,
this 95% grain self-sufficiency rate target therefore has been
perceived as untouched and presumed to be adhered to in the future,
like in the past.
However, according to the World Bank’s projection for China’s
grain demand by 2020, the total requirement to feed China will be
607.9 million tons, increasing from 502 million tons in 2010. As the
Chinese grain production is projected to be as much as 568 million
tons by 2020, the self-sufficiency rate will be reduced slightly to 93%.
Another projection by the United States Department of Agriculture
also presents a similar prospect which forecast an even lower rate of
4
89% in China’s grain self-sufficiency by 2020. Reasons for such a
lower grain self-sufficiency rate in China could be attributed to its
accelerated industrialization and urbanization which both damage and
compete away cropland at a rate of 2% per annum.
Seeing the increasing food demand and shrinking cropland due to
its rapid economic development and urbanization, China is currently
changing its food policy by taking advantage of global agricultural
trade liberalization to import foreign farm products on the one hand,
and actively acquiring farmland overseas on the other hand, so as to
bolster its food security. The International Food Policy Research
Institute (IFPRI), a think-tank in Washington, DC, points out that
between 2006 and 2009 China purchased up to 2.8 million hectares of
farmland from poor countries in Africa, the Middle East, Eastern
Europe, and South America. Such size of the grabbed foreign
farmland is unprecedentedly large, as compared with other counties’
purchase packages. Putting a conservative figure for the land value,
IFPRI calculated these Chinese deals to be worth 3.7 - 4.2
billion—almost as much as the biggest ever emergency package for
agriculture announced in 2009 by the World Bank, and 1.5 times
more than the American administration’s annual fund for food
security in 2009. The targets for China’s overseas land grabbing after
the 2008 financial crisis have been further extended to developed
countries, such as Australia, New Zealand, Canada, and even the
United States.
This practice of importing more food from the Chinese acquired
farmland abroad will eventually shake China’s long-standing norm of
the 95% grain self-sufficiency rate. In response to this developing and
ongoing story of China’s policy shift in grain self-sufficiency, this
paper aims to assess the global food security challenge resulting from
China’s adjustment in the grain self-sufficiency policy. We use a
multi-regional computable general equilibrium (CGE) model—the
GTAP model, which describes in detail the global food
supply/demand system, inter-linked with other sectors of the world
economies—to simulate for global food security prospects against the
backdrop of various scenarios of undertakings for China’s grain
self-sufficiency prospects. The simulation results indicate that while
China is inclined to relax its long-standing adherence to the high
self-sufficiency rate through trade, the global food security would be
burdened with spiked prices—with the developing and least
developed countries particularly bearing heavily the brunt of such
elevated food costs. Our study also provides an in-depth
multi-sectoral economic assessment on the consequences of the
various Chinese food security scenarios. Such understanding would
be desirable and informative for formulating effective strategies to
cope with the possible challenges posed to global food security.
Adaptation strategies are also assessed for countries whose food
security are affected by a more foreign food dependent China.
2
ndpaper:
Climate change affects agricultural production and food security in
complex ways. In this study we use a multi-regional, multi-sectoral
computable general equilibrium model (GTAP as described in Hertel
(1997)) and a satellite land use database compiled by Lee et al. (2009)
to address the agro-ecological dissimilarities in land characteristics
for agricultural production in a global and open economy context.
Assuming one-meter sea level rise induced by climate change,
information of which is taken from the World Bank estimates
(Dasgupta et al., 2011), we investigate its regionally diverse impacts
on the production of major land-based staples. Our results suggest
that food security impact inflicted by sea level rise should be
responded from policy agenda for both developing and developed
countries, in particular, for net food importing developing economies.
Insights derived from our simulation results are summarized as
follows. Among Asian countries, Viet Nam is most significantly
affected country due to agricultural extent loss to sea level rise, as its
major paddy rice is cultivated in the Mekong Delta flood zone. This
affects countries near and far that depend on Vietnamese rice exports
including Malaysia, Singapore, the Philippines, as well as countries in
Middle East, North Africa, and Caribbean and Central America. Thai
rice would only be able to supplement partially the shortfall due to the
retreat of Vietnamese rice exports. The wheat sector in the Asian
rice-growing countries would also be adversely affected, though not
directly, due to land competition from the domestic demand to secure
rice crop. Wheat- and grains-growing countries such as North
6