This article was downloaded by: [National Chiao Tung University 國立交通大學] On: 28 April 2014, At: 06:35
Publisher: Taylor & Francis
Informa Ltd Registered in England and Wales Registered Number: 1072954 Registered office: Mortimer House, 37-41 Mortimer Street, London W1T 3JH, UK
Communications in Statistics - Simulation and
Computation
Publication details, including instructions for authors and subscription information: http://www.tandfonline.com/loi/lssp20
The performance of process capability index c
s
On
Skewed Distributions
W. L. Pearn a & C. S. Chang a a
Department of Industrial Engineering & Management , National Chiao Tung University , Hsinchu , Taiwan ROC
Published online: 27 Jun 2007.
To cite this article: W. L. Pearn & C. S. Chang (1997) The performance of process capability index csOn Skewed Distributions, Communications in Statistics - Simulation and Computation, 26:4, 1361-1377, DOI: 10.1080/03610919708813444
To link to this article: http://dx.doi.org/10.1080/03610919708813444
PLEASE SCROLL DOWN FOR ARTICLE
Taylor & Francis makes every effort to ensure the accuracy of all the information (the “Content”) contained in the publications on our platform. However, Taylor & Francis, our agents, and our licensors make no
representations or warranties whatsoever as to the accuracy, completeness, or suitability for any purpose of the Content. Any opinions and views expressed in this publication are the opinions and views of the authors, and are not the views of or endorsed by Taylor & Francis. The accuracy of the Content should not be relied upon and should be independently verified with primary sources of information. Taylor and Francis shall not be liable for any losses, actions, claims, proceedings, demands, costs, expenses, damages, and other liabilities whatsoever or howsoever caused arising directly or indirectly in connection with, in relation to or arising out of the use of the Content.
This article may be used for research, teaching, and private study purposes. Any substantial or systematic reproduction, redistribution, reselling, loan, sub-licensing, systematic supply, or distribution in any
form to anyone is expressly forbidden. Terms & Conditions of access and use can be found at http:// www.tandfonline.com/page/terms-and-conditions
COMMUN.
STATIST.-SIMULA., 26(4), 1361-1377 (1997)THE PERFORMANCE OF
PROCESS CAPABILITY INDEX
Cs
ON SKEWED DISTRIBUTIONS
W. L. PEARN and C. S. CHANG Department of Industrial Engineering & Management
National Chiao Tung University Hsinchu, Taiwan ROC
Keywords and Phrases: Process capability indices; specification limits; process mean; process standard deviation, skewed distributions.
ABSTRACT
Wright (1995) considered a new process capability index C,, which extends the most useful index to date for processes with two-sided specification limits, Cpmk proposed by Pearn, Kotz and Johnson (1992). The new index C, not only takes into account the process variation as well as the location of the process mean relative to the specification limits, but also considers the asymmetry of the distribution by incorporating a penalty for skewness. Wright (1995) investigated an estimator of C, and studied its bias and variance by simulation. The simulation study, however, was restricted to normal distributions where skewness is not present. In this paper, we extend Wright's simulation study to cover some skewed distributions including chi-square, lognormal, and Weibull distributions for some parameter values. The results show that the percentage bias of the estimator increases as the skewness coefficient Il,/o'l increases. Extensive simulation results, comparisons, and analysis are provided.
1361
Copyright O 1997 by Marcel Dekker, Inc.
1362 PEARN AND CHANG
1. INTRODUCTION
Process capability indices (PCIs) have become widely used in the manufacturing industry to provide measures for process quality. Several basic indices including C,, Cpk, and C,,, (Kane (1986), Chan, Cheng and Spiring (1988)) have been proposed to monitor the process potential and process performance. These indices are useful management tools, which provide numerical measures of a process characteristic standardized by the process target and specifications. Combining the three basic indices, Pearn, Kotz and Johnson (1992) developed the index Cplnk. which is considered to be the most useful index to date for processes with two-sided specification limits. This index, designed for normal and near-normal processes, is constructed as with all process capability indices, that the larger the index, the more capable the process. The index Cpmk is defined as the following:
USL
-
pCpmk = min p
-
LSL3Jd
+
(p
-
T)' '3Jd
+
(p-
T)'] 'where USL and LSL are the upper and lower specification limits, p and o are process mean and process standard deviation, and T is the target value.
The index Cpmk provides warnings of the increase of process variation and process departure (the deviation of process mean from its target), but provides no sensitivity to the changes in the shape of the distribution, particularly, the skewness. To detect the shape changes of the processes due to skewness, Wright (1995) considered a new process capability index C, to extend CPmk. The new index C, not only takes into account the process variation as well as the departure of process mean from the target, but also the asymmetry of the distribution by incorporating a penalty for skewness. Utilizing the third central moment pg = E(X
-
p)3 as
a measure of skewness, the new index C, is defined
as the following:with p3 divided by o to ensure that the skewness term is expressed in the same units as the other terms in the denominator (Wright (1995)). Utilizing the identity min(x, y) = (x
+
y)/2-
Ix-
y1/2, the index C, can be rewritten as the following, where d = (USL-
LSL)/2:PROCESS CAPABILITY INDEX Cs
2. ESTIMATION
OF
CsT o estimate the index C,, Wright (1995) considered a complicated estimator (defined in the following). W e note that for normal samples, E[X (xi
-
T)I/n] = aZ+
(p-
T)2, E [ ( I ~ ~ ) ~ / ~ ] = {(n-l)/n}lR c4 a , and E(m3) = (n-l)(n-2) ~ 3 / n ' , where m, = ( l / n )2
(xi-
TI)' is the r-th sample central moment, and c4 = {2/(n-l)}1/2T(n/2) T{(n-1)/2}-I (see Wright (1995)).Obviously, if the third sample central moment is zero, then the estimator
C^,
A
defined above reduces to the estimator Cpmk considered by Pearn, Kotz and Johnson (1992) for the index Cpnlk The distribution of
e,
is intractable even under normality assumption. Wright (1995) used a simulation technique to compute the expected value and valiance ofe,.
The simulation study, however, was restricted to normal distributions where skewness is not present.Before investigating the performance of the estimator
e,
under nonnormal*
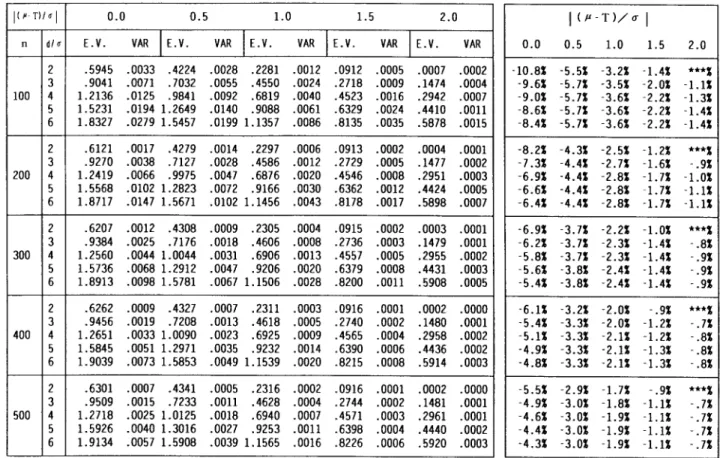
(skewed) samples, we repeat the calculation on the moments of C, based on 15,000,000 random samples of size n from the uniform distribution, U(0, 1). which are generated by AS183 generator (Wichmann and Hill (1987)) with multiple seeds using IBM RISCl600 work stations. Note that we have extended the sample size for the simulation to n = 500. Tables l(a) and l(b) display the expected
h h
values, variances, and the performance of C, in terms of percentage bias, {E(Cs) - C , ) / C , , in normal samples for various values of d / a , and I(F
-
T)/csl. Our simulation results are almost identical to those presented in Wright (1995). In the next section, we extend Wright's simulation study on percentage bias of the estimator?,
to cover some skewed distributions including the chi-squaresamples with n=10. 20. 30. 40. 50
I
( P - T ) / aI
0.0 0.5 1.0 1.5 2.0 -20.9% -6.9% -.6% 5.5% ***% -17.3% -7.3% -2.8% -.2% 1.8% -15.4% -7.5% -3.5% -1.4% -.I% -14.4% -7.6% -3.8% -1.9% -.a% -13.6% -7.6% -4.1% -2.1% -1.1% -18.3% -7.6% -3.3% .8% ***% -15.7% -8.0% -4.4% -2.0% -.4% -14.4% -8.1% -4.8% -2.6% -1.3% -13.6% -8.2% -4.9% -2.9% -1.7% -13.1% -8.3% -5.1% -3.0% -1.8% -16.4% -7.4% -3.8% -.4% ***% -14.2% -7.7% -4.5% -2.4% -.9% -13.1% -7.8% -4.8% -2.7% -1.5% -12.5% -7.9% -4.9% -2.9% -1.7% -12.1% -7.9% -4.9% -3.0% -1.9% -15.0% -7.1% -3.8% -.9% ***% -13.1% -7.3% -4.4% -2.4% -1.1% -12.1% -7.4% -4.6% -2.7% -1.6% -11.6% -7.4% -4.6% -2.8% -1.7% -11.2% -7.5% -4.7% -2.9% -1.8% -13.9% -6.7% -3.7% -1.1%***%
-12.2% -6.9% -4.2% -2.3% -1.1% -11.4% -7.0% -4.4% -2.6% -1.5% -10.9% -7.0% -4.4% -2.7% -1.7% -10.5% -7.1% -4.5% -2.7% -1.7%Table l(a). Expected value, variance. and percentage bias o f
e,
for normal50 3 4 5 6 .8779 .0134 .6937 .0106 .4516 .0047 .2709 .OD19 .I474 .0008 1.1818 .0234 .9704 .0179 .6763 -0079 .4503 .0032 .2936 .0014 1.4858 .03651.2471 .0272 .go10 .0121 .6298 .0049 .4398 .0021 1.7897 .05241.5238 .03861.1258 -0171 .a093 .0070 .5860 .0030
Table l(b). Expected value. variance. and percentage bias o f
e,
for normal samples w i t h n=100. 200. 300. 400. 5001366 PEARN AND CHANG Table 2. Characteristics of the three distributions.
...
Mean 3.00 4.00 5.00 6.00 7.00 Variance 6.00 8.00 10.00 12.00 14.00 Skewness 1.63 1.41 1.26 1.15 1.07...
...
Mean I . 1.13 1.06 1.03 1.02 V d a n c e 4.67 0.36 0.13 0.07 0.04 Skewness 6.18 1.75 1.07 0.78 0.61 ~ ( 1 , s ) 1 1 W(1,2) ~ ( l , ? )...
Mean 0.91 0.90 0.89 0.89 0.89 Variance 0.44 0.33 0.26 0.22 0.18 Skewness 1.20 0.96 0.78 0.63 0.51distribution X2(r), the lognormal distribution logN(p, oz), and the Weibull distribution W ( a ,
P).
3. ESTIMATION OF Cs FOR SKEWED DISTRIBUTIONS For skewed distributions, we consider the following three distributions: (a) chi-square distribution, X?(r), with probability density function f(x) = {T(r/2)}-1 (1 /2)r12 (x)'" - I (e)-x/2, for 0 < x < -, and degrees of freedom r = 3, 4, 5, 6, and 7;
(b) lognormal distribution, logN(p, 02), with probability density function f(x) = ( x (2n)ln 0 ) - I exp{- [In(x)
-
p]2/(202)), for 0 < x <-,
-
-
c p < -, and parameter values p = 0, and o = 1, 1/2, 1 / 3 , 1/4, and 1/5; (c) Weibull distribution, W ( a , p), with probability density function f(x) = { p (x)bl a+) exp { - (x/a)P), for 0<
x <-,
a > 0,p
> 0, and parameters a = 1 , p = 1.4, 1.6, 1.8, 2.0, and 2.2.The characteristics, including the means, the variances, and the skewness coefficients 1 p d d of the three distributions are summarized in Table 2. W e note that for chi-square distribution, XZ(r), the skewness coefficient decreases as the
PROCESS CAPABILITY INDEX Cs 1367
value of the degrees of freedom increases. For lognormal distribution, logN(0, 02). the skewness coefficient decreases as the value of o2 decreases. For Weibull distribution, W(1,
P),
the skewness coefficient decreases as the value ofP
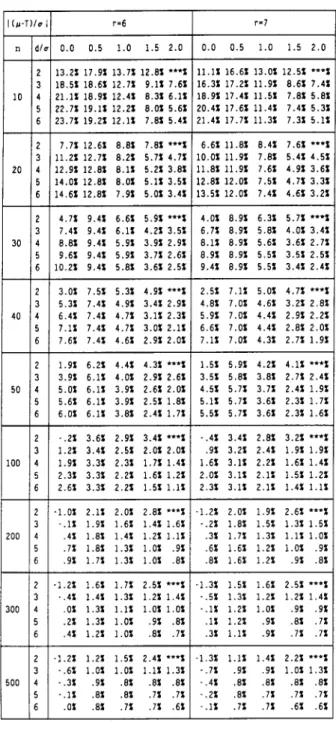
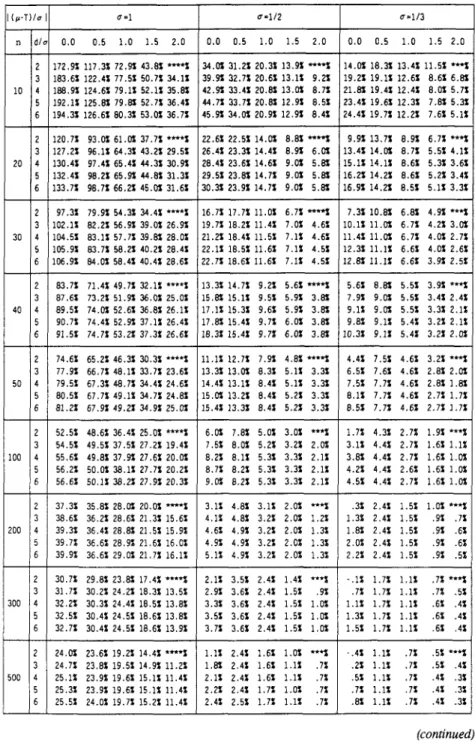
increases.Table 3 displays the results from the simulation for the chi-square distribution, X2(r), with degrees of freedom r = 3,4, 5, 6, and 7. Table 4 displays the results from the simulation for the lognormal distribution, IogN(p, 02), with p =
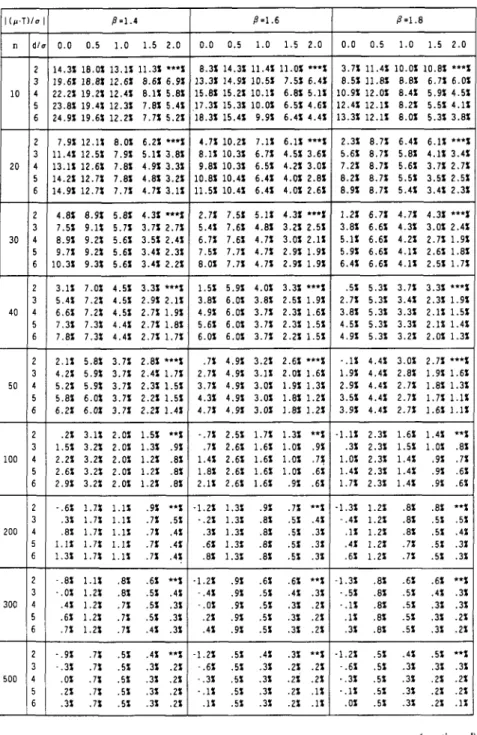
0, and o = 1, 1/2, 1/3, 1/4, and 1/5. Table 5 displays the results from the simulation for the Weibull distribution, W(a,
P),
with a = 1, andP
= 1.4, 1.6, 1.8, 2.0, and 2.2. The simulation was carried out for the following values, d / o = 2, 3, 4, 5, and 6, and I(p-
T ) / d = 0.0, 0.5, 1.0, 1.5, and 2.0. For simplicity of the presentation, the variance columns are omitted, only values of the percentages bias,{E(&
-
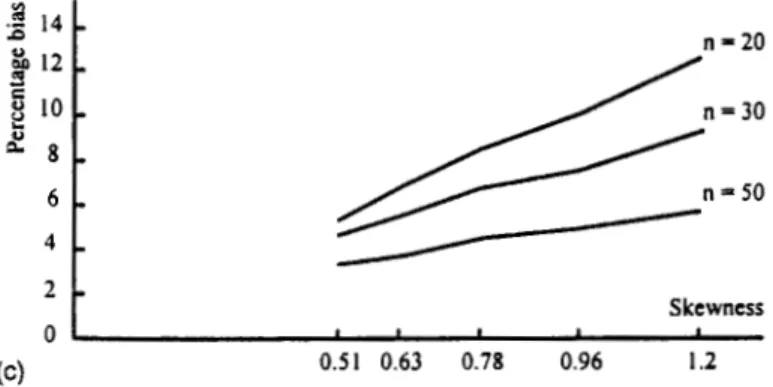
C,}/C,, are presented.In Figures 1 (a)- l(c), we plot the percentage bias versus skewness coefficient, 1k3/031, for the three distributions, with d / b = 3, 1(p
-
T ) / d = 0.5, and n = 20, 30, 50. The figures show that for all three distributions, the percentage bias, ( ~ ( c , )-
C,} /C,, increases as the skewness coefficient, Ip,/031, increases. From Tables 3, 4, and 5, we observed that this relationship remains intact for all values of d/o, l(p-
T)/ol, and sample size n. In fact, Chen and Kotz (1996) have pointed out that theA
asymptotic behavior of the estimator C, is highly sensitive to the skewness of the process distribution regardless of whether p = T or p # T.
Chen and Kotz (1996) showed that
c,
is a consistent and asymptotic unbiased estimator ofC,.
But, they did not investigate the direction of bias. For normal distribution, the bias is negative except for some cases with small n regardless of whether p = T or p # T (see Wright (1995)). For skewed distributions, thedirection of bias is quite different. Tables 3, 4, and 5 show that for the three distributions, Xz(r), logN(0, 02). and W(1.
P),
the bias is positive for all n if the process is off-target (p # T). On the other hand, if the process is on-target (p = T), the bias tends to be positive for small n, and negative for large n.In order to find the interpretations for such different behaviors of
e,
between the normal distribution and skewed distributions, we consider the estimator, L / s , of the term p3/o in the denominator of C, defined in Wright (1995) We perform the same simulation for ;3/s and calculate the percentage bias { E G 3 / s )-
k3/o}/(p3/o). The results, which are displayed in Tables 6(a)-6(c), indicate thatPEARN AND CHANG Table 3. Percentage bias of
e,
for chi-square distribution.x2(r), with r=3, 4, 5, 6, and 7.
PROCESS CAPABILITY INDEX Cs
Table 3. (continued) Percentage bias of
e,
for chi-square distribution, x2(r), with r=3, 4, 5, 6, and 7.Skewness
Figure l(a). Percentage bias plot for P ( r ) distribution,
r = 3.4.5, 6, 7, d/u = 3, 1(p
-
n/ul = 0.5, n = 20.30, 50..a
100, .a n = 205
=
80-
n = 3 0 2 n = 50 20 Skewness 0Figure l(b). Percentage bias plot for logN(0,az) distribution,
o = 1, 112, 113, 114, 115, d/a = 3, 1(p
-
T)/al = 0.5, n = 20, 30, 50.2
Skewness
0 I
,
(c) 0.51 0.63 0.78 0.96 1.2
Figure l(c). Percentage bias plot for W(1,P) distribution,
p
= 1.4, 1.6, 1.8, 2.0, 2.2, d/o = 3, 1(p-
T)/d = 0.5, n = 20, 30, 50.PROCESS
CAPABILITY INDEX
Cs 1371Table 4. Percentage bias of
e,
for lognormal distribution, logN(0,u2), with u = l , 112, 113, 114, and 115.(continued)
1372 PEARN AND CHANG Table 4. (continued) Percentage bias of
e,
for lognormal distribution, logN(0,u2),with u=1, 112, 113, 114, and 115.
PROCESS CAPABILITY INDEX Cs
Table 5. Percentage bias of
e,
for Weibull distribution, W(l,P), with P=1.4, 1.6, 1.8, 2.0, and 2.2.(continued)
1374 PEARN AND CHANG Table 5. (continued) Percentage bias of
e,
for Weibull distribution, W(l,P),with P=1.4, 1.6, 1.8, 2.0, and 2.2.
P - 2 . 0 P . 2 . 2
PROCESS CAPABILITY INDEX Cs
Table 6(a). Percentages bias ofG3/s for X2(r).
Table 6(b). Percentages bias of p3/s for l o g ~ ( 0 , 0 2 ) .
Table 6(c). Percentages bias of G3/s for ~ ( 1 , (3).
1376 PEARN AND CHANG for all three skewed distributions, the bias of C3/s is negative. The under-estimate of f;3/s for the term p 3 / 0 results in a reduction for the value of the denominator of
?,.
Consequently,?,
over-estimates C,, and the bias becomes positive.4. CONCLUSIONS
Wright (1995) considered a new process capability index C,, which takes into account the process variation, the location of the process mean relative to the specification limits, and the asymmetry of the distribution. Wright (1995) investigated an estimator of C, and studied its bias and variance by simulation for normal distributions where skewness is not present. In this paper, we extend Wright's simulation study to cover some skewed distributions including chi-square, lognormal, and Weibull distributions.
The result show that for all three skewed distributions, the percentage bias,
{E(?,)
-
C,)/C,, increases as the skewness coefficient, Ip3/afl, increases. For the normal distribution, the bias is negative except for some cases with small n regardless of whether p = T or p # T. For skewed distributions, the bias is positivefor all n if the process is off-target (p # T). On the other hand, if the process is on-
target (p = T), the bias tends to he positive for small n, and negative for large n. Although the index C, is sensitive to skewed distributions, and has some interesting properties over CPlllk. but the estimator
?,
proposed by Wright (1995) is highly unstable in the presence of skewness. In fact,.-.
we demonstrated that the percentage bias, {E(C,)-
C,) /C,, increases as the skewness coefficient 1p3/031 increases for the three typical skewed distributions we investigated. Evidently, for the index C, to be acceptable by the practitioners a more stable estimator is needed.5. ACKNOWLEDGEMENT
The authors would like to thank the anonymous referees for their careful reading of the paper and several suggestions which improved the paper.
REFERENCES
Chen H. and Kotz, S. (1996). An asymptotic distribution of Wright's process capability index sensitive to skewness. Jounlnl of Statistical Computation &
Simulation. To appear.
PROCESS CAPABILITY INDEX Cs 1377 Chan, L.K., Cheng, S.W. and Spiring, F.A. (1988). A new measure of process
capability: C,,. Journal of Qrtrrlity Technology, 20(3), 162-175.
Kane, V.E. (1986). Process capability indices. Journal of Quality Technology, 18(1), 41-52.
Pearn, W.L., Kotz, S. and Johnson. N.L. (1992). Distributional and inferential properties of process capability indices. Jortrnal of Quality Technology, 24(4), 216- 233.
Wichmann, B.A. and Hill, I.D. (1982). An efficient and portable pseudo-random number generator. Jorirnol of the Royol Stntistical Society, Series C, 31(2), 188-190. Wichmann, B.A. and Hill, I.D. (1984). Correction to AS183: an efficient and portable pseudo-random number generator. Jo~trnal of the Royal Statistical Society,
Series C, 33(1), 123.
Wichmann, B.A. and Hill, I.D. (1987). Programming insight: building a random number generator. Byte, 12(3). 127-128.
Wright, P.A. (1995). A process capability index sensitive to skewness. Journal of
Statistical Cornprimtion & Simrrltrtion, 52, 195-203.
Received October, 1996; Revised May, 1997.
.-L