國 立 交 通 大 學
管理科學系碩士班
碩士論文
消費者特性與網路使用動機
對網路購物之影響研究
Internet Based Consumer Characteristic and Motivations and the
Effect on Online Shopping
研 究 生:陳建中
指導教授:張力元 博士
張家齊 博士
消費者特性與網路使用動機對網路購物之影響研究
Internet Based Consumer Characteristic and Motivations and the Effect
on Online Shopping
研 究 生:陳建中 Student:Chien-Chung Chen
指導教授:張力元 博士 Advisor : Dr. Charles V. Trappey
張家齊 博士 Dr. Chia-Chi Chang
國 立 交 通 大 學
管 理 科 學 系
碩 士 論 文
A Thesis
Submitted to Management Science Department College of Management
National Chiao Tung University In Partial Fulfillment of the Requirements For the Degree of Master of Business Administration
In Management Science June. 2005
Hsin-Chu, Taiwan, Republic of China
消費者特性與網路使用動機對網路購物之影響研究
研究生:陳建中 指導教授:張力元 博士
張家齊 博士
國立交通大學管理科學系碩士班
中文摘要
本研究主要在探討網路使用者之消費者特性、網路使用動機與兩
者之交互作用對於網路購買意願的影響。以問卷的方式對網際網使用
者進行抽樣調查、收集資料。本研究結果顯示,女性網路使用者之網
路購買意願比男性較高,且年輕的消費族群和較高所得的網路使用者
也具有較高的網路購買意願。在網路使用動機方面,網路購物和交易
安全關心與社會化動機是呈現負相關,即愈重視交易安全和社會化動
機愈高者愈不會在網路購物。而資訊動機和經濟動機則和網路購買意
願呈現正相關。在消費者特性與網路使用動機之交互作用方面,本研
究發現交易安全關心與消費者價格敏感度之交互作用與網路購買意
願是呈現正相關,即交易安全關心愈高、消費者價格敏感度愈高時,
購買意願會提高。而在交易安全關心與消費者品牌比較傾向之交互作
用與網路購買意願是呈現負相關,即交易安全關心愈高、消費者品牌
比較傾向愈高時,購買意願反而會下降。
關鍵字:網路購物、網路使用動機、消費者特性
Internet Based Consumer Characteristic and Motivations and the Effect
on Online Shopping
Student: Chien-Chung Chen Advisors: Dr. Charles V. Trappey
Dr. Chia-Chi Chang
National Chiao Tung University
Department of Management Science
Abstract
The purpose of this research is to examine the Internet using motivations, consumer characteristic, and the interaction effects between Internet using motivations and consumer characteristic on the effects of online shopping. Therefore, Internet users were used as the target of sampling for data collection by questionnaires. The result of this study indicates that the female are more likely shopping online than male, the younger consumers are more likely shopping online, and the consumers with more personal disposable income have more purchasing intention. In the aspect of Internet using motivations, shopping online is negatively related to transaction-based security and privacy concerns and socialization motivation. But the information motivation and economic motivation are both positive effect on the online shopping. In the aspect of interaction effect between Internet using motivations and consumer characteristic, the interaction effect between transaction-based security and privacy concerns and price sensitivity has a positive effect on the online shopping. But the interaction effect between transaction-based security and privacy concerns and brand comparison inclination has a negative effect on the online shopping.
Acknowledgement
This master thesis was written under the supervision of Department of Management Science at National Chiao Tung University. First, I would like to thank Dr. Trappey who supervised my scheduled progress of thesis so that I could finish my thesis as scheduled. . Furthermore, I would like to thank Dr. Wang who helped me to solve the methodology of thesis. Finally, I would like to thank Dr. Chang since she provided insightful opinions about my questionnaire design and thesis writing. She also cheered me when I’m upset after oral defense. Thank you, Dr. Chang!!
In addition, I would like to thank many people who have made contributions in the survey, including my classmate Chun-Peng Chen who discussed the data analysis with me and worked in research room together. My roommate Yen-Shu Huang who helped me finished my online questionnaire interface. And other friends in ms92g gave me supports during these two years. I also appreciate the opportunity that my parents gave to accomplish my master degree, and my brothers gave me the greatest support so that I could accomplish my thesis. Thanks!!
Chien-Chung Chen National Chiao Tung University
Table of Contents
中文摘要...i
Abstract ...ii
Acknowledgement ...iii
Table of Contents ...iv
List of Tables ...vi
List of Figures ...vii
CHAPTER 1 Introduction ...1
1.1 Research Background and Motivation ...1
1.2 Research Purpose ...2
1.3 Chapters and Flows ...3
CHAPTER 2 Literature Review...5
2.1 Internet Using Motivations and Concerns ...5
2.2 The Consumer characteristic...8
2.2.1 Price Sensitivity ...8
2.2.2 Brand Comparison Inclination ...9
2.3 Relation among Demographics, Internet Using Motivations, Consumer characteristic, and Online Shopping ...10
2.3.1 Relation between Demographics and Online Shopping... 11
2.3.2 Relationship between Consumer Characteristic and Online Shopping ... 11
2.3.3 Relationship between Internet Using Motivations and Online Shopping ...12
2.3.4 Interaction between Internet Using Motivations and Consumer characteristic...13
CHAPTER 3 Methodology ...18
3.1 The Subjects of Research and Sampling Method ...18
3.1.1 Subjects of Research ...18
3.1.2 Sample Size...19
3.1.3 Sampling Method...20
3.2 Questionnaire Design...20
3.3 The Operational Definition and Measure of Variables...21
3.3.1 Consumer Characteristic ...21
3.3.2 Internet Using Motivations ...22
3.3.3 Demographic...23
3.4 Analytic Methods...24
3.4.1 Descriptive Statistics...24
3.4.2 Reliability and Validity Analysis...24
3.4.3 ANOVA and LSD of Multiple Comparisons...25
3.4.4 Pearson’s Product-moment Correlation Analysis...25
3.4.5 Stepwise Regression Analysis...25
CHAPTER 4 Data Analysis ...27
4.1 The Structure of Samples...27
4.2 The Reliability and Validity of Independent Variables ...32
4.2.1 The Reliability and Validity of Internet Using Motivations ...33
4.2.2 The Reliability and Validity of Consumer Characteristic...36
4.3 The ANOVA and Multiple Comparisons of Independent Variables and Demographic Variables 38 4.3.1 The ANOVA of Gender Variable...38
4.3.2 The ANOVA of the Age Variable ...39
4.3.3 The ANOVA of Educational Level Variable ...41
4.3.4 The ANOVA of Occupation Variable ...42
4.4 Correlation Analysis ...45
4.5 Regression Analysis...47
4.5.1 Stepwise Regression ...47
4.5.2 The Interactions in Stepwise Regression Model ...50
CHAPTER 5 Discussions and Conclusions ...54
5.1 The Summary of Results of Hypotheses...54
5.1.1 The Category of Demographics of Hypotheses ...54
5.1.2 The Category of Internet Using Motivations ...55
5.1.4 The Category of Interactions of Hypotheses...55
5.2 Conclusion ...58
5.2.1 Academic Meanings...58
5.2.1 Practical Meanings...58
5.3 Research Limits ...61
5.4 Research Direction in the Future ...61
Reference ...62
Appendix 1 Questionnaire Context ...67
Appendix 2 Network Questionnaire...72
List of Tables
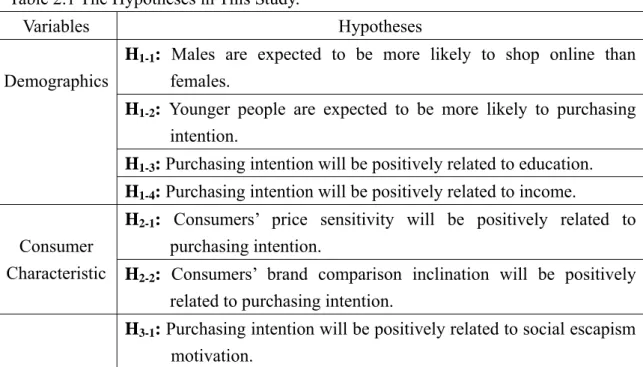
Table 2.1 The Hypotheses in This Study...14
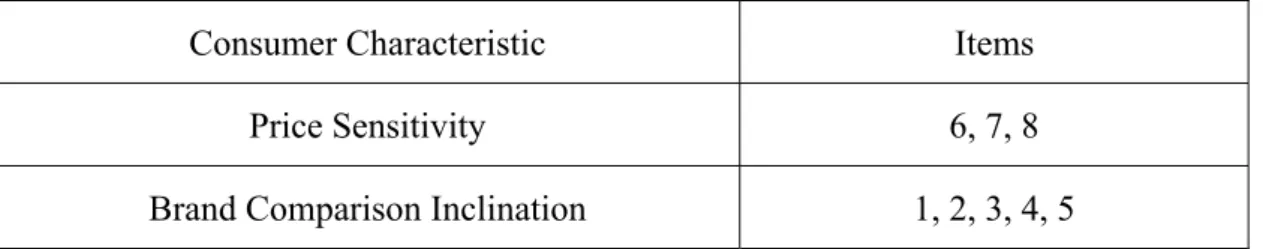
Table 3.1 Items for Consumer Characteristic. ...22
Table 3.2 Items for each Internet Using Motivation. ...22
Table 3.3 Items for Online Shopping Behavior. ...23
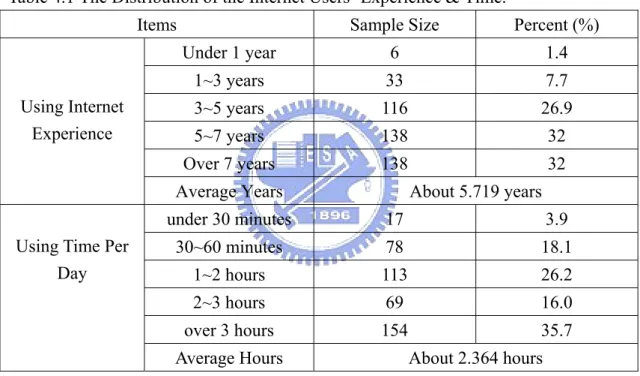
Table 4.1 The Distribution of the Internet Users’ Experience & Time...28
Table 4.2 The Distribution of the Internet Users’ Shopping Experience...28
Table 4.3 The Distribution of the Internet Users’ Buying Amount of Money. ...29
Table 4.4 The Distribution of the Internet Users’ Purchasing Intention...29
Table 4.5 The Distribution of the Internet Users’ Buying Items. (Multiple Choices) ...30
Table 4.6 The Distribution of the Demographic Variables...31
Table 4.7 Factor Analysis Results of the Internet Using Motivations. ...34
Table 4.8 Factor Analysis Results of the Consumer Characteristic. ...37
Table 4.9 The ANOVA of the Gender Variable...39
Table 4.10 The ANOVA of the Age Variable. ...40
Table 4.11 The ANOVA of Educational Level Variable. ...41
Table 4.12 The ANOVA of Occupation Variable. ...44
Table 4.13 The Mean, Standard Deviation, and Correlation Matrix of Independent and Dependent Variables...46
Table 4.14 Stepwise Regression Model ...49
List of Figures
Figure 1.1 Research Flows...4
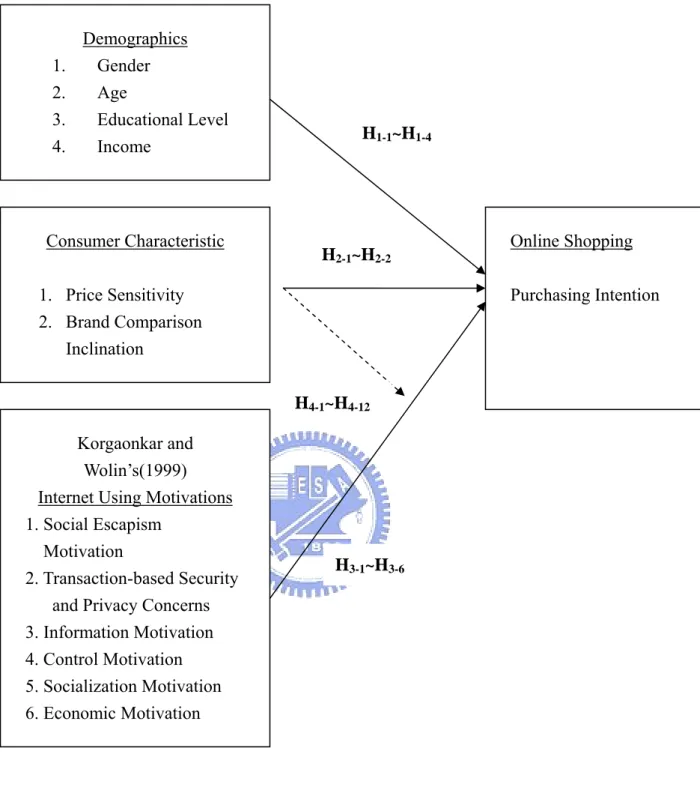
Figure 2. 1 Research Framework ...17
Figure 4.1 Interaction of Price Sensitivity and TP ...51
Figure 4. 2 Interaction of Brand Comparison Inclination and TP...53
CHAPTER 1 Introduction
This chapter consists of three sections. The first section introduces the rapid development of electronic commerce and research motivation. The second seciton is about referring to research problems in this study. The last part simply describes the research flows of this thesis.
1.1 Research Background and Motivation
According to the Yankee Group public data on August in 2003, America has 18.9 million accounts to use broadband transmission which includes Cable Modem, DSL, T1 special railway line, wireless broadband transmission, or a satellite. It predicts American broadband transmission will reach 26.2 million accounts in the end of 2003 and it will grow to 61.5 million accounts in the end of 2008. According to eMarketer’s survey, there are 550 hundred million dollars in American B2C electronic commerce in 2003, 72.6 billion dollars in 2004, and 88.1billion dollars in 2005. In Taiwan, according to the Focus on Internet News & Data survey the dial-up and broadband transmission accounts. The broadband transmission accounts grow from 2.26 million in 2003 to 3.08 million in 2004. The broadband transmission accounts rate is the fourth in the world. There are totally 6.7 million accounts to use Internet at home in Taiwan. These data indicate the diffusion of the Internet, the broadband transmission rapid grown, and the electronic commerce trend is rapid developing.
When the technology progresses quickly, the Internet provides some business functions. For example, it includes taking information, a sale tools, a whole world channel, and a customer support tools (Peterson, Balasubramanian, Bronnenberg, 1997, Korgaonkar and Wollin 1999). The phenomenon indicates it is important for the
impact of electronic commerce. The consumer behavior is changing. We can not ignore the online shopping in the future.
In past, the literature of the online shopping could be divided into two parts. One is the consumers’ characteristic, the other is the consumer characteristic. What kinds of consumer will want to shop online, and what kinds of products do they buy? What is the consumer’s motivation to use Internet? The related literature had explored the influence of the Internet using motivations on the effect of the online advertisement attitudes and online shopping (Korgaonkar, and Wolin, 1999; Joines, and Scheufele, 2003). The influence of the consumer characteristic on the effect of the online shopping is also examined. (Kau, Tang, and Ghose, 2003). But the past literature ignore when the consumers shop online and consider the consumer characteristic whether be affected by Internet using motivation or not. Furthermore, the interactive effect may lead the online shopping behavior changed.
Due to the past literature almost explored the single research, this study will use the consumer characteristic to be a moderator variable between the Internet using motivations and online shopping. This study expects to find the interaction effect between these variables and to understand whether the difference of consumer characteristic affects the online shopping result or not.
1.2 Research Purpose
Why the consumer behavior is changing and accepting shopping online? What are their concerns and motivations to use Internet shopping? Do consumer characteristic affect Internet shopping or not? Do the interaction effects between Internet using motivations and consumer characteristic affect Internet shopping or not?
2. The effect of demographic on the online shopping.
3. The consumer characteristic will influence their shopping online or not.
4. The interactive effect on the Internet using motivation and the consumer characteristic whether the result of the online shopping will change or not.
1.3 Chapters and Flows
This study can be divided into five parts. This first chapter is introduction about the electronic commerce, the motivation, the research purpose, and the direction of the study is forward. The second chapter is literature review which discusses about the Internet using motivation, and the consumer characteristic. The third chapter is this study’s research framework, hypothesis, data source, variables, and methodology will be described. In Chapter 4, the empirical results and the sample description will be described. Last, in chapter 5 will discuss the conclusions, the management meanings, how to apply the results to marketing in the Internet, the research limitations and future research.
Figure 1.1 Research Flows
Collect Literature and Review
Establish Research Direction
Data Analysis Questionnaire Survey
Create Research Framework and Hypothesis
Questionnaire Design and Modify
Examine and Prove the Hypothesis
CHAPTER 2 Literature Review
This chapter consists of three sections. The first section introduces the Internet using motivations and concerns in Section 2.1. The second section is about the consumer characteristic which includes price sensitivity and brand comparison inclination in Section 2.2. The final section is the relation among demographics, Internet using motivations, consumer characteristic, and online shopping. In Section 2.3, it detailed the relationship among each variable and finally listed all the hypotheses of this thesis in Table 2.1.
2.1 Internet Using Motivations and Concerns
Motivation refers to the processes that lead people to behave as they do. It occurs when a need is aroused that the consumer wishes to gratify. To understand the motivation is to understand why consumers do what they do. Eighmey and Lola (1998) found that the consumers use Internet to view commercial Website. The motivations include the entertainment, information, personal involvement, and continuing relationship. They could use Internet to view the advertisement, find what they want to obtain product information, talk to others on the Internet.
When consumers shop online, they must give their personal information and credit card numbers to transaction. The personal privacy information and the security of transaction is very important concern to the customer to shop on-line. Mitra et al. (1999) also found when the Web user who has little trust of online shopping security, they will not shop online. According to the Harvard Business Review (1997), the invasion of privacy is defined as, “the unauthorized collection, disclosure, or other use of personal information as a direct result of e-commerce.
Salisbury et al. (1998) had previously indicated that retailers who convince Web user that Web retailing sites are secure environments of retail exchanges are also likely to improve the Web user’s perceived usefulness for shopping. Korgaonkar and Wolin (1999) use a multivariate analysis to find the factors of Internet using motivations. They find these significant factors:
Factor 1: Social escapism motivations
The motivation is that the Internet users consider the Internet is an interesting activity and can let them to escape the real world. That concept is similar to the escapism reality to search the happy, entertainments. Using the Internet escape the really world.
Factor 2: Transaction-based security and privacy concerns
The Internet users concern the transaction security on the Internet. The personal privacy information and the security of the credit card numbers are both they concern. The motivation stands for the important to the transaction security and personal privacy information.
Factor 3: Information motivation
The Internet users can obtain the data which they want and need via Internet. They use Internet to collect a great quantity of data and to classify becoming the information (Ghose and Dou 1998). These motivations lead the Internet prevail around the world and attract many new users to surf on Internet.
Factor 4: Interactive control motivation
The Web users attracted to sites with many interactive features (Ghose and Dou, 1998). The interactive control function means the Internet users can choose the web sites which they want to surf and which they favor. They can surf anytime and chat to others on Internet. They can join the community which the virtual team of the common favor something or someone to talk, chat, exchange their thinking or
opinions each other. The interactive control function of Internet makes users can personalize themselves. That is one of the reason the Internet could attract mass people to use it.
Factor 5: Socialization motivation
The socialization factor represents the role of the Web as a facilitator of interpersonal communication and activities. A similar sharing of experience and knowledge with friends about different Web sites provides a strong reason for using the Web. Consumers look at the Web as a place in which they can interact and socialize with others with similar interests. A key to profitability on the Web for many companies will be their abilities to build virtual communities on the Web for their customers, like bulletin boards, chat room, ICQ, and MSN.
Factor 6: Economic motivation
This factor shows that the users collect information for learning and educational purpose, and for shopping and buying motivations. When shopping for big-ticket items where price comparisons in an information-rich environment are easy, and the potential for savings significant, the economic motivation to shop on the Web could be strong (Anders, 1998).
This study suggests that Web users’ motivations and concerns correlate significantly with the number of hours per day spent on the Web, the percentage of time spent on the Web for both personal and business purposes, and the user’s purchasing behavior. According above literature, this study will use six motivations which most of the previous researches discuss to explore the effect on the online shopping.
2.2 The Consumer characteristic
According to the literature, this study chose the price sensitivity and brand comparison inclination to be the variables of consumer characteristic. In this section, this study introduces the price sensitivity of the consumer characteristic in Section 2.2.1, and the brand comparison inclination of the consumer characteristic in Section 2.2.2.
2.2.1 Price Sensitivity
Monroe (1971) defined the price sensitivity is as the product price rise to a particular price range the consumers will not have a purchasing intention to buy the product or will rather purchase the substitutes of other brands. Therefore, this study defines the consumers could tolerate the range of price rise higher (lower), their price sensitivity are lower (higher).
Korgaonkar (1984) had concluded that non-store shopping would be more appealing to price oriented individuals. Interestingly, the Graphic, Visualization, and Usability Center (GVU) surveys indicate price is the least important factor in conducting online purchases (GVU, 1998). GVU suggested that price may not be important to this innovative community which was Internet, because of their high median income and rather than focusing on price, these consumers appeared to want reliability and quality information.
But consumers may use the price as an indicator of product quality (Suri, Long, and Monroe, 2003). For example, the higher (lower) the price, the higher (lower) quality. The relationship between price and perceived quality was based on Heuristic Systematic Model (HSM; Chaiken, 1980). The model enabled consumers to use an
external attribute which like price to evaluate the product’s quality (Pechmann ,and Ratneshwar, 1991).
Phau and Poon (2000), this study had presented empirical findings of Internet shopping in Singapore. The product price was one of the factors which influence significantly the consumers shop online. Degeratu, Rangaswamy, and Wu (2000), this study also indicates price was the significant factor of consumer choice behavior in online shopping and traditional supermarkets.
2.2.2 Brand Comparison Inclination
Farquhar (1989) defined the brand is a name, a sign, a design or a symbol; it could increase the functional benefit of product itself, and increase the value of external functional benefit. And the American Marketing Association also defined the brand is a name, a sign, a design or the united above conceptions. The brand was used ensuring the sales products or sales services, and segmenting the products or services from other competitions (Kolter, 1996). The brand could express six meanings to consumers, included characteristic, benefit, value, culture, personality, and user. The consumers could use these to evaluate what they wanted.
Park, Millberg and Lawson (1991) defined the brand is a conception which expresses its image, position, and provides an information type to consumers. The form included three parts, first of all is that the brand conception is a unique abstract meaning of brand. Second, the brand conception usually comes from the specific characteristics of product traits. Third, the brand conception usually forms from the corporation sedulously efforts and deliberately design image.
Park, Jaworsi and MacInnis (1986) defined the brand conception had three categories. First category was the functional oriented brand conception. It emphasized
the function could satisfy consumers’ external needs of consumption. Second category was the symbolic oriented brand conception. It emphasized the brand could satisfy consumers’ internal needs of consumption. Third category was the experiential oriented brand conception. It emphasize the brand could satisfy consumers’ internal needs of excitation and variety. Park, Millberg and Lawson (1991) further simplified the brand conception to two categories. Firs category was the same as past, the functional oriented brand conception. Second category was the prestige oriented brand conception. It emphasized the abstract need of prestige which liked the personal social status and fortune.
Ward and Lee (2000) examined whether consumers used brands as sources of information when shopping online. It indicated that when consumers used Internet to shop, the product brand was one of the most factor to decide buying or not. Degeratu, Rangaswamy, and Wu (2000) also supported that brand name was more valuable when information on fewer attributes was available online. Information asymmetries between buyers and sellers conducted the buyers uncertainly on their want to buy product. They must use product brand to reduce their risks. Therefore, this study’s results suggested that brand could facilitate consumers’ acceptance of electronic commerce.
2.3 Relation among Demographics, Internet Using Motivations, Consumer characteristic, and Online Shopping
First, this study discusses the relation between demographics and online shopping
and brings up the hypothesis H1-1~H1-4 in Section 2.3.1. Second, this study discusses
the relation between consumer characteristic and online shopping and brings up the
relation between Internet using motivations and online shopping and brings up the
hypothesis H3-1~H3-6. Finally, this study discusses the interaction between Internet
using motivations and consumer characteristic and brings up the hypothesis H4-1~H4-12
in Section 2.3.4.
2.3.1 Relation between Demographics and Online Shopping
Many studies showed many demographic variables were strong predictors of online shopping. Korgaonkar and Wolin (1999) found gender and age were significantly correlated to online shopping. Donthu and Garcia (1999) also found the significant difference between online shoppers and non-online shoppers. They found the two groups to differ significantly in terms of age, income. Therefore, this study proposed these hypotheses to test.
H1-1: Males are expected to be more likely to shop online than females.
H1-2: Younger people are expected to be more likely to purchasing intention.
H1-3: Purchasing intention will be positively related to education.
H1-4: Purchasing intention will be positively related to income.
2.3.2 Relationship between Consumer Characteristic and Online Shopping
Dodds, Monroe and Grewal (1991) proposed a conceptual model of the effect of price, brand name and store name on product evaluation. The result of this study indicated when the consumers’ perception of brand name and the perception of price were more favorite, the consumers’ perception of perceived quality and perceived value and purchasing intention would more positively enhance.
Consumers’ perception of brand of product may affect the online shopping. Donthu and Garcia (1999) were the first to bring up the hypothesis that brand of product was higher among online shopper that non-online shoppers, although the hypothesis was not statistically significant. But Balabanis and Reynolds (2001) also examined the influence of brand attitudes on the attitudes of online shoppers. They found the result was positively and significantly.
H2-1: Consumers’ price sensitivity will be positively related to purchasing intention.
H2-2: Consumers’ brand comparison inclination will be positively related to
purchasing intention.
2.3.3 Relationship between Internet Using Motivations and Online Shopping
Korgaonkar and Wolin (1999) found social escapism motivation, transaction-based security and privacy concerns, information motivation, interactive control motivation, socialization motivation, and economic motivation were correlated to online shopping. The social escapism motivation, information motivation, interactive control motivation, and socialization motivation were positively correlated to online shopping, only transaction-based security and privacy concerns was negatively correlated to online shopping. And Joines, Scherer, and Scheufele (2003) found the results support the relationship among transaction-based security and privacy concerns, information motivation, interactive control motivation, socialization motivation to online shopping, but the economic motivation was not significantly to online shopping.
H3-1: Purchasing intention will be positively related to social escapism motivation.
H3-2: Purchasing intention will be negatively related to transaction-based security and
H3-3: Purchasing intention will be positively related to information motivation.
H3-4: Purchasing intention will be positively related to control motivation.
H3-5: Purchasing intention will be positively related to socialization motivation.
H3-6: Purchasing intention will be positively related to economic motivation.
2.3.4 Interaction between Internet Using Motivations and Consumer characteristic
The study of the impact of the Internet and consumer motivations on evaluation of prices (Suri, Long, and Monroe, 2003) explored the interactions of information motivation and price on the effect of consumer’s perceived quality, sacrifice, and value. Due to the edification of the research, and because of the past literature almost explore the single research, this study will use the consumer characteristic to be a moderator variable between the Internet using motivations and online shopping. This study expects to find the interaction effect between these variables and to realize whether the difference of consumer characteristic affects the on-line shopping result or not.
H4-1: Purchasing intention will be positively related to the interactive effect of the
social escapism motivation and price sensitivity.
H4-2: Purchasing intention will be positively related to the interactive effect of the
transaction-based security and privacy concerns and price sensitivity.
H4-3: Purchasing intention will be positively related to the interactive effect of the
information motivation and price sensitivity.
H4-4: Purchasing intention will be positively related to the interactive effect of the
control motivation and price sensitivity.
H4-5: Purchasing intention will be positively related to the interactive effect of the
H4-6: Purchasing intention will be positively related to the interactive effect of the
economic motivation and price sensitivity.
H4-7: Purchasing intention will be positively related to the interactive effect of the
social escapism motivation and brand comparison inclination.
H4-8: Purchasing intention will be negatively related to the interactive effect of the
transaction-based security and privacy concerns and brand comparison inclination.
H4-9: Purchasing intention will be positively related to the interactive effect of the
information motivation and brand comparison inclination.
H4-10: Purchasing intention will be positively related to the interactive effect of the
control motivation and brand comparison inclination.
H4-11: Purchasing intention will be positively related to the interactive effect of the
socialization motivation and brand comparison inclination.
H4-12: Purchasing intention will be positively related to the interactive effect of the
economic motivation and brand comparison inclination.
Table 2.1 The Hypotheses in This Study.
Variables Hypotheses
H1-1: Males are expected to be more likely to shop online than
females.
H1-2: Younger people are expected to be more likely to purchasing
intention.
H1-3: Purchasing intention will be positively related to education.
Demographics
H1-4: Purchasing intention will be positively related to income.
H2-1: Consumers’ price sensitivity will be positively related to
purchasing intention. Consumer
Characteristic H2-2: Consumers’ brand comparison inclination will be positively
related to purchasing intention.
H3-1: Purchasing intention will be positively related to social escapism
H3-2: Purchasing intention will be negatively related to
transaction-based security and privacy concerns.
H3-3: Purchasing intention will be positively related to information
motivation.
H3-4: Purchasing intention will be positively related to control
motivation.
H3-5: Purchasing intention will be positively related to socialization
motivation. Internet
Using Motivations
H3-6: Purchasing intention will be positively related to economic
motivation.
Interaction between Consumer Characteristic and Internet Using Motivations
H4-1: Purchasing intention will be positively related to the interactive
effect of the social escapism motivation and price sensitivity.
H4-2: Purchasing intention will be positively related to the interactive
effect of the transaction-based security and privacy concerns and price sensitivity.
H4-3: Purchasing intention will be positively related to the interactive
effect of the information motivation and price sensitivity.
H4-4: Purchasing intention will be positively related to the interactive
effect of the control motivation and price sensitivity.
H4-5: Purchasing intention will be positively related to the interactive
effect of the socialization motivation and price sensitivity.
Price Sensitivity
* Motivations
H4-6: Purchasing intention will be positively related to the interactive
effect of the economic motivation and price sensitivity.
H4-7: Purchasing intention will be positively related to the interactive
effect of the social escapism motivation and brand comparison inclination.
H4-8: Purchasing intention will be negatively related to the interactive
effect of the transaction-based security and privacy concerns and brand comparison inclination.
H4-9: Purchasing intention will be positively related to the interactive
effect of the information motivation and brand comparison inclination. Brand Comparison Inclination * Motivations
H4-10: Purchasing intention will be positively related to the interactive
effect of the control motivation and brand comparison inclination.
H4-11: Purchasing intention will be positively related to the interactive
effect of the socialization motivation and brand comparison inclination.
H4-12: Purchasing intention will be positively related to the interactive
effect of the economic motivation and brand comparison inclination.
Figure 2. 1 Research Framework Consumer Characteristic 1. Price Sensitivity 2. Brand Comparison Inclination Korgaonkar and Wolin’s(1999) Internet Using Motivations 1. Social Escapism
Motivation
2. Transaction-based Security and Privacy Concerns 3. Information Motivation 4. Control Motivation 5. Socialization Motivation 6. Economic Motivation Online Shopping Purchasing Intention Demographics 1. Gender 2. Age 3. Educational Level 4. Income H1-1~H1-4 H2-1~H2-2 H3-1~H3-6 H4-1~H4-12
CHAPTER 3 Methodology
This chapter consists of four sections. The first section introduces the subjects of research and sampling method in Section 3.1. The second section is about how to design the questionnaire in Section 3.2. The third section is the operational definition and explains which item is measured which variable. In Section 3.4, it’s about analytic methods which include descriptive statistics, reliability and validity analysis, Pearson’s product-moment correlation analysis, and stepwise regression analysis.
3.1 The Subjects of Research and Sampling Method
In this section, this study introduces how to survey the subjects of research and sampling method. Fist, this study explains why the survey used the network questionnaire in section 3.1.1. Then, using the statistic formula (1) calculates the sample size which could stands for the population of Internet users in Section 3.1.2. Finally, this study introduces the sampling method in Section 3.1.3.
3.1.1 Subjects of Research
This study wants to explore the motivations for consumer Web use and the perception of consumer characteristic of consumer. The influence of the two factors affects online shopping behavior. Therefore, the subjects of research must be focus on the groups of Internet users or the people who ever used. For this reason, this study will use the online questionnaire to survey. The online questionnaire can ensure that the samples must be the Internet users or ever used.
the questionnaire retrieve fast and save cost, not limited by time and space, questionnaire design is elastic, protect the consumer privacy, not interfered with visitor, and decrease the key in data to construct database (Strauss, El-Ansary and Frost, 2003). But the online questionnaire sampling is one kind of the convenience samplings. It also has some disadvantages. The most serious problem is the representative sample. Because of the convenience sampling is non-probability sampling. We can’t promise these samples can represent the population (Kerlinger, and Lee, 2002).
3.1.2 Sample Size
The sample size this study used the formula (1) to calculate. The n is the sample
size that this study want to survey; α is the confidence lever, this study assume
α =5%. p is the proportion of the sample size and population . Because we want to ^
estimate the sample size, this study assume the p =1/2. E is the maximum error. This ^
study assumes E is the 0.05. According to the formula, this study expect to survey 385 samples. 2 ^ ^ 2 2 /
*
(
1
)
Ε
−
=
z
p
p
n
α (1);384
.
16
)
05
.
0
(
2
/
1
*
2
/
1
*
)
96
.
1
(
2 2=
=
n
3.1.3 Sampling Method
According to the above-mentioned, this study uses the network questionnaire to survey. The questionnaire will be sited on Website that IP address is
http://140.113.59.167:8080/index.htm. This study uses the Bulletin Broad System and E-mail to publicize the Website. The questionnaire was hosted for three weeks from 14th February to 9th March 2005.
3.2 Questionnaire Design
The first form of questionnaire was to stand on the scale of the literature review and to adjust appropriately. The pretest of questionnaire of samples size was forty subjects. According to the subjects’ suggestions of pretest, this study adjusted the wording of items in order to clearly express the context of the questionnaire. And in order to ensure the content validity of the questionnaire, the pretest used the factor analysis to examine the construct validity of the questionnaire, and the reliability analysis to examine the reliability of the questionnaire.
According to the result of the factor analysis of pretest, this study found the interactive control motivation and the socialization motivation will make the subjects confused, the items of interactive are similar to the items of socialization to subjects. In order to improve the problem, this study adjusted the interactive control motivation variable to control motivation variable.
The survey questionnaire was divided into four sections (Appendix 1). There were 9 questions in the first part which is concerning consumer online shopping behavior and experience. There were 8 questions in the second part which is concerning consumer characteristic. There were 30 questions in the third part which is
the reason of consumer to use Internet. Finally, the fourth part was devoted to basic demographic information that would be used for classification purposes.
3.3 The Operational Definition and Measure of Variables
In this section, this study defines all the variables and explains which items in the questionnaire are be used to measure the variables. The variables could be discriminated between independent variables and dependent variables. The independent variables include consumer characteristic, Internet using motivations, and demographic variables. This study will detail theses independent variables in Section 3.3.1, 3.3.2, 3.3.3. The online shopping behaviors include purchasing intention, repurchasing intention, buying experience, amount of money and buying items. This study mainly discusses the variable of purchasing intention in Section 3.3.4.
3.3.1 Consumer Characteristic
To measure the price sensitivity and brand comparison inclination of consumer characteristic are related to consumers online shopping or not. The questionnaire design refers to scale of the study of typology of online shoppers (Kau, Tang, Ghosh, 2003). 5 items about brand comparison inclination and 3 items about price sensitivity are created to measure. The 8 items are put on the second part in the questionnaire. The scale used to measure these items was Likert-based with 1 signifying “Strongly disagree” and 5 denoting “Strongly agree”.
Table 3.1 Items for Consumer Characteristic.
Consumer Characteristic Items
Price Sensitivity 6, 7, 8
Brand Comparison Inclination 1, 2, 3, 4, 5
3.3.2 Internet Using Motivations
According to scale of the study of a multivariate analysis of web usage (Korgaonkar & Wolin, 1999), this study modified some items after pretes. The six motivations are social escapism motivation, transaction-based security and privacy concerns, information motivation, control motivation, socialization motivation, economic motivation. There are 30 items on the third part in the questionnaire, 5 items to measure each Internet using motivations, such as items 2, 10, 12, 18, 24 is supposed to measure the social escapism motivation. The scale used to measure these items was Likert-based with 1 signifying “Strongly disagree” and 5 denoting “Strongly agree”. The following table can clearly express the items of motivations.
Table 3.2 Items for each Internet Using Motivation.
Internet Using Motivations Items
Social Escapism Motivation 2, 10, 12, 18, 24
Transaction-based Security and Privacy Concerns 1, 9, 17, 25, 27
Information Motivation 4, 6, 15, 19, 23
Control Motivation 3, 14, 20, 28, 30
Socialization Motivation 5, 8, 22, 26, 29
3.3.3 Demographic
The variable of demographic includes gender, age, educational level, income which includes average income per month and average disposable income per month. There are 8 items about consumers’ personal base information on the final part in the questionnaire.
3.3.4 Online Shopping Behavior
There are 9 items about consumers’ online shopping behavior and experience on the first part in the questionnaire. The variable of online shopping behavior includes purchasing intention, repurchasing intention, buying experience, amount of money, and buying items. The scale of online purchasing intention and repurchasing intention refer to the study of purchasing intention in a traditional retail environment (William, Kent, and Dhruv, 1991). The scale used to measure these items was Likert-based with 1 signifying “Strongly disagree” and 5 denoting “Strongly agree”. The higher score means the consumers’ online purchasing intentions are higher.
Table 3.3 Items for Online Shopping Behavior.
Shopping Behavior Items
Purchasing Intention 3, 4
Repurchasing Intention 5, 6
Buying Experience 7
Amount of Money 8
3.4 Analytic Methods
This study used the statistic software SPSS 11.5 version to analyze the data which are collected from Internet questionnaire. The statistic method includes descriptive statistics, reliability and validity analysis, Pearson’s product-moment correlation analysis, and stepwise regression analysis.
3.4.1 Descriptive Statistics
In order to know the structure of consumers’ Internet using experience, online shopping behavior and, demographic which includes gender, age, educational level, income, this study used the descriptive statistics to describe their amounts, percentages, means and variances.
3.4.2 Reliability and Validity Analysis
In order to test the reliability and validity of items of each variable, this study used the factor analysis to decide the items of each variable. The validity analysis used the factor analysis to test the priori structure of variables, reduced the items which of the results were not good. And then the reliability analysis used the
Cronbach’s α coefficient to test the internal consistence of items, deleted the bad
3.4.3 ANOVA and LSD of Multiple Comparisons
This study used the analysis of variance (ANOVA) and Fisher’s least significant difference (LSD) of multiple comparisons to explore the demographic variables which were gender, age, educational level, occupation, and personal disposable income affect the difference of means among independent variables which were Internet using motivations and consumer characteristic.
3.4.4 Pearson’s Product-moment Correlation Analysis
This study used the Pearson’s product-moment correlation analysis to realize the relations among variables. According to the correlation coefficient of correlation matrix, it could clearly indicate the positive and negative linear relation between the two continues variables. And whether the two continues variables were significantly correlation or not.
3.4.5 Stepwise Regression Analysis
In order to ensure the accuracy and reliability of regression analysis, this study first examined the collinearity among independent variables. And according to the premise of regression analysis, the residual must be normal distribution. Therefore, this study did the residual analysis to examine the residual were normal distribution or not.
After the residual analysis, this study used stepwise regression analysis to select explainable independent variables from demographics variables, Internet using motivations, and consumer characteristic. In order to test the interaction effect of the Internet using motivations and the consumer characteristic, the model added the
interaction terms. Each interaction term stand for one interaction effect variable. The full regression model is shown as follows:
i i i i i i i i i i i i i i i i i i i i i i i i i i i i i i i i i i i i i i
xEoc
B
xSoc
B
xCtrl
B
xInf
B
xTP
B
xSE
B
xEoc
P
xSoc
P
xCtrl
P
xInf
P
xTP
P
xSE
P
Eoc
Soc
Ctrl
Inf
TP
SE
B
P
DInc
Edu
Age
Gen
Y
ε
β
β
β
β
β
β
β
β
β
β
β
β
β
β
β
β
β
β
β
β
β
β
β
β
α
+
+
+
+
+
+
+
+
+
+
+
+
+
+
+
+
+
+
+
+
+
+
+
+
+
=
)
(
)
(
)
(
)
(
)
(
)
(
)
(
)
(
)
(
)
(
)
(
)
(
24 23 22 21 20 19 18 17 16 15 14 13 12 11 10 9 8 7 6 5 4 3 2 1 ) , 0 ( 2~
σ ε N iid i ,i
=
1
,
...,
n
;
n
=
432
(2) i Y = purchasing intention; iGen = gender; Age = age; i Edu = education level; i
i
DInc = average disposable income every month;
i
P = price sensitivity; B = brand comparison inclination; i
i
SE = social escapism motivation; Inf = information motivation; i
i
TP = transaction-based security and privacy concerns;
i
Ctr = control motivation; Soc = socialization motivation; i
i
CHAPTER 4 Data Analysis
This chapter mainly explains and analyzes the data which acquired from Internet questionnaire and step by step analyzes the data by chapter 3.5 analysis methods. First, proceeding to the samples’ descriptive statistic can let us realize the samples’ characteristic. Then, this study proceeds to the variables’ reliability and validity analysis. Finally, using the regression analysis tests the hypotheses.
4.1 The Structure of Samples
During the 14th February to 9th March 2005, the questionnaire was sited on
Website that IP address was http://140.113.59.167:8080/index.htm. The retrieved
sample size is 458, deducts the repeat samples whose e-mail address are the same. The valid samples are 431. According to statistic formula (1) in Chapter 3, this study expects to collect sample 385, actually this study collected the samples 431. Therefore, the sample size 431 achieves collected goal of this study and can proceed to the next further analysis.
This study uses the retrieved samples to do the frequencies of descriptive statistics. It indicates the Internet users’ experiences are most in 5~7 years and the average using are about 5.719 years. And the average time per day that the Internet users spend to surf online is about 2.364 hours (Table 4.1). It’s a very high number to a person to spend more two hours a day surfing online. It means surfing online is a routine to people every day.
According to the Taiwanese Internet using survey of yam Website which valid questionnaires in 2004 were 13,040, the ratio that the Internet users had shopping experience in past six months was 66% in 2004, 64% in 2003, and 57% in 2002. The
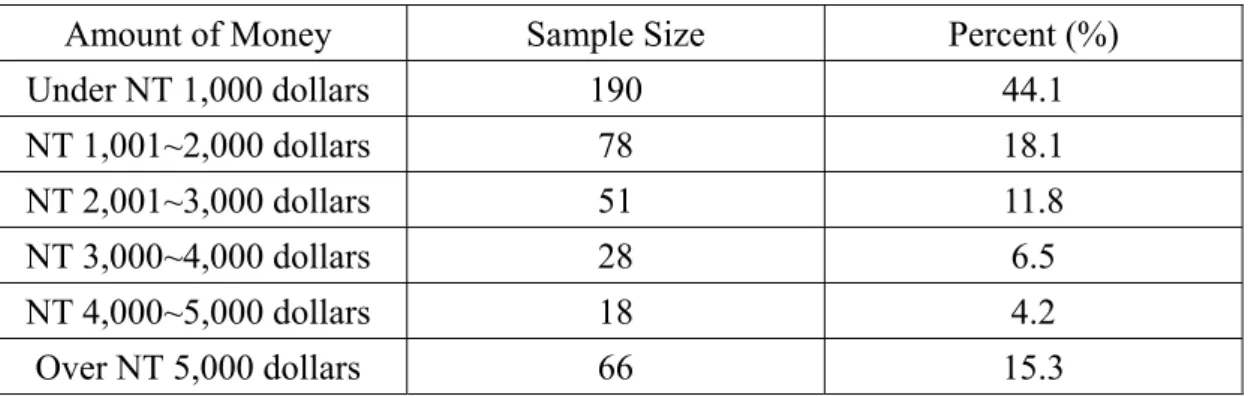
statistic data represents the Internet users shopping online were gradually increasing. Therefore, the result of this study is reasonable. The ratio that the Internet users had shopping experiences in past six months was 76.6%. The over six times shopping experiences of the Internet users were 20.4% (Table 4.2). In this study, the Internet users’ buying amount of money mainly centralizes under NT 1,000 dollars. The ratio is 44.1% (Table 4.3). This study expects the reason of this result is because of the retrieved samples are almost students whose ratio is 69.4%.
Table 4.1 The Distribution of the Internet Users’ Experience & Time.
Items Sample Size Percent (%)
Under 1 year 6 1.4 1~3 years 33 7.7 3~5 years 116 26.9 5~7 years 138 32 Over 7 years 138 32 Using Internet Experience
Average Years About 5.719 years
under 30 minutes 17 3.9
30~60 minutes 78 18.1
1~2 hours 113 26.2
2~3 hours 69 16.0
over 3 hours 154 35.7
Using Time Per Day
Average Hours About 2.364 hours
Table 4.2 The Distribution of the Internet Users’ Shopping Experience.
Shopping Experience Sample Size Percent (%)
0 time 101 23.4
1 time 71 16.5
2~3 times 109 25.3
4~5 times 62 14.4
Table 4.3 The Distribution of the Internet Users’ Buying Amount of Money.
Amount of Money Sample Size Percent (%)
Under NT 1,000 dollars 190 44.1 NT 1,001~2,000 dollars 78 18.1 NT 2,001~3,000 dollars 51 11.8 NT 3,000~4,000 dollars 28 6.5 NT 4,000~5,000 dollars 18 4.2 Over NT 5,000 dollars 66 15.3
About the Internet users’ purchasing intention, this study uses two items to measure the purchasing intention variable. So that the average scores of variables will occur point five. According to Table 4.4, the distribution of the Internet users’ purchasing intention is right skewed. It means the most users have higher intentions to shopping online.
Table 4.4 The Distribution of the Internet Users’ Purchasing Intention.
Items Sample Size Percent (%)
Strongly Disagree (1.0) 14 3.2 (1.5) 6 1.4 Disagree (2.0) 50 11.6 (2.5) 25 5.8 No Opinion (3.0) 134 31.1 (3.5) 43 10.0 Agree (4.0) 102 23.7 (4.5) 19 4.4 Purchasing Intention (Scores) Strongly Agree (5.0) 38 8.8
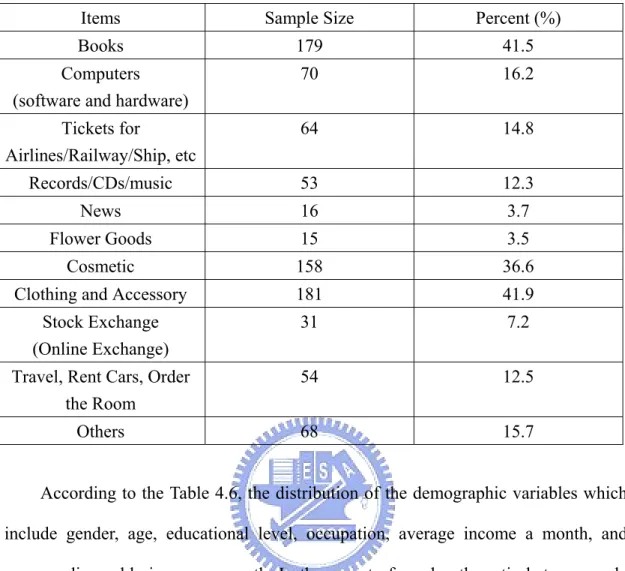
About the Internet users buying items, the highest three items are clothing and accessory (41.9%), books (41.5%), and cosmetic (36.6%). This study expects the reason of result, the users mainly prefer buying clothing and accessory, books and cosmetic, is because of the retrieved samples are almost females whose ratio is 62.9%.
Table 4.5 The Distribution of the Internet Users’ Buying Items. (Multiple Choices)
Items Sample Size Percent (%)
Books 179 41.5 Computers
(software and hardware)
70 16.2 Tickets for Airlines/Railway/Ship, etc 64 14.8 Records/CDs/music 53 12.3 News 16 3.7 Flower Goods 15 3.5 Cosmetic 158 36.6
Clothing and Accessory 181 41.9
Stock Exchange (Online Exchange)
31 7.2 Travel, Rent Cars, Order
the Room
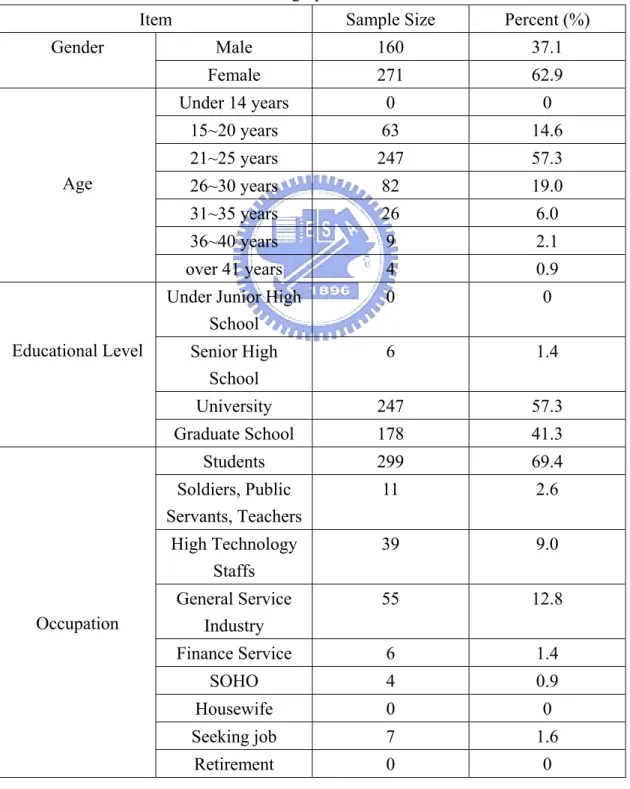
54 12.5 Others 68 15.7 According to the Table 4.6, the distribution of the demographic variables which
include gender, age, educational level, occupation, average income a month, and average disposable income a month. In the aspect of gender, the ratio between male and female is nearly 1:2 (37.1%:62.9%). According to the Taiwanese Internet using survey of yam Website which valid questionnaires in 2004 were 13,040, the ratio between male and female were 49.6%: 50.4% in 2002, 47%:53% in 2003, 41%:59% in 2004. The ratio of male is gradually decreasing, and the ratio of female is gradually increasing. Therefore, the ratio between male and female of this study was reasonable and nearly realistic world.
In the aspect of age, the highest three were the 21~25 years (57.3%), the 26~30years (19%), and the 15~20 years (14.6%). In the aspect of educational level, the Internet users almost had high educational level. The ratio of educational lever over university was 98.6%. In the aspect of occupation, the subjects were mainly
students whose ratio was 69.4%. Because of this reason, the average income a month focused on under NT 15,000, and had 123 subjects had zero income. In the aspect of disposable income, the subjects focused on NT 5,000~10,000 (45.5%). Because of the disposable income would stand for personal consuming ability than average income.
Therefore, this study will use the disposable income to analyze and test the H1-3.
Table 4.6 The Distribution of the Demographic Variables.
Item Sample Size Percent (%)
Male 160 37.1 Gender Female 271 62.9 Under 14 years 0 0 15~20 years 63 14.6 21~25 years 247 57.3 26~30 years 82 19.0 31~35 years 26 6.0 36~40 years 9 2.1 Age over 41 years 4 0.9
Under Junior High School 0 0 Senior High School 6 1.4 University 247 57.3 Educational Level Graduate School 178 41.3 Students 299 69.4 Soldiers, Public Servants, Teachers 11 2.6 High Technology Staffs 39 9.0 General Service Industry 55 12.8 Finance Service 6 1.4 SOHO 4 0.9 Housewife 0 0 Seeking job 7 1.6 Occupation Retirement 0 0
Others 10 2.3 Zero 123 28.5 Under NT 15,000 176 40.8 NT 15,001~30,000 49 11.4 NT 30,001~45,000 48 11.1 NT 45,001~60,000 19 4.4 NT 60,001~75,000 7 1.6 NT 75,001~90,000 6 1.4 Average Income Per Month Over NT90,001 3 0.7 Under NT 5,000 87 20.2 NT 5,001~10,000 196 45.5 NT 10,001~20,00 92 21.3 NT 20,001~30,000 29 6.7 NT 30,001~40,000 15 3.5 NT 4,001~50,000 4 0.9 NT 50,001~60,000 5 1.2 NT 60,001~70,000 1 0.2 Average Disposable Income Per Month Over NT70,001 2 0.5
4.2 The Reliability and Validity of Independent Variables
In order to reduce the items of independent variables and examining the variable internal consistency of each factor, this study proceeds to reliability and validity analysis about the Internet using motivations and the consumer characteristic. In the validity analysis, this study uses the principal component analysis of factor analysis to extract the common factor. According to the rule of extraction, this study extracts the factors which eigenvalues over 1 and then the proceeds to varimax rotation. After the varimax rotation, the factor loading of modulus of items must be over 0.5, else deletes the items which factor loading are under 0.5. Finally, according to the meaning of items of each factor proceeds to give each factor a name.
After the validity analysis, this study uses the reliability analysis to measure the
value over 0.7 will be better (De Vellis, 1991). In fact, the
α
critical point doesn’tlimit its value. Gronlund (1985) indicated the Cronbach’s
α
of most scale which theresearcher made was between 0.6~0.85. Therefore, this study chose the Cronbach’s
α
was 0.6 as a critical point. In next Section, this study will explain the results of the validity and reliability about the consumers’ Internet using motivations and consumer characteristic.
4.2.1 The Reliability and Validity of Internet Using Motivations
There are thirty items about Internet using motivations. After reliability and validity analysis, the items reduce to twenty-four items. The reduced items were items 3, 7, 11, 14, 20, 24 which factor loading after rotation were under 0.5.
Compared with the Table 3.2 that this study constructed items for each motivation, some items for each motivation strayed from original constructed motivations. The item 5 was originally belonged to social motivation, but it was belonged to information motivation after factor analysis. This study explains because of Internet users surf online in order to get some information which they wanted, so that they thought surfing on Internet has become one part of their life. The item 29 was originally belonged to social motivation, but after factor analysis it was belonged to control motivation. This study explains Internet users could control they want to talk information of the webs to friends or not. The items 25 and 27 were originally belonged to transaction-based security and privacy concerns, but after factor analysis it was belong to control motivation. The item 25 meant filling out personal information on Website was not security; therefore, Internet users could control themselves to decide they wanted to fill out personal information on Website or not. The similar reason of item 27 were Internet users could control themselves to measure
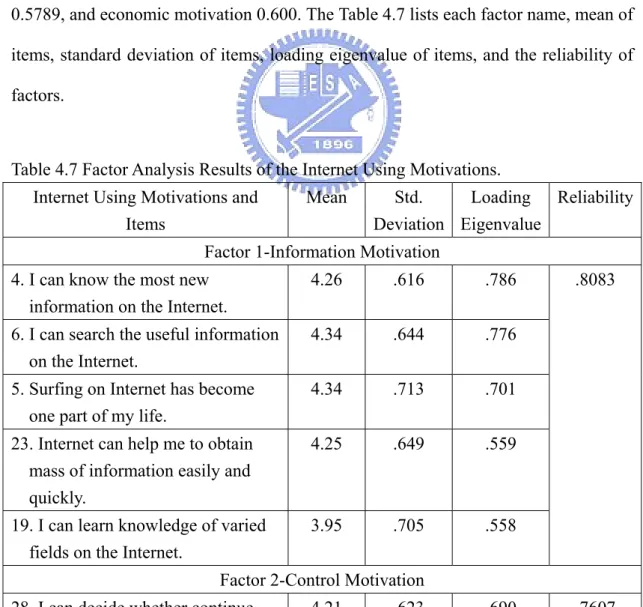
the goodwill of online shop and further decided to buy online or not. The item 15 was originally belonged to information motivation, but after factor analysis it was belonged to economic motivation. The item 15 meant Internet users could get some cheap or free information. It had two meanings to subjects, one was information motivation, and the other was economic motivation because of free. Therefore, the item 15 was reasonably belonged to economic motivation in this study.
In the aspect of reliability of items, the Cronbach’s
α
of total Internet usingmotivations is 0.8364. The Cronbach’s
α
of each factor separately is informationmotivation 0.8083, control motivation 0.7607, social motivation 0.7242, transaction-based security and privacy concerns 0.6199, socialization motivation 0.5789, and economic motivation 0.600. The Table 4.7 lists each factor name, mean of items, standard deviation of items, loading eigenvalue of items, and the reliability of factors.
Table 4.7 Factor Analysis Results of the Internet Using Motivations. Internet Using Motivations and
Items Mean Std. Deviation Loading Eigenvalue Reliability Factor 1-Information Motivation
4. I can know the most new information on the Internet.
4.26 .616 .786 6. I can search the useful information
on the Internet.
4.34 .644 .776 5. Surfing on Internet has become
one part of my life.
4.34 .713 .701 23. Internet can help me to obtain
mass of information easily and quickly.
4.25 .649 .559
19. I can learn knowledge of varied fields on the Internet.
3.95 .705 .558
.8083
Factor 2-Control Motivation
surfing the Website.
29. I often talk the information of the webs to friends.
4.16 .665 .682 27. The goodwill of the online shop
is a major concern for me when buying online.
4.28 .637 .679
30. I can decide when to surf on Internet and what to view.
4.21 .730 .626 25. I think when I fill out my
personal information online, it would possible be disclosed.
4.22 .764 .554
Factor 3-Social Escapism Motivation 10. Surfing on Internet can let me
skip the trouble, temporarily not think the trouble.
3.22 .868 .764
2. Surfing on Internet can let me forget the reality.
2.60 .964 .741 18. Surfing on Internet can let me
not feel lonely.
3.20 .895 .660 12. Surfing on Internet can let me
feel good, relax my mood.
3.63 .735 .638
.7242
Factor 4-Transaction-based Security and Privacy Concerns 1. Buying online lacks the feel of
security.
3.52 .893 .790 9. I can’t expect the product
completeness when buying online.
3.95 .762 .732 17. I think using the credit card to
deal online is lack of security.
3.82 .921 .638
.6199
Factor 5-Socialization Motivation 22. I can use the Internet to contact
with my family or friends.
4.11 .787 .743 26. I will date friends to surf on
Internet.
3.75 .846 .603 8. I can expand my interpersonal
relationship online.
3.14 .908 .593
.5789
Factor 6-Economic Motivation 21. I can use the Internet to deal in
stock, and save the procedure fee
16. I can use Internet to compare the product of price difference, and to find the cheapest price.
3.97 .699 .572
13. Shopping on Internet can save time and feel convenient.
3.50 .834 .527 15. Internet can help me to obtain
some cheap or free information.
4.04 .710 .526
4.2.2 The Reliability and Validity of Consumer Characteristic
There are eight items about consumers’ perceptions of consumer characteristic. After reliability and validity analysis, the items reduce to seven items. The reduced item was item 3 which factor loading after rotation was under 0.5. Compared with the Table 3.1 that this study constructed items for consumer characteristic which are price sensitivity and brand comparison inclination, the difference was the item 3 reduced and no other items shifted.
In the aspect of reliability of items, the Cronbach’s
α
of consumercharacteristic is 0.7638. The Cronbach’s
α
of price sensitivity is 0.809, and brandcomparison inclination is 0.6784. This study proceeds the reliability analysis find that
if item 3 deleted, the Cronbach’s
α
will increase from 0.6574 to 0.6784. Thisfinding supported the method of validity analysis. Item must be deleted, if factor loading after rotation was under 0.5. The Table 4.8 lists each factor name, mean of items, standard deviation of items, loading eigenvalue of items, and the reliability of factors.
Table 4.8 Factor Analysis Results of the Consumer Characteristic.
Consumer Characteristic and Items Mean Std.
Deviation
Loading Eigenvalue
Reliability Price Sensivity
8. When considering purchasing online, I do more brand price comparisons than in a traditional retail environment.
4.05 .848 .875
6. When considering purchase online, I am more price sensitive compared to that in a traditional retail environment.
4.05 .805 .815
7. When considering purchasing online, I react more to sales promotions compared to that in a traditional retail environment.
3.84 .868 .806 .809
Brand Comparison Inclination 2. When considering purchase
online, I tend to tradeoff the strengths and weaknesses of brand before deciding how attractive the brand is.
3.99 .646 .795
1. When considering purchase online, I actively evaluate a large number of brands then when I shop in a traditional retail environment.
3.86 .785 .696
4. When considering purchase online, I do an overall comparison of different brands before I decide which brand is my most preferred.
3.78 .805 .684
5. When considering purchase online, I prefer to buy well-known brands.
3.76 .916 .545
4.3 The ANOVA and Multiple Comparisons of Independent Variables and Demographic Variables
This section uses the analysis of variance (ANOVA) and Fisher’s least significant difference (LSD) of multiple comparison method to explore the demographic variables which are gender, age, educational level, occupation, and personal disposable income affect the difference of means among independent variables which are Internet using motivations and consumer characteristic. First according to the previous the result of reliability and validity analysis, this study uses the weighted averages method to measure each score of factors. Then each mean is the base unit to compare in ANOVA.
4.3.1 The ANOVA of Gender Variable
Table 4.9 explains the differences of gender affects the differences of means among Internet using motivations and the consumer characteristic. Because of the gender variable is a dummy variable which is just two categories. It can’t use the multiple comparison method to compare. It just needs to use the ANOVA and can finds the significant or not. Therefore, in Table 4.9 there are no columns about multiple comparisons.
According to Table 4.9, this study finds that there is a significant difference in control motivation between male and female. The female has higher control motivation than male. But in economic motivation, the male has higher motivation than female.
Table 4.9 The ANOVA of the Gender Variable. Gender Variables Factor Name 1 µ Male (n=160) 2 µ Female (n=271) F Value P Value Social Escapism 3.151 3.170 0.090 0.764 Transaction Security 3.692 3.808 3.274 0.071 Information 4.200 4.246 0.869 0.352 Control 4.122 4.272 9.618 0.002** Socialize 3.708 3.646 1.004 0.317 Internet Using Motivations Economic 3.804 3.705 3.633 0.057+ Price Sensitivity 3.913 4.020 2.251 0.134 Consumer
Characteristic Brand Comparison 3.856 3.847 0.025 0.876
Note: + express p value < 0.1; * express p value < 0.05; ** express p value < 0.01; *** express p value <0.001
4.3.2 The ANOVA of the Age Variable
Table 4.10 explains the differences of age affects the differences of means among Internet using motivations and consumer characteristic. There are 7 segments of consumers’ age in the Internet questionnaire. But because of the subjects of age under 14 years, 31~35 years, 36~40 years, and over 40 years are too few, this study combines the subjects of under 14 years and 15~20 years to be a new segment which is under 20 years and combines the subjects of 31~35 years, 36~40 years, and over 40 years to be a new segment which is over 30 years. Therefore, this study uses the 4 segments to proceed to analyze.
According to Table 4.10, this study finds some interesting findings. There are significant differences in consumers’ social escapism motivation, socialize motivation,
means µ1,µ2,µ3 are significantly higher than µ4 . But the µ1,µ2,µ3 are not significantly higher than each other. Therefore this study finds the consumers are under 30 years, their social escapism motivations and socialize motivations are higher.
The same analysis method of multiple compassion the formulaµ3>µ1,µ2,µ4
means thatµ3 is significantly higher than µ1,µ2,µ4 . Therefore the consumers
between 26~30 years have the highest economic motivation than other segments.
Table 4.10 The ANOVA of the Age Variable.
Age Variables Factor Name 1 µ Under 20 years (n=63) 2 µ 21~25 years (n=247) 3 µ 26~30 years (n=82) 4 µ Over 30 years (n=40) F Value P Value Multiple Comparison LSD Social Escapism 3.226 3.209 3.143 2.819 4.625 0.003** 4 3 2 1,µ ,µ µ µ > Transaction Security 3.698 3.789 3.683 3.883 1.219 0.302 Information 4.238 4.233 4.229 4.190 0.093 0.964 Control 4.152 4.248 4.220 4.110 1.326 0.265 Socialize 3.741 3.721 3.671 3.233 7.658 0.000*** 4 3 2 1,µ ,µ µ µ > Internet Using Motivations Economic 3.675 3.711 3.851 3.819 2.101 0.099+ 4 2 1 3 µ ,µ ,µ µ > Price Sensitivity 4.026 3.962 4.053 3.867 0.756 0.519 Consumer Characteristic Brand Comparison 3.806 3.841 3.724 3.825 0.655 0.580