新車車主重複購買汽車保險行為之研究
102
0
0
全文
(2) 新車車主重複購買汽車保險行為之研究. Modeling Repeated Choice Behaviors of Automobile Insurance Policies for New Car Owners 研 究 生:王明智. Student:Ming-Jyh Wang. 指導教授:藍武王. Advisors:Dr. Lawrence W. Lan. 溫傑華. Dr. Chieh-Hua Wen 國 立 交 通 大 學 交 通 運 輸 研 究 所 博 士 論 文. A Dissertation Submitted to Institute of Traffic and Transportation College of Management National Chiao Tung University in Partial Fulfillment of the Requirements for the Degree of Doctor of Philosophy in Management. January 2008 Taipei, Taiwan, Republic of China. 中 華 民 國 九 十 七 年 一 月.
(3) 新車車主重複購買汽車保險行為之研究. 學生:王明智. 指導教授:藍武王博士 溫傑華博士. 國立交通大學 交通運輸研究所 摘. 要. 汽車所有人購買汽車保險常是為了轉移因發生交通事故而造成體傷或財損 的風險。在大部分國家,車體損失保險是最昂貴的保單,也是產險公司主要收入 來源。無論如何,新車車主傾向於在前幾年購買車體損失險,但為減少保費負擔, 經常在往後幾年減少保障範圍或不再購買車體險,而導致產險公司的保費收入明 顯減少。本研究之動機是希望建立模式架構以深入了解消費者選擇汽車保險之行 為。 本研究的模式架構分為兩大部分:第一部分為車體損失險保單的選擇;第二 部分為非車體保單(例如第三人責任險及其他附加險)的選擇。本研究的重點放 在第一部分,探討投保人每年持續選擇車體險種的問題。研究方法採用離散選擇 模式,替選方案包含車體險種及持續投保相同險種的年數。離散選擇模式考慮多 項羅吉特模式(multinomial logit model)、巢式羅吉特模式(nested logit model)、及 成對組合模式(paired combinatorial logit model)。 本研究收集台灣某家產險公司被保險人數年的資料,驗證所建立的模式架 構。研究結果顯示,重複購買汽車車體損失險保單之行為受年齡、汽車為國產/ 進口及汽車汽缸量大小所影響。巢式羅吉特模式不僅在概念上或透過統計檢定, 皆比多項羅吉特模式適用於分析消費者重複選擇行為。本研究亦發現,雖然成對 組合羅吉特模式比多項羅吉特模式與巢式羅吉特模式更具有彈性,但此模式在方 案數很多的情況時,校估相當困難,且不易得出理想的結果。本模式架構之發展 有助於了解投保人重複選擇汽車保險之行為,且校估結果可提供保險公司修訂現 有的汽車保單或研擬新的行銷策略,以吸引消費者重複購買車體損失險保單。 關鍵詞:汽車保險保單、離散選擇模式、重複選擇行為、成對組合羅吉特 i.
(4) Modeling Repeated Choice Behaviors of Automobile Insurance Policies for New Car Owners Student: Ming-Jyh Wang. Advisors: Dr. Lawrence W. Lan Dr. Chieh-Hua Wen. Institute of Traffic and Transportation National Chiao Tung University ABSTRACT Car owners purchase appropriate automobile insurance policies (AIP) to provide coverage for property damages and personal injuries incurred by traffic accidents. Physical damage coverage, the most expensive policy, is the major source of revenues for non-life insurance companies in most countries today. However, new car owners are likely to purchase physical damage coverage in the first few years and then downgrade their insurance by either purchasing reduced physical damage coverage or not even buying any physical damage coverage in the subsequent years. As such, premium revenues for non-life insurance companies will be substantially reduced. The study is motivated by the importance of developing a modeling framework to gain insights into the insured’s choice for AIP. The research develops a model system that consists of two components: the first component is the decision to select different types of physical damage coverage; the second component is the choice of non-physical damage coverage involving third party liability as a basic protection with additional coverage. This study focuses on the first component and, particularly, explores repeated choices of different types of physical damage coverage. A discrete choice modeling framework including the choice of physical damage coverage type and the number of consecutive years that the insured has purchased the same type of coverage is further developed. Various discrete choice models including multinomial logit, nested logit, and paired combinatorial logit are attempted. The proposed modeling framework is empirically tested using a panel data provided by a non-life insurance company in Taiwan. The results indicate that the repeated choices of physical damage coverage AIP are influenced by age of the driver, vehicle make, and engine capacity. The nested logit model statistically rejected the multinomial logit model, which demonstrates the statistical and structural superiority of the nested logit model in analyzing the insured’s repeated choices. Although the paired combinatorial logit model is more flexible than the multinomial logit or nested logit model, it is found that estimation of such model becomes very difficult when the number of alternatives gets large. The model framework developed in the study has improved our understanding of the repeated choices of AIP, and the estimation results have provided valuable implications for the insurer to modify existing automobile insurance policies or to develop marketing strategies so as to enhance the insured intension to repurchase the physical damage coverage AIP.. Keywords: Automobile insurance policies, Discrete choice model, Repeated choice behaviors, Paired combinatorial logit model ii.
(5) 誌. 謝. 本論文得以順利完成,最要感謝的是恩師藍教授武王的悉心指導,舉凡從研 究方向的指引,研究架構的建立,研究方法的啟迪,到投稿文章字字句句的再三 斟酌,均使我獲益良多。尤其跨領域的博士班課程與之前大不相同,課業上的壓 力與學習上的困頓皆因有藍教授武王的開導與協助,讓學生有了越挫越勇的信心 與毅力,並且不厭其煩的糾正過去研究上的錯誤觀念與用法,讓學生有重生的深 刻感受。陪伴學生一路走來,對學生的好與無盡的付出,即使公務繁忙卻仍為學 生工作至深夜不辭辛勞,感動與感激之情無以言喻,令學生銘感五內、永生難忘, 其為師之道為學生表率。其認真嚴謹的學者風範、為學精神與處世態度,實為學 生日後治學求知與待人接物的典範。 在研究方法上因有溫教授傑華的指導讓學生得以更深入了解該方法的奧 義,亦因老師謹慎再謹慎的態度,雖然時間上需時較長,卻也因此碰觸自己長久 以來急性子又粗枝大葉的毛病,勇於面對自己的缺點藉以磨練自己的個性,是為 另一個收獲與試煉。兩位恩師的諄諄教誨,學生永感銘心,在此謹向兩位恩師致 上最高之敬意與謝忱。 在論文計畫書審查期間,承蒙馮教授正民、許教授鉅秉不吝指正,提供諸多 寶貴意見及建議。此外,學位口試時,周教授義華、張教授新立、陳教授敦基及 宋教授明哲等的懇切指正與中肯評論,使本論文更臻充實與完備,在此由衷地對 其表達誠摯的謝意。求學期間,承蒙丁教授承、黃教授承傳、徐教授淵靜、汪教 授進財、黃教授台生、陳教授穆臻及邱教授裕鈞等諸多學識淵博的老師授業解 惑,豐富我的學識與知識,在此亦對師長們表達深切之謝忱。同時感謝進入博士 班前張教授新立的啟蒙與教導方萌生跨領域的勇氣而與交大結緣。曾教授國雄擴 展研究方法新視野,杰炤學長及豐裕學長於入學準備及求學期間特別照顧與關 懷,易詩學弟的諸多協助,在在感激於心。 此外,有所辦洪小姐、柳小姐、何小姐及圖書館陳小姐的各項協助,學長鄭 董、成蔚、新薰、士展、村基、至宏、政棋、在莒、學姐劍雲、瓊文、同學曾董、 銘德、Percy、輝煌,學弟益三、世昌、彥蘅、志誠、永祥、群明、文斌等學業上 的相互砥礪及生活上的相互關懷,都將成為我永難忘懷的回憶。 最後,僅將本論文獻給我摯愛的先生在程式軟體上的協助及熬夜時默默陪 伴,小蘿蔔頭們常常忍受吃不到媽咪親手煮菜的遺憾及默默幫助我的師父們,感 謝大家不計的付出; 並獻給我敬愛的雙親,感謝他們不辭辛勞的養育之恩,以及 關心我的公婆及諸親友。畢業並非結束,而是另一個嶄新的開始,我將會秉持出 發心,盡力完成使命,以不負各方所望。 民國九十七年一月謹記於臺中 iii.
(6) Modeling Repeated Choice Behaviors of Automobile Insurance Policies for New Car Owners. TABLE OF CONTENTS PAGE CHAPTER 1 INTRODUCTION ..................................................................... 1 1.1 Background and Motivation ................................................................... 1 1.2 Research Objectives ............................................................................... 3 1.3 Research Scope....................................................................................... 3 1.4 Research Approach ................................................................................. 4 1.5 Research Procedure ................................................................................ 8 1.6 Chapters Organization .......................................................................... 11 CHAPTER 2 LITERATURE REVIEW ....................................................... 12 2.1 Automobile Insurance Practice ........................................................... 12 2.2 Asymmetric Information in Automobile Insurance ............................. 16 2.3 Automobile Insurance Decision ........................................................... 18 2.4 Discrete Choice Modeling of AIP Choice ............................................ 19 2.5 Panel Data Analysis .............................................................................. 20 2.6 Summary .............................................................................................. 22 CHAPTER 3 MODELING FRAMEWORK ................................................... 24 3.1 Methodology Framework ..................................................................... 24 3.2 Multinomial Logit Model ..................................................................... 30 3.3 Nested Logit Model .............................................................................. 31 3.4 Paired Combinatorial Logit Model ...................................................... 36 3.5 Explanatory Variables in Choice Models ............................................. 38 3.6 Hypothesis Testing and Goodness-of-fit-Measures ............................. 39 CHAPTER 4 EMPIRICAL DATA ................................................................ 42 4.1 Sample Selection .................................................................................. 42 iv.
(7) PAGE 4.2 Frequency Analysis of Chosen Alternatives ....... …………………….45 4.3 Cross Tabulations of Alternatives by Variables.................................... 49 CHAPTER 5 ESTIMATION RESULTS OF MULTINOMIAL LOGIT AND NESTED LOGIT MODELS ........................................ 54 5.1 Estimation Results of Multinomial Logit Model ................................. 54 5.2 Estimation Results of Nested Logit Model .......................................... 59 5.3 Discussions ........................................................................................... 67 CHAPTER 6 ESTIMATION RESULTS OF PAIRED COMBINATORIAL LOGIT MODELS ............................... 69 6.1 Estimation Results Using Three-year Samples .................................... 69 6.2 Estimation Results Using Four-year Samples ...................................... 70 6.3 Discussions ........................................................................................... 72 CHAPTER 7 CONCLUSIONS AND DIRECTIONS FOR FUTURE RESEARCH............................................................................. 74 7.1 Conclusions .......................................................................................... 74 7.2 Directions for Future Research ............................................................ 77. REFERENCES ................................................................................................ 79 APPENDIX A : ABBREVIATIONS .............................................................. 88 APPENDIX B : NOTATIONS ........................................................................ 90 APPENDIX C : VITA ..................................................................................... 91. v.
(8) LIST OF TABLES PAGE Table 2.1 Voluntary Automobile Insurance System in Selected Countries....... 14 Table 3.1 Proposed Model ................................................................................. 29 Table 3.2 Possible Alternatives for Physical Damage Coverage Bundles ........ 30 Table 4.1 Market Share of the Selected Automobile Insurance Company ....... 43 Table 4.2 Percentage of Total Written Premium of Type A Coverage by Company A ....................................................................................... 44 Table 4.3 Percentage of Total Written Premium of Type B Coverage by Company A ....................................................................................... 44 Table 4.4 Percentage of Total Written Premium of Type C Coverage by Company A ....................................................................................... 44 Table 4.5 Number and Percentage of Sampled Insured by Consecutive Years .................................................................................................. 46 Table 4.6 Frequency Analysis of the Insured and Vehicle Characteristics ...... 47 Table 4.7 Sample Frequencies of the Alternatives ............................................ 48 Table 4.8 Chosen Alternatives - Three-year Samples ....................................... 49 Table 4.9 Chosen Alternatives by Age for Three-year Samples ....................... 50 Table 4.10 Chosen Alternatives by Age for Four-year Samples ...................... 50 Table 4.11 Chosen Alternatives by Age for Five-year Samples ....................... 51 Table 4.12 Chosen Alternatives by Vehicle Make for Three-year Samples ............................................................................................. 51 Table 4.13 Chosen Alternatives by Vehicle Make for Four-year Samples ............................................................................................. 52 Table 4.14 Chosen Alternatives by Vehicle Make for Five-year Samples ............................................................................................. 52 Table 4.15 Chosen Alternatives by Engine Capacity for Three-year Samples ............................................................................................. 53 vi.
(9) PAGE Table 4.16 Chosen Alternatives by Engine Capacity for Four-year Samples ............................................................................................. 53 Table 4.17 Chosen Alternatives by Engine Capacity for Five-year Samples ............................................................................................. 54 Table 5.1 Estimation Results of Multinomial Logit Using Three-year Samples ............................................................................................. 56 Table 5.2 Estimation Results of Multinomial Logit Using Four-year Samples ............................................................................................. 58 Table 5.3 Estimation Results of Multinomial Logit Using Five-year Samples ............................................................................................. 59 Table 5.4 Estimation Results of Nested Logit Models Using Three-year Samples ............................................................................................. 61 Table 5.5 Estimation Results of Nested Logit Models Using Four-year Samples ............................................................................................. 64 Table 5.6 Estimation Results of Nested Logit Models Using Five-year Samples ............................................................................................. 67 Table 6.1 Estimation Results of Paired Combinatorial Logit Model Using Three-year Samples .......................................................................... 71 Table 6.2 Estimation Results of Paired Combinatorial Logit Model Using Four-year Samples ............................................................................ 72. vii.
(10) LIST OF FIGURES PAGE Figure 1.1 Research Flowchart ......................................................................... 10 Figure 3.1 Nested Structure (I)-Three-year Samples ........................................ 33 Figure 3.2 Nested Structure (I)-Four-year Samples .......................................... 34 Figure 3.3 Nested Structure (I)-Five-year Samples .......................................... 34 Figure 3.4 Nested Structure (II)-Three-year Samples ....................................... 35 Figure 3.5 Nested Structure (II)-Four-year Samples......................................... 36 Figure 3.6 Nested Structure (II)-Five-year Samples ......................................... 36 Figure 3.7 Nested Structure of the Paired Combinatorial Logit Model ............ 37 Figure 5.1 Estimation Result of Nested Structure (I)-Three-year Samples ...... 62 Figure 5.2 Estimation Result of Nested Structure (II)-Three-year Samples ..... 62 Figure 5.3 Estimation Result of Nested Structure (I)-Four-year Samples ........ 65 Figure 5.4 Estimation Result of Nested Structure (II)-Four-year Samples ...... 65 Figure 5.5 Estimation Result of Nested Structure (I)-Five-year Samples ........ 66. viii.
(11) CHAPTER 1 INTRODUCTION. 1.1 Background and Motivation. Traffic accident is a critical issue from the perspective of society as a whole. The potential risks of using an automobile involve damage to one's own property, damage to the property of others, personal injury, and injury to others. Many governments have promulgated laws mandating compulsory automobile insurance to provide basic compensation for property damage and personal injury occurred by traffic accidents (Murray et al., 1994). However, the basic compensation system of compulsory insurance cannot transfer all risks involved in using vehicles.. Car owners often purchase appropriate automobile insurance policies (AIP) to cover potential risks in traffic situations so as to reduce the personal worry or stress incurred from traffic accidents (Sherden, 1984). Except for compulsory insurance, auto owners in many countries are required, in compliance with the law, to obtain voluntary AIP to protect themselves from lawsuits when accidents involve vehicle damage and personal injuries (Murray et al., 1994).. AIP in many countries is characterized by complicated bundled designs that provide distinct degrees of insurance coverage to accommodate various risks in traffic accidents. The exact composition of AIP is up to the insured. Today, the total written premiums of automobile insurance constitute the bulk of the non-life insurance market and are the main source of revenues for non-life insurance companies. In most developed countries, the automobile insurance market is thus highly competitive, with an increasing number of service providers.. 1.
(12) Physical damage coverage, the most expensive policy, is the major source of incomes for non-life insurance companies. In most countries, the rate for physical damage coverage is higher than other (non-physical damage coverage) policies. New car owners are likely to purchase physical damage coverage in the first year. However, they may decrease their automobile insurance expenditures by purchasing reduced coverage or not buying any physical damage coverage in the subsequent years. As such, premium revenues for non-life insurance companies will be substantially decreased.. Accordingly, it is crucial for automobile insurance companies to understand the insured’s repeated choice behavior, particularly in the first few years after purchasing a new car. Understanding of the insured’s preferences on selection of bundled AIP is vital for non-life insurance firms seeking to maintain their competitive advantages. The insurer can use the insights to modify insurance policies and provide enough incentives for the insured to enhance repurchase intention so as to retain stable revenues. Consumers, on the other hand, can benefit from the understanding as well since sufficient insurance knowledge assures adequate compensation for property damage loss. Unfortunately, the information between the insured and the insurer is asymmetric and the insured’s repurchase behaviors are not well understood so far (Cohen, 2005).. Despite a significant number of studies have been devoted to automobile insurance rates, moral hazard, fraud behavior, adverse selection and risk perception of claims, yet exploration of factors affecting the insured’s selection of bundled AIP has been very limited. The choice of bundled AIP is very similar to the problem of selecting individual items from a menu (Ben-Akiva and Gershenfeld, 1998). The insurer offers bundles of insurance policies that cover different risks associated with traffic and related accidents. Recent study by Wen, et al. (2005) has proposed the use of discrete choice models (Ben-Akiva and Lerman, 1985) to 2.
(13) identify important variables associated with the selection of bundled AIP and to explore substitution patterns among highly similar AIP bundles using one year dataset from an automobile insurance company in Taiwan. To the best of our knowledge, no research has examined the insured’s repeated choice of AIP bundles except Wen et al. (2007). Therefore, the research is motivated by the need of developing an analytical approach to obtain insights of the demand choice for AIP. It is hoped that the research could offer valuable implications for the insurer to develop effective marketing strategies to ensure their stable revenues.. 1.2 Research Objectives. The objectives of the research are:. 1. To understand better the insured’s behavior, the research develops a methodological framework that enables us to analyze insured’s choice of AIP. In particular, the development of operational models allows exploring repeated choices associated with AIP. 2. The proposed modeling framework is empirically illustrated using a panel data provided by a non-life insurance company in Taiwan. The applicability and usefulness of the model structures is explicitly demonstrated and properly tested. 3. The insurer can use the results to modify existing insurance policies or develop marketing strategies that enable the insured to increase repurchase intention.. 1.3 Research Scope. Pacing Taiwan’s economic development, the number of automobiles and motorcycles has increased rapidly. In a highly populated area as Taiwan, the vehicle density is the source of 3.
(14) many problems, particularly traffic accidents. During the last few decades, the percentage of autos used for non-commercial purposes has been approximately 97 percent of all autos. As a result, the written premiums of non-commercial vehicles are the main source of revenues for non-life insurance companies. Thus, the study only examines the insured of non-commercial automobiles and will exclude motorcycles or other types of privately owned vehicles.. The data used in the research are drawn from a non-life insurance company that has the largest market share among the 16 non-life insurance companies in Taiwan. The data set consists of the new car owners who repeatedly purchased bundled AIP from the company since 2000. In other words, we selected the data in which the insured purchased new cars in 2000 and also purchased physical damage coverage for that year and the subsequent years. Those purchasing new cars before and after 2000 were excluded.. Due to data availability, the explanatory variables in this study are limited only to age, gender, marital status, vehicle make and engine capacity. Other important personal attributes (e.g., income, education, occupation and religion) are confidential by law and its access is absolutely forbidden.. 1.4 Research Approach. The choice of bundled AIP is similar to selecting features from a menu available for customization. Consumers may decide simultaneously which coverage should be included in their insurance package. An AIP alternative (i.e. possible outcomes of the decision process) thus consists of a combination of different coverage. However, the total number of AIP alternatives in our choice problem may be relatively large, especially when the number of available insurance coverage increases. For model development, inclusion of all alternatives 4.
(15) in an individual model would increase the difficulty of model calibration and interpretation of parameter estimates. To simplify the complex choice problem, a model system involving separate models would become more feasible. The development of a simplified model can serve as a preliminary step towards a more general and behaviorally realistic model.. The proposed model system for the choice of bundled AIP in this study consists of two components. The first component is the decision to select physical damage coverage. The insured can select from among three types of physical damage coverage and/or without any coverage. The second component in the model system is the choice of non-physical damage coverage involving third party liability as a basic protection with addition of passenger liability or other endorsement, such as the coverage for bodily injury due to intoxicated driver and/or injury to any persons in the vehicle, including the driver. This research focuses on the first component of the model system, and the decision for choosing non-physical damage coverage involving third party liability is included in the bundle of physical damage coverage.. Car owners who have disposed of their vehicles more than five years old may do so in part because of the yearly inspection requirement by the motor vehicles department or the rapidly increasing repair cost for such old vehicles. Thus, the data set for model development and estimations consists of the insured repeatedly purchasing bundled AIP from the selected company over three, four and five years.. To gain insights into the insured’s repeated choice behaviors in the first few years after purchasing a new car, this research develops a discrete choice modeling framework for analysis of repeated choices associated with physical damage coverage types, and the number of consecutive years the insured has purchased the same type of physical damage coverage. Our proposed model extends the work by Wen, et al. (2005) which examined a selection of 5.
(16) bundled AIP using a one year cross-sectional database from a non-life insurance company. To capture the dynamic aspects of AIP choice behavior, this research uses panel data offered by a non-life insurance company that include the sequence of AIP choices made by the insured.. The discrete choice model is derived from random utility theory. An insured faces a choice among a set of mutually exclusive and exhaustive alternatives in terms of combinations of physical damage coverage types and the number of consecutive years the insured has purchased the same coverage. Under the principle of utility maximization, the insured chooses the alternative with the highest utility. The utility function of an alternative consists of the deterministic and random error components. Depending on assumptions which impose on distributions of error terms, various discrete choice models can be derived.. The multinomial logit model is the most commonly used discrete choice model due to its simple mathematical structure and ease of estimation and interpretation of coefficient estimates. The multinomial logit model is derived from the assumptions that the error terms are independent and identically Gumbel distributed. Due to the restrictive assumptions, the multinomial logit model exhibits the property of Independence from Irrelevant Alternatives (IIA), which is unrealistic in many choice problems.. The most widely used model to relax the undesirable IIA property is the nested logit (McFadden, 1978; Williams, 1977), which accounts for interdependence between pairs of alternatives by grouping alternatives in the nest. In the nested logit model, each alternative only appears in one nest, and each nest consists of one or multiple alternatives. In our case, a two-level nested model with physical damage coverage choice (Types A, B, and C) at the upper level and number of consecutive years purchasing the same type of physical damage coverage at the lower level is developed. An alternative nested structure which includes the 6.
(17) number of consecutive years at the upper level and coverage type choice at the lower level is also tested.. Although the nested logit model accounts for interdependence between pairs of alternatives in the same grouping, the restriction on the identical correlations of the alternative pairs in the same nest may be unrealistic in some cases. The paired combinatorial logit Model enables better representation of substitution patterns among the bundled AIP alternatives. The paired combinatorial logit model has a more flexible error correlation structure than the multinomial logit and nested logit models and allows differential correlation between pairs of alternatives. The formulation of the proposed choice models such as the multinomial logit, nested logit and paired combinatorial logit is explicitly described.. The data used for empirical analysis were drawn from a non-life insurance company that has the largest market share among the 16 non-life insurance companies in Taiwan. The data set consists of the new car owners who repeatedly purchased bundled AIP from 2000. We selected the data in which the insured purchased new cars in 2000 and also repeatedly purchased physical damage coverage from the same company.. The estimation results of the multinomial logit, nested logit and paired combinatorial logit models were performed using the NLOGIT and GAUSS software. The parameter estimates in the models were tested, and the model performance was evaluated using goodness-of-fit indices and likelihood ratio tests. The applicability of the proposed choice models is explicitly demonstrated.. 7.
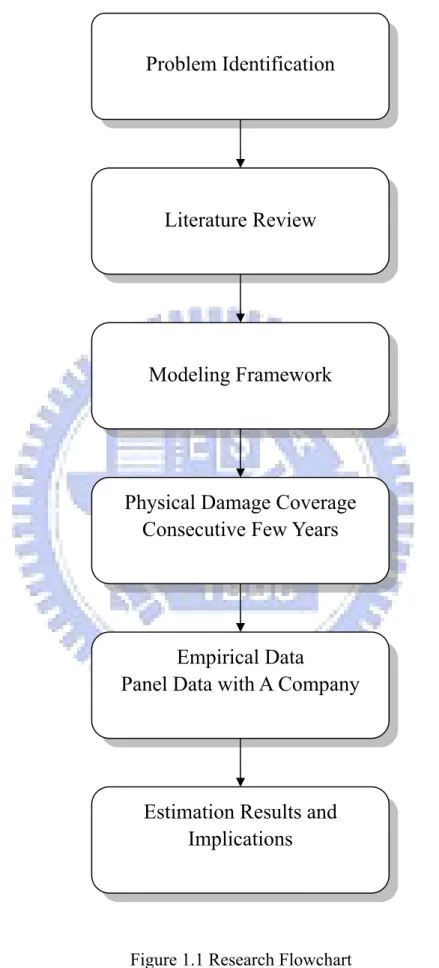
(18) 1.5 Research Procedure. The research procedure is elaborated in the following and depicted in Figure 1.1. (1) Problem identification. The first step is to identify the purposes and scope of this study, and to address problems which need to be explored. (2) Literature review The second step is to review the AIP related research, including current practices of automobile insurance, automobile insurance decision and discrete choice modeling and panel data analysis. The methods, including multinomial logit model, nested logit model and paired combinatorial logit model with a cross section data and panel data, used in this study are also reviewed. This step helps to realize the current state of development of choice behavior and to facilitate the theoretical modeling. (3) Automobile Insurance Policies (AIP) choice behavior and model development We presented the modeling framework developed for conducting the empirical analysis of bundled AIP choice behavior of new car owners. The methods included multinomial logit model, nested logit nodel and paired combinatorial logit model. This research presents a discrete choice modeling framework for analysis of repeated choices associated with physical damage coverage types, and the number of consecutive years the insured has purchased the same type of physical damage coverage. (4) Empirical data and estimation result The selected samples were drawn from a non-life insurance company. To capture the dynamic aspects of AIP choice behavior, this research uses panel data that include the sequence of AIP choices made by the insured. To investigate the factor of choice behavior of the proposed multinomial logit model and nested logit models, the panel data with a 8.
(19) non-life insurance company the proposed nested logit with repeated buying the same policies consecutive three, four and five years. Paired combinatorial logit model analyses are conducted to examine the panel data with consecutive years not only purchasing the same policies for four consecutives years, but also consists with the change of buying different type of bundles policies for consecutive years. In this procedure, the exemplified examples and field cases are simulated by the programs coded by the GAUSS. (5) Conclusions and implications. The major findings in the processes of model formulation and model validation will be summarized. The strengths and weaknesses of the proposed models will be thoroughly discussed. At last, some suggestions for future studies will be identified.. 9.
(20) Problem Identification. Literature Review. Modeling Framework. Physical Damage Coverage Consecutive Few Years. Empirical Data Panel Data with A Company. Estimation Results and Implications. Figure 1.1 Research Flowchart. 10.
(21) 1.6 Chapters Organization. The rest of the dissertation is organized as follows. Chapter two presents a comprehensive review of automobile insurance practice and related literature. Chapter three proposes a methodological framework of AIP choice and develops the formulation of discrete choice models that characterize selection of different physical damage coverage and number of consecutive years purchasing the same coverage type. Chapter four describes the dataset to be used and presents frequency and cross table analysis of chosen alternatives and explanatory variables. Chapters five and six consist of the estimation results of various choice models. Chapter seven summarizes the research findings and concludes with issues for further studies.. 11.
(22) CHAPTER 2 LITERATURE REVIEW. The chapter reviews previous literature relevant to this study, including current practices of automobile insurance, automobile insurance decision and discrete choice modelling and panel data analysis. Section 2.1 describes automobile insurance practices in some developed countries and in Taiwan. The special characteristics with asymmetric information in automobile insurance are described in Section 2.2. The remainder of the sections comprises the existing literature on AIP selection, discrete choice modelling approaches used in automobile insurance and repeat purchase behaviour with panel data.. 2.1 Automobile Insurance Practice. Automobile insurance represents nearly 50 percent of property/liability insurance premium volume in many countries (Ma and Schmit, 2000). AIP products in many countries are characterized by complicated designs, most of which are in bundled packages. Different bundled packages provide different degrees of protection (coverage). New policies and new extended coverage are often provided by insurers.. Two different systems of automobile insurance are in common practice around the world: compulsory and voluntary insurance. Most countries impose compulsory insurance, generally defined as the minimum amount of automobile liability insurance that meets the law. In addition to compulsory insurance, automobile drivers may purchase higher amounts of optional liability insurance to satisfy their particular needs and transfer possible risks associated with traffic and other related accidents. As a result, most drivers purchase voluntary insurance coverage for physical damage to own vehicles, property damage, bodily 12.
(23) injury, and other special liabilities. Voluntary insurance offers a multitude of optional coverages, characterized by complicated designs, most of which are in bundled packages with different degrees of coverage.. There are several different types of insurance coverages for vehicle physical damage. One type covers any accidental loss to the insured on an all-risks basis, while another, termed perils coverage, covers particular causes of loss under the selected items, and no coverage is offered for perils not listed. As in Table 2.1, physical damage coverage designed on an all-risks basis in some countries includes the risks associated with collision, fire, lightning, struck by lightning, explosion, missiles or fall objects, malicious mischief or vandalism, theft and. any. unidentified. reasons. other. than. the. exclusions. (designated. P1+P2+P3+P4+P5+P6+P7+P8). In addition, the insured in such countries can purchase an optional insurance policy that only covers collision (P1).. In the US (Pataki and Serio, 2004),. physical damage coverage includes the risks associated with (P2+P3+P4+P5+P6+P7+P8), but not P1. In the UK, insurers provide two additional policies to protect against damage that might occur during situations involving both fire and theft (P2+P8) as well as windscreen damage (P9) in which the insurer will pay to replace or repair broken glass in the windscreen or windows of the car, along with scratches on the bodywork caused by the broken glass, as long as there has not been any other loss or damage.. 13.
(24) Table 2.1 Voluntary Automobile Insurance System in Selected Countries Insurance Physical. US. Japan. Coverage z. Damage. P1+P2+P3+P4+P5+P6+P7. UK. (New York State) z. +P8. P2+P3+P4+P5+P6+P7+. z. P8. P1+P2+P3+P4+P5+P6+P7+. P1. z. z. P8. Coverage z. Taiwan. P1. z. P2+P8. z. P9. P1+P2+P3+P4+P5 +P6+P7 [PA]. z. P1+P2+P3+P4+P5 [PB]. z. P1 [PC]. z. P8 [T]. z. L1. z. L1. z. L1. z. L1+L2 [TP]. z. L2. z. L2+L3. z. L2+L3. z. L1+L2+L3 [TP+I]. Damage. z. L1+L4. z. L1+L4+L7. Coverage. z. L2+L4. z. L2+L4+L7. z. L5+L6+L7. z. L1+L2+L4+L5+L6+L7. z. L6+L7. Non-Physical. z. L6. [TP+PL] z. L1+L2+L3+L4+L5+L6+ L7 [TP+I+PL]. z. L8. z. L8. z. L9. z. L9. z. L10. z. L10. z. L8. z. L10 z. Perils. L10. L1: Property damage. P1: Collision. L2: Bodily injury. P2: Fire. L3: Intoxicated driver. P3: Lightning, struck by lightning. L4: Spousal liability. P4: Explosion. L5: Family’s personal injury. P5: Missiles or fall objects. L6: Passenger’s (personal accident) or liability. P6: Vandalism P7: Any unidentified reasons other than the exclusions P8: Theft. L7: Drivers’ personal injury L8: Uninsured motorists L9: Additional PIP (No-Fault) benefits. P9: Windscreen damage. L10: Other special coverage. Sources: Non-life Insurance Rating Organization (2004) Pataki, G.E. and Serio, G.V. (2004) Department of Insurance, Ministry of Finance (2004) Screen Trade Insurance Company (2005). In Taiwan, three types of physical damage coverage not involving theft loss are offered in the automobile insurance market. Physical damage Type A coverage (PA) covers all risks of collision and non-collision losses except for theft. Physical damage Type B coverage (PB) 14.
(25) which excludes losses where it is hard to verify the cause or source covers almost the same range of risks as PA except for vandalism and any unidentified reasons other than the exclusions in the policy. Physical damage Type C (PC) only covers damage in a collision and here will be termed P1. Drivers in Taiwan can select from three types of physical damage coverage (PA, PB, and PC) with an optional coverage, theft loss (T).. Voluntary insurance other than physical damage coverage consists of third party liability, accident liability, and other special liabilities. Third party liability covers a third party in or out of the vehicle. Third party liability in selected countries covers property damage (L1) or bodily injury (L2) and the limits of the coverage are agreed upon separately for L1 and L2. The coverage for bodily injury due to intoxicated driver (L3) is included in L2. The spousal liability (L4) covers the liability due to death of or injury to the spouse and should be purchased jointly with L1 or L2 in the US. However, the L4 and L7 coverages (called personal accident benefits in UK) should be acquired together with L1 or L2. The bundled policies L5+L6+L7 and L6+L7 are named “accidental death and dismemberment” and “medical payment” coverages, respectively, in the US.. Special coverage in general includes two policies: one is to protect against the injuries that the driver, the driver’s family, or passengers might suffer in a hit-and-run accident or in an accident with an uninsured vehicle, called uninsured motorists coverage (L8). Additional personal injury protection-PIP (no-fault) benefit (L9) is designed to add more no-fault protection. Each country also has unique forms of insurance (L10). For instance, in Japan there is “long-term automobile policies with a maturity refund,” a recently developed product (Non-life Insurance Rating Organization, 2004).. In Taiwan, the third party liability (TP = L1+L2) is a basic coverage. The L3 (renamed to I) 15.
(26) coverage, if purchased, should be bought jointly with L1+L2. The PL (=L4+L5+L6+L7) covers injury to any persons in the vehicle, including the driver. Generally speaking, non-physical damage coverage in other countries has a more complex design that includes complete coverages to cover property damage and personal injuries than similar coverage in Taiwan. This is due to the fact that non-life insurance companies in Taiwan are not permitted to sell insurance coverage associated with personal risks.. 2.2 Asymmetric Information in Automobile Insurance. The information of AIP market is asymmetric, which means the insurers may understand the “terms and conditions” much better than the insured; but the insured definitely understand the “real risk of their own driving behaviors” much better than the insurers. Compared with the insurers, the insured may not have sufficient knowledge about the AIP products and they are likely to misunderstand the exact protection offered by the policies. Although the AIP products themselves are completely visible, certain aspects such as policy clauses, calculation of premiums, and degrees of coverage do require professional knowledge to understand. This asymmetric information frequently leads to an “adverse selection” phenomenon (from insurers’ perspectives), which further complicates the insurance provision (Hosios, and Peters, 1989; Jee, 1989; Landsberger and Meilijson, 1994; Lewis and Sappington, 1995; Ligon and Thistle, 1996; Inderst and Wambach, 2001; Ania et al., 2002; Theilen, 2003).. By definition, more risk-averse persons demand for more insurance coverage. Adverse selection is the tendency of persons with higher-than-average chance of loss to seek insurance at. standard. rates,. which,. if. not. controlled. by. underwriting, would result in. higher-than-expected loss levels. The high-risk drivers would choose for auto insurance at lower (standard) rates; a driver with higher loss probability or higher degree of risk aversion 16.
(27) would choose for lower deductible; these are two good examples of adverse selection of AIP (Smith and Head, 1978; Schlesinger, 1981; Dahlby and Riley, 1983; Dellaert, et al., 1990; Dionne and Doherty, 1994; Venezia, 1984; Artis et al., 2002;). Another example of adverse selection was found where either a tort system or a no-fault system of compensation being provided, the high-risk drivers would prefer to choose the no-fault system, which was associated with higher levels of uninsured motorists (Carr, 1989; Ma and Schmit, 2000; Devlin, 2002; Schmit and Yeh, 2003).. The insurance industry is a limited information subscription market, which is a type of market characterized by five properties and brings about the problem of adverse selection. First, by law all drivers in most developed countries must purchase auto insurance to drive, consumers purchase the products continuously over time. Second, these markets are generally characterized by tenure dependence in demand (Joskow, 1973). Many consumers are unaware that there are price differences among insurance companies since they in a different risk class, lives in a different community, and drives a different kinds of car. Third, long term relationships provide an opportunity for consumers and firms to learn about one another. For example, automobile insurance consumers learn the quality of their firm’s claims service (Bond and Stone, 2004). With regard to the cost of switching suppliers, that is a reason why consumers may not opt for lower priced policies (Schlesinger and Schulenburg, 1991). Fourth, characteristic of these markets is limited consumer information about the existence, price and attributes of alternate firms. Firms use observed claims to update expectations of consumer claims risk (Boyer, et al., 1989). Finally, firms in these markets are able to price discriminate on the basis of consumer characteristics and histories.. The source of observed tenure. dependence in demand, the value placed on claims service and the speed with which this service is learned, and the impact of expected future price changes (Barros, 1996).. 17.
(28) Properties 1 to 3 show both insurer and insured need to learn about another by long term repeat buying. The insured first perceive satisfaction when claims are processed, while the insured learn the risk type of insured from their claims records. Properties 4 to 5 show the insurer must deal with the problems of adverse selection .Although adverse selection can never be completely eliminated, they can be controlled by careful underwriting. Underwriting refers to the process of selecting and classifying applicants for insurance. Applications who meet the underwriting standards are insured at standard rates. If the underwriting standards are not met, the insurance is denied or an extra premium must be paid.. 2.3 Automobile Insurance Decision. The potential risks of using an automobile involve damage to one's own and others’ vehicles and property in collision, vandalism, theft and related loss, and injuries to driver, passengers and third parties. Car owners often purchase appropriate AIP to cover such potential risks so as to reduce the personal worry or stress incurred from traffic accidents. In compliance with the law, auto owners in many countries are required to purchase compulsory AIP to protect themselves from lawsuits when accidents involve damage and injuries (Murray et al., 1994). People are willing to purchase insurance, thereby paying a risk premium, in order to eliminate the possibility of a large loss in the future. Schlesinger (1981) and Hayakawa (2000) found that insurance demand and risk aversion were positively correlated. The insured essentially expect their insurance to cover what is supposed to do (Schlesinger and Schulenburg, 1993; sherden, 1984). Namely, car owners normally desire a policy that can provide protection through the reimbursement to their claims and that is accompanied with good service at a reasonable price.. The insured often does not have sufficient knowledge about the AIP product such as policy 18.
(29) clauses, calculation of premiums, and degrees of coverage. They do not seem to care about the details of the insurance policies; instead, they very likely rely on others (e.g., the dealers (Anderson and Weitz, 1998)) to make the selection decisions for them, or at least to provide recommendations on such issues as limits, deductibles and other coverage. Car dealers play an important role in automobile insurance market in Taiwan.. 2.4 Discrete Choice Modeling of AIP Choice. Previous studies of AIP have examined choosing between no-fault and tort systems (Zador and Lund, 1986; Carr, 1989; Berrig et al., 1994; Harrington, 1994; Schmit and Yeh, 2003) or selection of the deductible in a single policy (Smith and Head, 1978; Schlesinger, 1981; Venezia, 1984; Chiappori and Salanie, 2000). Despite numerous prior studies on insurance rates (Sant, 1980; Jee, 1989; Bonato and Peter, 2002; Dionne and Ghali, 2005), moral hazard, fraud (Viaene et al., 2002; Major and Riedinger, 2002; Picard, 1996; Brockett et al., 2002), adverse selection (Murray et al., 1994; Cummins and Weiss, 1991; Dionne and Doherty, 1994; Janssen and Karamychev, 2005), and risk perception of claims (Dellaert et al., 1990, Lee and Urrutia, 1996; Lee et al., 2001; Tennyson and Pau, 2002; Caudill et al., 2005), the underlying factors affecting insured selection of bundled AIP have not been addressed explicitly.. The choice of bundled AIP is similar to selecting individual features or items from a menu, such as purchase of cable TV service or buying computers (Ben-Akiva and Gershenfeld, 1998). The discrete choice modeling approach has been extensively used to examine the choice of one from a set of mutually exclusive alternatives. However, applications of discrete choice model in the field of automobile insurance have been relatively scarce in the literature.. 19.
(30) Artis et al. (1999) employed discrete choice models to study fraud behavior and assessed the effect of the personal characteristics of the insured on claims and fraud behavior. Artis et al. (2002) further used the multinomial logit and nested logit models to estimate the influence of the insured and claim characteristics on the probability of committing fraud. Recent work by Wen et al., (2005) proposed the use of the multinomial logit and nested logit models to identify variables related to the selection of bundled AIP and to explore substitution patterns among highly similar AIP bundles. We need to analyze insured choice of AIP by using an alternative model that enables better representation of similar characteristics of bundled AIP. The paired combinatorial logit model has a more flexible error correlation structure than the multinomial logit and nested logit models, and allows the estimation of differential substitution patterns between each pair of alternatives while retaining the computational advantages of close-form generalized extreme value models. Wen et al., (2006) using Paired Combinatorial Logit model for analyzing the determinants that influence demand for bundled automobile insurance policies and simplify the complex choice problem, a model system involving two separate models is developed by draw one year of insured records from a non-life insurance company. And find that non-physical damage coverage involving third party liability be regard as a basic protection with addition of passenger liability and/or intoxicated driver. This research indicated that the multinomial logit or nested logit models may not be appropriate for analyzing the insured’s choice behavior.. 2.5 Panel Data Analysis. Panel data analysis has been applied in brand choice with different products (Allenby and Rossi, 1991; Buckley, 1988; Seetharaman and Chintagunta, 1998), electoral systems or vote on the move (Shively, 1982; Sarlvik and Crewe, 1983; Rochon, 1981; Richardson, 1975,1977, 1986, 1988) and insurance (Cooper and Hayes, 1987; Israel, 2001; Nekby, 2004; Rubinstein 20.
(31) and Yaari, 1983;Wang, 2004), where research focuses on adverse selection and moral hazard.. Marketing research often focuses on understanding consumer choice behavior for products and brands over time using panel data (Roy et al., 1996). In marketing research studies, Howard and Sheth (1969) proposed that households may routinize their brand purchases by using the same brand repeatedly over time. This means that the currently chosen brand has a higher probability of being chosen in the future than other brands. In such a situation, we can observe the repeat purchase behavior to understand the brand choice behavior of consumers. The estimation of brand choice using a repeated buying pattern may be performed using the Bernoulli model, which assumes that the previously bought brand does not affect the subsequent purchase choice. However, this model cannot estimate the carry-over effect. The Markov model, on the other hand, helps estimation of the carry-over effect but specifies that the current purchase choice is based on only one period of previous purchase behavior. In the past a logit model has been widely applied to brand choice (Jones and Landwehr, 1988; Currim, 1982; Kamakura and Srivatava, 1984; Allenby, 1989). Guadagni and Little (1983) indicated that the logit model is suitable for estimation of the real buying behaviors of consumers.. A small number of studies of AIP choice have considered panel data over a few years, but have not observed new car owners’ insurance choice behaviors over several years. Austin (1996), Sant (1980) and Artis et al. (1999; 2002) used the multinomial logit model to estimate the effect of the insured and the claim, but the observed period was only a two-period game between a risk neutral insurance seller and a risk. Previous literature on automobile insurance using panel data discussed the loss characteristics due to rate discrimination (e.g. Wang, 2004). Obviously, the insured’s repurchase behaviors are not well understood, and it deserves to be investigated. Wen et al., (2007) first presents a discrete choice modeling framework for 21.
(32) analysis of repeated choices associated with expensive AIP-the bundled physical damage coverage and the number of consecutive years the insured has purchased the same type of AIP with above four years panel data. This study find insured purchase automobile insurance from car dealers, they are likely to buy expensive coverage, imply car dealer control most of source of automobile insurance market by new car. But this study only using nested logit model and only choose the data in which the insured purchased new cars in 2000 and also purchased physical damage coverage for that year and the subsequent over three years.. 2.6 Summary. This section summarizes the main findings of the review and, where applicable, identifies the gaps that exist in the literature.. Insurance products are different from other products in that they are intangible, existing only as a promise from the insurer. The insurance industry is a limited information subscription market, both insurer and insured need to learn about another by long term repeat buying. Repeat buying can help insurer seeks to maintain the income flow from the insured during the first few years. It can eliminate the adverse selection and moral hazard in the insurance market and enable sellers to obtain market power and higher profits even it supported long sought to develop products that adjust their benefits and premiums to match the needs of buyers as the buyers progress through life. We need collected panel data to analyze data to achieve the goal.. Previous study of AIP have examined choosing between no-fault and tort systems or selection of the deductible in a single policy and only considered the data with single year. Panel data analysis of previous study is used in adverse selection and moral hazard. A small number of 22.
(33) studies of AIP choice have not considered new car owners’ insurance choice behaviors over several years and not observed consecutive few years simultaneously for new car owners by using discrete choice model.. Bundled AIP alternatives have a high degree of similarity. It is therefore essential to develop appropriate models that can explain the purchasing behaviors of similar bundled products in many countries and in Taiwan. AIPs in many countries are characterized by complicated designs, most of which are in bundled packages. Wen et al.,( 2007) presents a discrete choice modeling framework for analysis of repeated choices but have not use paired combinatorial logit model to confirm repeated choice behavior and the behavior of different group with repeated purchase three, four or five years individuals have not addressed.. 23.
(34) CHAPTER 3 MODELING FRAMEWORK. This chapter presents the modeling framework developed for conducting the empirical analysis of bundled AIP choice behavior of new car owners. The theoretical framework is addressed in Section 3.1. Multinomial logit model specification is introduced in Section 3.2. Nested logit model specification is described in section 3.3. Paired combinatorial logit model is presented in Section 3.4. Explanatory variables and hypothesis testings are summarized in Sections 3.5 and 3.6, respectively.. 3.1 Methodology Framework. Two systems of automobile insurance are in wide use around the world: compulsory insurance and voluntary insurance. Compulsory insurance imposed in most countries is defined as the minimum amount of automobile liability insurance that meets the law. In addition to compulsory insurance, automobile drivers may purchase higher amounts of optional liability insurance to transfer possible risks related to traffic and other accidents. As a result, most drivers purchase voluntary insurance coverage for physical damage to own vehicles, property damage, bodily injury, and other special liabilities. Voluntary insurance offers a multitude of optional coverage, characterized by complicated design, most of which are in bundled packages with different degrees of coverage.. The choice of bundled AIP is similar to selecting features from a menu available for customization. Consumers may decide simultaneously which coverage should be included in their insurance package. Table 3.1 shows the proposed model, first Wen et al., (2005) proposed the use of the multinomial logit and nested logit models to identify variables related 24.
(35) to the selection of bundled AIP and to explore substitution patterns among highly similar AIP bundles. An AIP alternative (i.e. possible outcomes of the decision process) thus consists of a combination of different coverage. However, the total number of AIP alternatives in our choice problem may be relatively large, especially as the number of available insurance coverage becomes large. For model development, inclusion of all the alternatives in an individual model would raise the difficulty of model calibration and interpretation of parameter estimates. To simplify the complex choice problem, a model system involving separate models could be developed. This representation of the choice situation may be viewed as unrealistic from a behavioral perspective. However, the development of a simplified model can serve as a preliminary step towards a more general and behaviorally realistic model. Second, Wen et al., (2006) using paired combinatorial logit model for analyzing the determinants that influence demand for bundled automobile insurance policies and simplify the complex choice problem, a model system involving two separate models is developed by draw one year of insured records from a non-life insurance company.. The proposed model system for the choice of bundled AIP in Taiwan consists of two components. The first component is the decision to select physical damage coverage. The insured can select from among different types of physical damage coverage and/or without any coverage. In Taiwan, three types of physical damage coverage without involving theft loss are offered in the automobile insurance market. Physical damage coverage Type A covers all the risks of collision and non-collision losses, except for theft. Physical damage coverage Type B excludes the losses that are hard to verify the cause or source, but it covers almost the same range of risks as Type A, except for vandalism and any unidentified reasons other than the exclusions in the policy. Physical damage coverage Type C only covers damage in a collision. Drivers can select from these three types of physical damage coverage with an optional coverage -- theft loss. Voluntary insurance other than physical damage coverage 25.
(36) consists of third party liability, accident liability, and other special liabilities.. Most new car owners purchase physical damage coverage in the first year. Because the premium of physical damage coverage (especially Type A) is very expensive, car owners may choose to decrease their automobile insurance expenditures by purchasing the reduced coverage or not buying any physical damage coverage in the succeeding years. Physical damage coverage also involves the selection of deductible. The basic deductible of Type A, B or C was NT$3,000 for the first claim. The insured can choose different levels of deductible. However, incorporating the choice of deductible will increase the complex the model.. The second component in the model system is the choice of non-physical damage coverage involving third party liability as a basic protection with addition of passenger liability or other endorsement, such as the coverage for bodily injury due to intoxicated driver and/or injury to any persons in the vehicle, including the driver. Third party liability policy can be extended to include personal accident or other third party liability coverage.. Physical damage coverage, the most expensive policy, constitutes the major source of revenues for the insurance companies. In most countries the level of premiums for physical damage coverage is higher than other policies. If a new car owner purchases a physical damage coverage policy in the first year and then switches to cheaper coverage policies or do not buy any physical damage coverage policies in the following years, premium revenues for non-life insurance companies certainly will be significantly decreased. Thus, knowledge of the factors affecting the insured to switch their choice of the three types of physical damage coverage is critical for insurance companies.. To ensure stable revenues, insurance companies often attempt to enhance customer loyalty 26.
(37) and encourage them to repurchase the same physical damage policy or cheaper physical damage policy year after year. This research focuses on the first component of the model system, and the decision for choosing non-physical damage coverage involving third party liability is included in the bundle of physical damage coverage.. Car owners often dispose of vehicles over five years old in part due to the bothersome yearly inspection required by the motor vehicle department, and in part due to the rapidly increasing repair cost for such old vehicles. Third, Wen et al., (2007) first presents a discrete choice modeling framework for analysis of repeated choices associated with expensive AIP-the bundled physical damage coverage and the number of consecutive years the insured has purchased the same type of AIP with above four years panel data. In practice, car dealer has provide at least two years maintain contract to new car buyers, and give many additional service or discount to incentive new car owners to repeated purchase AIP at least two or three years. In addition, repurchase data of two consecutive years is still too short to identify behavioral trends. Thus, the data used for model development and estimations only comprise the insured repeatedly purchasing bundled AIP over three, four and five years.. During the last few decades, the percentage of autos used for non-commercial purposes has been approximately 97 percent of all autos. As a result, the written premiums of non-commercial vehicles are the main source of revenues for non-life insurance companies. To simplify the complex choice problem, the study only examines the insured of non-commercial automobiles and also excludes motorcycles and other types of privately owned vehicles.. To gain insights into the insured’s repeated choice behaviors in the first few years after purchasing a new car, this research presents a discrete choice modeling framework for 27.
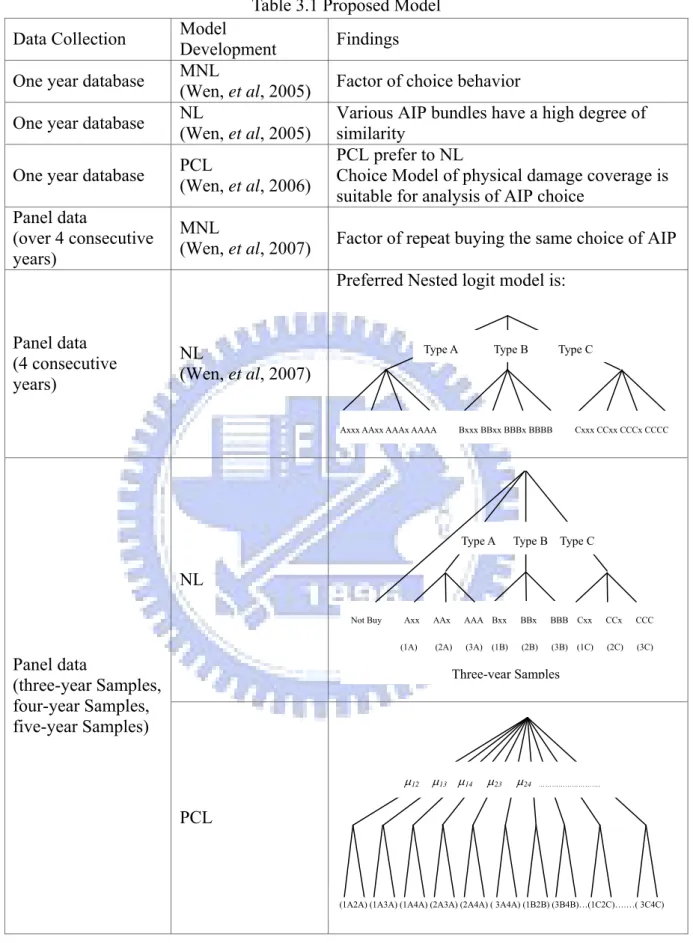
(38) investigation of repeated choices associated with physical damage coverage types, and the number of consecutive years the insured has purchased the same type of physical damage coverage. Table 3.1 show the proposed model extends the work by Wen, et al. (2005) which examined a selection of bundled AIP using a cross-section data in one year from a non-life insurance company using multinomial logit model and nested logit model. Wen, et al. (2006) goes a step further to examine a selection of bundled AIP using a cross-section data in one year using paired combinatorial logit to find the similarity of each pair of alternatives. To capture the dynamic aspects of AIP choice behavior, Wen, et al. (2007) uses panel data that include the sequence of AIP choices made by the insured using nested logit to analyze the choice behavior of new car owners repeated purchase the same type of bundle physical damage type consecutive over four years. According to this research, we adopted the way to divided model into two parts, first part: upper level with physical damage type, lower level with consecutive few years; Second part: upper level with consecutive few years, lower level with physical damage type. The estimation result of nested logit and paired combinatorial logit is to observe the choice behavior of similarity alternatives by consecutive three, four and five year groups.. 28.
(39) Data Collection One year database One year database One year database Panel data (over 4 consecutive years). Table 3.1 Proposed Model Model Findings Development MNL Factor of choice behavior (Wen, et al, 2005) NL Various AIP bundles have a high degree of (Wen, et al, 2005) similarity PCL prefer to NL PCL Choice Model of physical damage coverage is (Wen, et al, 2006) suitable for analysis of AIP choice MNL (Wen, et al, 2007). Factor of repeat buying the same choice of AIP Preferred Nested logit model is:. Panel data (4 consecutive years). Type A. NL (Wen, et al, 2007). Axxx AAxx AAAx AAAA. Type B. Type C. Bxxx BBxx BBBx BBBB. Type A. Cxxx CCxx CCCx CCCC. Type B Type C. NL Not Buy. Axx. AAx. AAA Bxx. BBx. BBB Cxx. CCx. CCC. (1A). (2A). (3A). (2B). (3B) (1C). (2C). (3C). Panel data (three-year Samples, four-year Samples, five-year Samples). (1B). Three-year Samples. μ12. μ13 μ14. μ23. μ24. ……………………….. PCL. (1A2A) (1A3A) (1A4A) (2A3A) (2A4A) ( 3A4A) (1B2B) (3B4B)…(1C2C)….…( 3C4C). 29.
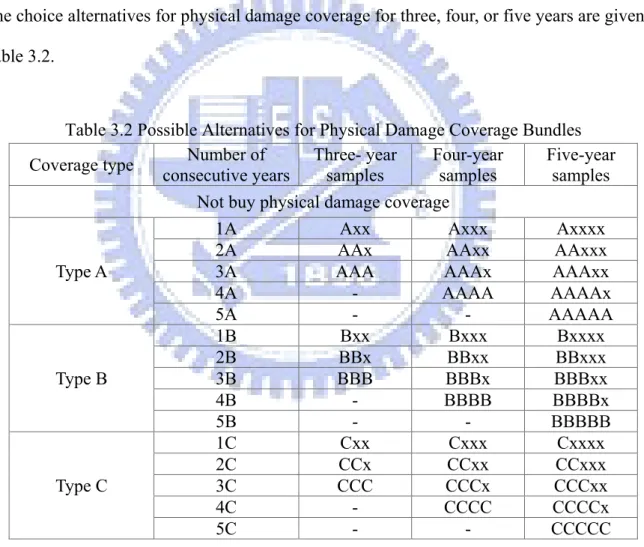
(40) 3.2 Multinomial Logit Model. The discrete choice model is derived from random utility theory (Ben-Akiva and Lerman, 1985). An insured faces a choice among a set of mutually exclusive alternatives in terms of combinations of physical damage coverage types and the number of consecutive years the insured has purchased the same coverage. Within the framework of utility maximizing principle, the insured is assumed to choose the alternative with the highest utility.. The choice alternatives for physical damage coverage for three, four, or five years are given in Table 3.2.. Table 3.2 Possible Alternatives for Physical Damage Coverage Bundles Number of Three- year Four-year Five-year Coverage type consecutive years samples samples samples Not buy physical damage coverage 1A Axx Axxx Axxxx 2A AAx AAxx AAxxx Type A 3A AAA AAAx AAAxx 4A AAAA AAAAx 5A AAAAA 1B Bxx Bxxx Bxxxx 2B BBx BBxx BBxxx Type B 3B BBB BBBx BBBxx 4B BBBB BBBBx 5B BBBBB 1C Cxx Cxxx Cxxxx 2C CCx CCxx CCxxx Type C 3C CCC CCCx CCCxx 4C CCCC CCCCx 5C CCCCC. The utility function of an alternative in terms of physical damage coverage type (t) and number consecutive years (y) for the decision maker n can be expressed as:. U ytn = Vytn + ε ytn. (3.1) 30.
(41) where V ytn and ε ytn represents the deterministic (observable) and random (error) components of utilities for alternative (y, t). The deterministic components of utilities can be specified to be function of observable attributes (e.g., insured and vehicle characteristics).. Linear-in-parameters utility functions are often used due to computational ease and straightforward interpretation of coefficient estimates. The systematic components of the utilities for alternatives (y, t) can be expressed as V ytn = α yt +. ∑β. k. X. ytkn. (3.2). k. where αyt is a constant term specific to the alternative (y, t); Xytkn is the explanatory variable k for alternative (y, t); βk is an unknown parameter reflecting the relative importance of the variable k.. Different assumptions on the distributions of error terms result in different discrete choice models. The multinomial logit model is the most commonly used discrete choice model due to its simple mathematical structure and ease of estimation of parameter estimates. Given the assumptions that the error terms are independent and identically Gumbel distributed, the probability formulation for the multinomial logit model can be derived as: Pytn =. exp( V ytn ). ∑ exp( V y ′t ′. y ′t ′n. (3.3). ). 3.3 Nested Logit Model. Due to the restrictive assumptions that the error terms are independent and identically distributed, the multinomial logit model exhibits the property of Independence from Irrelevant Alternatives, which is unrealistic in many choice problems. Specifically, the multinomial logit 31.
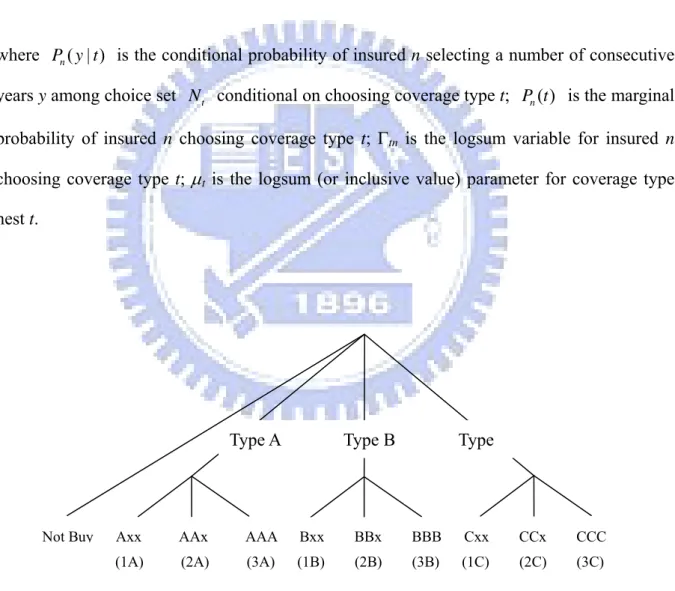
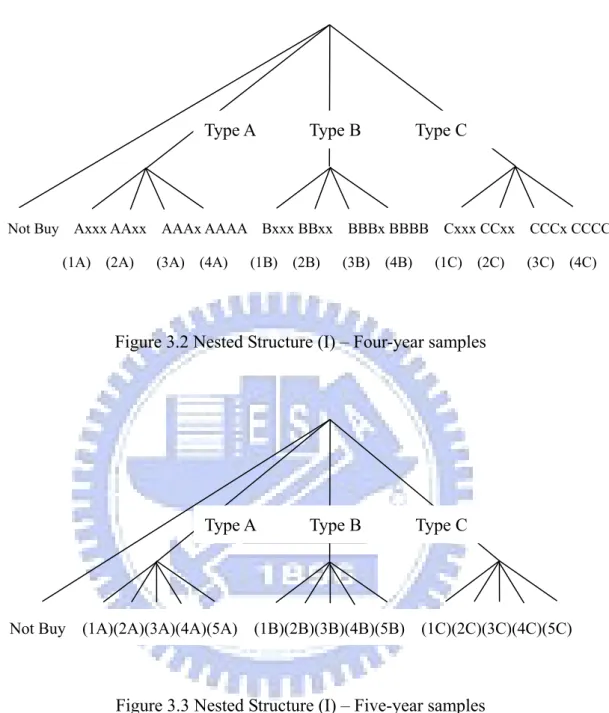
(42) model will lead to erroneous prediction if the assumption of error distributions is violated.. The most widely used relaxation of this undesirable property is the nested logit model (McFadden, 1978; Williams, 1977), which accounts for interdependence between pairs of alternatives in the same nest. Figure 3.1 presents a two-level nested structure with physical damage coverage choice (Types A, B, and C) at the upper level and number of consecutive years (i.e., 1 to 3 years) purchasing the same type of physical damage coverage at the lower level. The structure is applied to the new car owners who purchased insurance at the same company for only three consecutive years. Three elemental alternatives under branch Type A denote the number of consecutive three years purchasing type A coverage. Axx (1A) alternative indicates the case in which new car owners purchase physical damage coverage in the first year and switch to other coverage policies (for example, type B or C) in the following years. In contrast, AAA (3As) alternative represents the case that new car owners purchased type A coverage for three consecutive years.. Figures 3.2 and 3.3 depict the similar hierarchical structure with physical damage coverage choice at the upper level and number of consecutive years at the lower level. The difference is that the two nested structures correspond to the case where the insured purchased insurance for four and five consecutive years, respectively. Consider a two-level nested logit with physical damage coverage choice at the upper level and number of consecutive years at the lower level. The probability that alternative (y, t) is chosen by insured n is expressed as. Pn ( y , t ) = Pn ( y | t ) Pn (t ). (3.4). where the conditional and marginal probabilities in equation 3.4 are:. 32.
(43) ⎛V ⎞ exp ⎜⎜ ytn ⎟⎟ ⎝ μt ⎠ Pn ( y | t ) = ⎛V ′ exp ⎜⎜ y tn ∑ y ′∈ N t ⎝ μt. Pn ( t ) =. (3.5). ⎞ ⎟⎟ ⎠. exp (μ t Γtn ) ∑ exp (μ t ′ Γt ′n ). (3.6). ⎞⎞ ⎟⎟ ⎟ ⎟ ⎠⎠. (3.7). t′. ⎛ ⎛ V y ′tn Γtn = ln ⎜⎜ ∑ exp ⎜⎜ ⎝ μt ⎝ y ′∈ N t. where Pn ( y | t ) is the conditional probability of insured n selecting a number of consecutive years y among choice set N t conditional on choosing coverage type t; Pn (t ) is the marginal probability of insured n choosing coverage type t; Γtn is the logsum variable for insured n choosing coverage type t; μt is the logsum (or inclusive value) parameter for coverage type nest t.. Type A. Not Buy. Type B. Type. Axx. AAx. AAA. Bxx. BBx. BBB. Cxx. CCx. CCC. (1A). (2A). (3A). (1B). (2B). (3B). (1C). (2C). (3C). Figure 3.1 Nested Structure (I) – Three- year samples. 33.
(44) Type A. Type B. Type C. Not Buy Axxx AAxx AAAx AAAA Bxxx BBxx BBBx BBBB Cxxx CCxx CCCx CCCC (1A) (2A). (3A) (4A). (1B) (2B). (3B). (4B). (1C) (2C). (3C) (4C). Figure 3.2 Nested Structure (I) – Four-year samples. Type A. Not Buy. (1A)(2A)(3A)(4A)(5A). Type B. (1B)(2B)(3B)(4B)(5B). Type C. (1C)(2C)(3C)(4C)(5C). Figure 3.3 Nested Structure (I) – Five-year samples. The nested logit model is consistent with utility maximization if the conditions, 0 < μt ≤ 1 , are satisfied for all t. A logsum parameter associated with a nest lies within the range from zero to one, indicating that any pair of utilities in the nest are correlated. If μt is equal to one for all t, the nested logit model collapses to the multinomial logit model.. An alternative choice structure depicted in Figure 3.4 includes the number of consecutive 34.
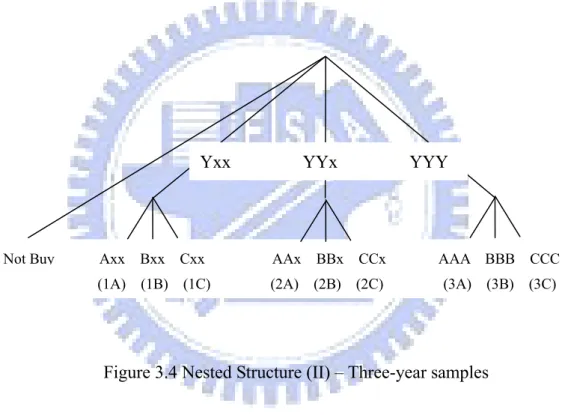
(45) years at the upper level and type choice at the lower level. In this structure, the second branch Yxx, for instance, represents the situation in which new car owners purchase physical damage coverage in the first year (Y corresponds to Type A, B or C) and switch to other coverage policies (symbolized by x) in the following years. Alternative Cxx represents the case that new car owners purchased type C coverage in the first year and switch to other coverage policies in the next two years. Under this branch, three elemental alternatives consist of different coverage types (i.e., type A, B and C). Figures 3.5 and 3.6 illustrate the similar nested structure for the insured purchasing four and five consecutive years, respectively.. Yxx. Not Buy. Axx. Bxx Cxx. (1A) (1B) (1C). YYx. AAx. YYY. BBx CCx. AAA BBB CCC. (2A) (2B) (2C). (3A) (3B) (3C). Figure 3.4 Nested Structure (II) – Three-year samples. 35.
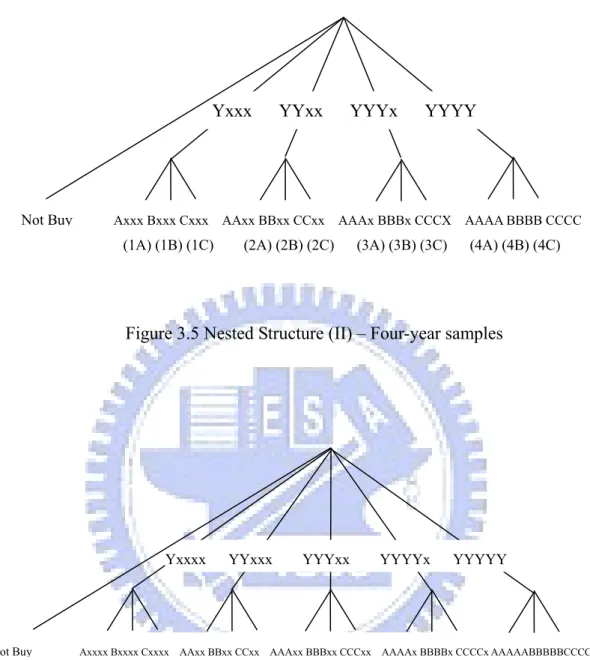
(46) Yxxx. Not Buy. YYxx. YYYx. YYYY. Axxx Bxxx Cxxx AAxx BBxx CCxx AAAx BBBx CCCX AAAA BBBB CCCC. (1A) (1B) (1C). (2A) (2B) (2C). (3A) (3B) (3C). (4A) (4B) (4C). Figure 3.5 Nested Structure (II) – Four-year samples. Yxxxx. Not Buy. YYxxx. YYYxx. YYYYx. YYYYY. Axxxx Bxxxx Cxxxx AAxx BBxx CCxx AAAxx BBBxx CCCxx AAAAx BBBBx CCCCx AAAAABBBBBCCCCC. (1A) (1B) (1C) (2A) (2B) (2C). (3A) (3B) (3C) (4A) (4B) (4C) (5A) (5B) (5C). Figure 3.6 Nested Structure (II) –Five-year samples. 3.4 Paired Combinatorial Logit Model. Although the nested logit model accounts for interdependence between pairs of alternatives in the same grouping, the restriction on the similarity of the alternative pairs in the same nest 36.
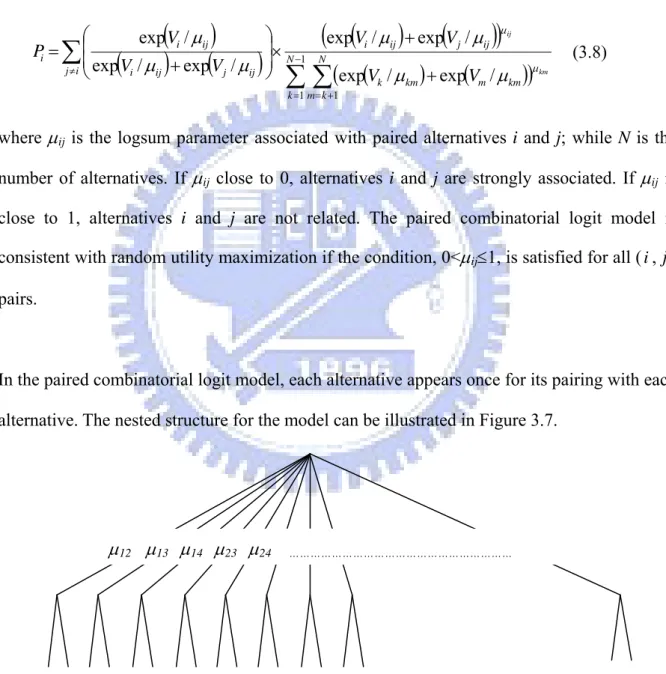
(47) may be unrealistic in some cases. The paired combinatorial logit model enables better representation of substitution patterns among the bundled AIP alternatives. The paired combinatorial logit model has a more flexible error correlation structure than the multinomial logit and nested logit models in that it allows for differential correlation between pairs of alternatives (Koppelman and Wen, 2000). The choice probability of alternative i, a combination (y, t), is given by (for simplification, index n is omitted):. ⎛ ⎞ exp(Vi / μij ) ⎟ × N −1 Pi = ∑ ⎜ ⎜ ⎟ ( ) ( ) + exp V / μ exp V / μ j ≠i ⎝ i ij j ij ⎠ ∑. (exp(V / μ ) + exp(V / μ )) ∑ (exp(V / μ ) + exp(V / μ )) μij. i. ij. j. ij. N. μ km. k =1 m = k +1. k. km. m. (3.8). km. where μij is the logsum parameter associated with paired alternatives i and j; while N is the number of alternatives. If μij close to 0, alternatives i and j are strongly associated. If μij is close to 1, alternatives i and j are not related. The paired combinatorial logit model is consistent with random utility maximization if the condition, 0<μij≤1, is satisfied for all ( i , j ) pairs.. In the paired combinatorial logit model, each alternative appears once for its pairing with each alternative. The nested structure for the model can be illustrated in Figure 3.7.. μ12 μ13 μ14 μ23 μ24. ………………………………………………………. (1A2A)(1A3A)(1A4A)(2A3A)(2A4A)(3A4A)(1B2B)(3B4B)(1C2C) ………………...…….…..……... (3C4C). Figure 3.7 Nested Structure of the Paired Combinatorial Logit Model. 37.
數據
+7


相關文件
(1) 該企業成立於第二次世界大戰前,最早名稱為 Steyr-Daimler-Puch,總部及工廠設於上奧地利邦 Steyr 市,戰後成為奧國最大國產車企業,之後數度 易主及改名,於
( 三 )
汽車業:根據塞國投資及出口促進局數據,塞國製造汽車自 1939 年組 裝軍用卡用開始,自 2000 年以來吸引 70 家重要外資進駐,就業人數 逾 70,000
A.能正確安裝氧乙炔設 備及試漏。.
(1)瞭解各種吊裝機械 之種類(如固定起重 桿 Guyderrick)、搭 式起重機(塔吊 車)、卡吊車(Truck Crane)、履帶式吊車 等。.
(三)綜合機械、
➢ 第49屆全國賽試題方向與規範,將依據國際技能競賽 (WSC)汽車技術(Automobile Technology)之技術規範 (Technical Descriptions)
面臨歐盟日益嚴苛的排放標準與汽車產業如電動車等突破性 科技的發展,為延續該國在汽車產業上的地位,土耳其也開 始布局電動車,於 2018 年由 Anadolu Group、 BMC、 Kök Group、 Turkcell
