Journal ofHea1th Education No.20,pp.29-43.December 2003
Age and Utilization ofPreventive Health
Services among the Elderly in Five Texas Sites
long-Long Guo:
Carole K.
HoI祉1個7.Michele M.
Smith ,·叫*Nell H. Gottlieb
,··
Philip P.
Huan色的*Chiu-h4ieh Huang'....
Abstract
Objectives: This paper explores the relationship between age and the receipt of selected
preventive health services (PHS) among the elderly and determines whether the
implementation of the
“
Put Prevention into Practice" office-based system would increase thedelivery rates of PHS among the elderly. Method: The population consisted of a representative sample of elderly aged 65 years and older who had presented at three specific time points at two community health centers and three family practice residency programs in Texas. Results:
Overall,significant age-related inverse relationships among the elderly were shown in 9 of the
30 time/PHS pairs examined. The delivery rates of pneumococcal immunization and
assessment of tobacco/smoking, physical activity, and nutrition significantly increased from
Associate Professor,CHES,Department ofHealth Education,National Taiwan Normal University
Professor and Coordinator,Department of Kinesiology and Health Education,The University of Texas at Austin
Associate Professor,Department ofKinesiology and Health Education,The University ofTexas at Austin Put Prevention into Practice Project Director,Curriculum& Instruction Department,The University of Texas at Austin
Age and Utilization ofPreventive Health Services among the Elderly in Texas Five Sites
• Assistant Professor, School of Nursing, Chang Gung University (通訊作者: e-mail: 黃久美
time 1 to time 2 for the elderly. Tetanus-Diphtheria immunization was the only service to significantly increase from time 2 to time 3. Discussion: We found that PHS were not universally delivered to all older adults. For those PHS that are recommended for routine use
among older adults, the clinician is required to deliver individualized PHS based on the
patient's risk status. Other services,however,should be systematically provided for high-risk
patients.
Key words: aged,preventive health services,longitudinal study
Introduction
Increased age is associated with a rise in the incidence and mortality of chronic
diseases; 79% persons over 70 repo巾d at least one of seven chronic conditions (National
Center for Health Statistics,1999). Reducing the morbidity experienced by older persons by
increasing the average age of onset of disability and the age of death will greatly increase
quality of life and reduce health care costs (Fries, 1993). This Compression of Morbidity
paradigm has been well suppo此ed through randomized trials of primary prevention (Fries,
1993). Although this paradigm provides a theoretical foundation for delivering preventive
health services (PHS) to the elderly,many health professionals may not think of the elderly
as appropriate targets for health promotion efforts (Lavizzo-Mourey,Day,Diserens & Grisso,
1989; Walker,Volkan,Sechrist & Pender, 1988). Studies indicate that the delivery rates of
PHS show a trend toward an inverse relationship with age after controlling for demographic
and health-related variables among people aged 60 and over (Ives,Lave,Traven, Schulz &
Kuller, 1996; Mayer et祉, 1992). This may indicate that health professionals do not assess
the status of recommended PHS for their elderly clients,especially for the oldest old (aged
85 and over) .
The Texas Department ofHealth (TDH) initiated a demonstration project in 1993 to test the effectiveness of the national Put Prevention into Practice (PPIP) office system change
program. The PPIP program utilizes a set of office tools that targets providers (and staff),
patients,and the office system to increase the provision of PHS in primary care practices
(Goodson, Gottlieb & Smith, 1999; Gottlieb, Huang, Blozis, Guo & Smith, 2001). The
pu中osesof this report are to explore whether there are inverse relationships between age and the receipt of selected PHS among the elderly and to examine PPIP intervention effects for the elderly in the receipt of selected PHS.
Methods
Pre and Post-Intervention Design
The details of methods for the intervention and its evaluation have been published
elsewhere (Goodson et aI., 1999; Gottlieb et aI., 200 I). In 1994, the Texas Department of
Health (TDH) used federal preventive health block grant monies to fund, through a competitive process, three community health centers (CHCs) and four family practice residency (FPR) programs to conduct PPIP implementation. For three years,each site received $42,000-$49,000 per year,free materials and offer of technical assistance from the TDR Two ofthe sites did not show progress in implementation and withdrew from the program at the end
of the second ye-ar. The data reported here are from the five sites that completed the three years of non-competitive continuation funding. All these sites reported use of the flowsheet, the health risk profile (a Texas-designed risk appraisal form to be administered by allied health
staff), and the Personal Health Guide, with one site modifying the health risk profile and another modifying the Personal Health Guide.
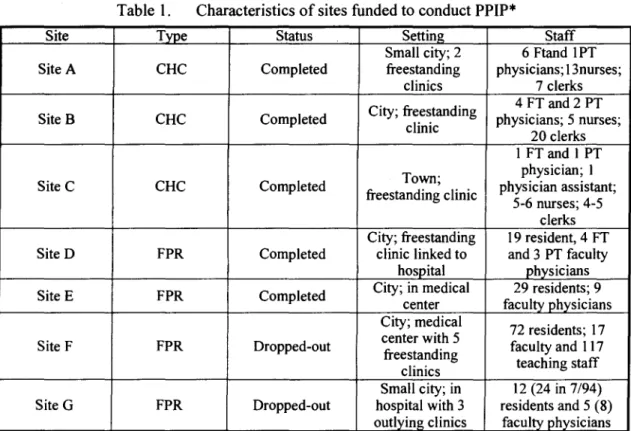
Table I displays the characteristics of the five sites that completed the three years of funding and the two sites that did not. The family practice residency program clinics were
over three times as large as the community health centers and were more often located in large urban areas. The CHCs were much less complex organizations than the FPRs.
Table I. Characteristics of sites funded to conduct PPIP*
Site Type Status Setting Staff Small city; 2 6Ftand IPT SiteA CHC Completed freestanding physicians; 13nurses;
clinics 7 clerks City; freestanding 4 FT and 2 PT Site B CHC Completed physicians; 5 nurses;
clinic
20 clerks I FT and I PT Town; physician; I Site C CHC Completed
freestanding clinic physician assistant; 5-6 nurses; 4-5
clerks City; freestanding 19 resident,4 FT Site D FPR Completed clinic linked to and 3 PT faculty
hospital physicians Site E FPR Completed City; in medical 29 residents; 9
center faculty physicians City; medical
72 residents; 17 center with 5
Site F FPR Dropped-out
freestanding faculty and 117 clinics teaching staff Small city; in 12 (24 in 7/94) Site G FPR Dropped-out hospital with 3 residents and 5 (8)
outlying clinics faculty physicians
*PPIP: Put Prevention into Practice,CHC: community health center; FPR,family practice residency; FT: full-time; PT,part.time
All patient subjects were adults aged 19 years and older. Data were collected using an explicit protocol based on the Battelle Adult Chart Review Form by a single registered nurse
(Hersey, 1995). Charts were selected from actual appointment logs (available for two
community health centers and 1 residency program) or computer printouts of appointments for the equivalent periods. The appointment logs were sampled by taking the patients with
appointments at 8 am, lOam, 2 pm and 4 pm. For sites at which patient ages were
unavailable, charts were over-sampled in order to eliminate children's charts from the
selected pool later. The computerized printouts (one residency and one community health
center) listed patients alphabetically by month and included provider names. In this case,the
sampling list was created by choosing the first patient in each letter group per month. 372
charts were selected at baseline, and 376 charts were selected at 33-39 months following
implementation of PPIP),with 61 % from community health centers at baseline and 60% at
follow-up. A small number (3.2%,n=12) ofpatients were present in both samples.
The present study involved chart review for a representative sample of elderly aged 65 years and older over a three-year period at two community health centers and three family practice residency programs in Texas. The baseline chart audit period was September 1993
through February 1994, Time 1. The official start date of the Texas PPIP Demonstration
Project was April 1994. Time 2 and Time 3 were for patients with appointments during the periods December 1995 through May 1996 and December 1996 through May 1997 respectively in the chart audit processes.
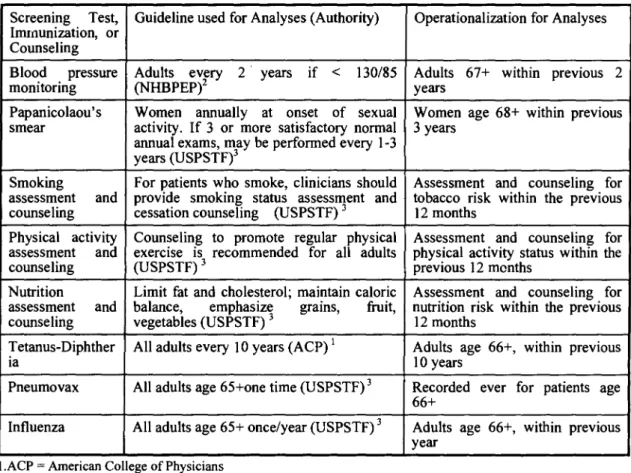
The selected PHS included blood pressure,Papanicoloaou test,mammogram screening,
smoking assessment and counseling, physical activity assessment and counseling, nutrition
assessment and counseling, and tetanus-diphtheria (Td), pneumococcal and influenza
immunization. Assessments referred to providers assessed the patients' smoking, physical
activity and nutrition status. Counseling refeπed to that providers recommended medical
suggestions to patients based on the information from the book entitled
“
Put Prevention intoPractice: clinician's handbook ofpreventive services" (U.S. Department ofHealth & Human
Services,1994) (See Table 2).
Table
2.
Standards for Screening Tests,Immunizations,and Risk Assessment for Elderly PatientsScreening Test, Guideline used for Analyses (Authority) Operationalization for Analyses
ImII1unization, or Counseling
Blood pressure Adults EPeVY它可 2 years if < 130/85 Adults 67+ within previous 2
monitoring (NHBP years
Papanicolaou's Women annuaIly at onset of sexual Women age 68+ within previous
smear aanctniuvaitlye-If3or more satisrfamcetodreyvnormal 3 years
~~~~-~、、3wbe perfo ery lJ
years (USPSTF)
Smoking pFroorvpidaetients who smoke,clinicians should Assessment and counseling for
assessment and smokingli status SaPsSsTesFs)IIlJent and tobacco risk within the previous
counseling cessation counseling (U 12 months
Physical activaintdy Counseling to promote regfourlara plhaydsuiclatsl Ass戶essm戶、nt. and couns戶el出ngm-CIDV且
assessment exercise )IS3 recommended l physical actimviotynthstsatus wi the
counseling (USPSTF previous 12
Nu甘ition Limit fat and cholesterol; maintain caloric Assessment and counseling for
assessment and balance, emphasiz~ grams, 企uit, nu甘ition risk within the previous
counseling vegetabies (USPSTF)3 12 months
Tetanus-Diphther AIladults every 10 years (ACP)1 Adults age 66+, within previous
la 10 years
Pneumovax AIladults age 65+one time (USPSTF)3 Recorded ever for patients age
66+
Influenza AIladults age 65+ once/year (USPSTF)3 Adults age 66+, within previous
year I.ACP=American College of Physicians
2.NHBPEP=National High Blood Pressure Education Program ofthe National Heart,Lung,and Blood Institute 3.USPSTF= U.S. Preventive Services Task Force
Data Analyses
Hierarchical linear analyses (multi-level modeling) were used to take into account the
nested nature of the data (charts within clinics) and the potential for autocorrelation,that is,
the effect of multiple charts coming from the same clinic. The GENMOD function of SAS
version 8.0/PC (SAS Institute Inc., 1999) was appropriate to examine the relationships
between advancing age and delivery rates of selected PHS for the elderly at the three time
points and to evaluate the intervention effects of PPIP. First,age was used as a continuous
variable in logit regression models. Linear relationships were anticipated between advancing age and the reception of timely PHS among elderly adults. The general equation between advancing age and the receipt oftimely PHS among elderly adults is:
log{p /(l-p)} =叫+戶)(age)(elderly adults only) for time I,time2and time 3 (Allison,
1999)
Exponentiating the coefficients of
I3
s in the logit regression models yielded odds ratiosfor the PHS variables. For each PHS
,
odds ratios were also calculated for time 2 vs. time Iand time 3 vs. time 2 after adjusting for the nested structure.
Covariates including patients' gender,reasons for visit (acute condition or check-up or
treatment of a chronic condition), number of clinic visit in the past 12 month and medical
and risk factor history form use) were controlled at the equation mentioned above in order to examine the effects of PPIP intervention and age.
Results
Relationship Between Age and the Delivery Rates of Selected PHS
As shown in Table 3,there were significant inverse relationships between age and the
selected PHS among the elderly on delivery rates for 9 ofthe 30 time/PHS pairs examined. Screening Tests.Because blood pressure (BP) screening was universally delivered to the
elderly subj凹的, there is no variance to be analyzed. When the elderly patients were older,
they were less likely to receive cholesterol screening at time I (odds ratio
=
0.84) and time 3(odds ratio
=
0.92) (Table 3). That is,the increase of one year of age among elderly adultswas associated with a 16% (1-0.84
=
0.16) decrease in the probability of receivingcholesterol screening at time 1. Similarly,a one year increase in age was associated with a
8% (1-0.92
=
0.08) decrease in the possibility of receiving this service among elderlypatients at time 3. However,the age-related inverse relationship between advancing age and
receipt of cholesterol screening was not significant at time 2. The association between advancing age and receipt of the Papanicolaou test was only significant at time 2 (odds ratio
= 0.79). The older the elderly women were, the less likely they were to receive a
Papanicolaou test at time 2 (Table 3). The associations between advancing age and receipt of a yearly mammogram were not significant at any of the three time points.
Life Style Assessments and Counseling. As age increased,elderly adults were less likely to
receive smoking assessment at time 3 (odds ratio
=
0.89) but there were no significantassociations between age and receipt of smoking assessment at times 1 and 2 (Table 3). Also,
elderly adults of increasing age were less likely to receive smoking counseling at time I
(odds ratio = 0.78); there were no significant associations between age and reception of
smoking counseling at times 2 and 3. As age increased, elderly adults were less likely to
receive physical activity assessment at all three time points (Table 3). There was a negative
association between age and physical activity counseling at time 1(odds ratio
=
0.71),butthere were no significant associations between age and reception of physical activity
counseling at times2and3.The older elderly were less likely to receive nutrition assessment
(odds ratio
=
0.94) at time 3 but there were no significant associations between age andreceipt of nutrition assessment at times 1 and 2 (Table 3). No differences were found
between age and nutrition counseling at the three time points.
Immunizations.The negative association between advancing age and reception of Td
immunization at time 2 was the only Age/Td relationship that reached a significant level
(odds ratio
=
0.83)(Table 3). No age-related inverse relationship existed for the delivery ofpueumococal and influenza immunizations.
Table 3. The association between advancing age and delivery rates of selected preventive
health services among elderly patients at time 1,time 2and time3
Time1 n Odds Ratio· (95% C.I.) Time2 P 旦 OddsRatio (95%C.I.) Time3 P 旦 OddsRatio p (95%c.l.) Screening Tests
Papanicolaou test (women only) 37 0.99(0. 呵, 1.03) 0.66 Life Style Assessment and Counseling
Tobacco/ Smoking cessation 68 0.97 (0.90,1.05) 0.57
assessment
Tobacco/ Smoking counseling Physical activity assessment
正 U I AV 、 ay 句3 AV I OO AV J •• 、 句3 ny AV ny 勻, u 句3 AV AV 、‘', p oo ny AV ' 勻3 正 U AV ( ny 司 I AV AY 勻, u
Physical activity counseling
71 0.98 (0.92, 1.04) 0.46 65 0.89 0.94) 68 0.78 (0.73,0.83) <.001 71 0.99 (0.90, 1.09) 0.88 65 0.97 (0.8, 1.09) 0.14 68 0.95 (0.92,0.98) <.01 71 0.92 (0.91,0.94) <.001 65 0.94 (0.91,<.001 0.98) 68 0.71 (0.51,0.99) 0.04 71 0.90 (0.80,1.02) 0.09 65 0.94 1.02) 68 0.97 (0.90, 1.05) 0.36 71 0.95 (0.88, 1.03) 0.29 65 0.94 0.98) 68 0.97 (0.92, 1.03) 0.31 71 0.98 (0.94, 1.02) 0.45 65 0.90 1.01) (0.84,<.001 (0.87,0.11 Nutrition assessment (0.91,<.01 Nutrition counseling (0.80,0.08 Immunizations Tetanus-Diphtheria ImmunizatIOn Pneumococcal immunization 27 1.01 (0.99, 1.03) 0.91 23 0.83 (0.71,0.97) 0.02 21 0.90 (0.80,0.10 1.02) 68 0.97 (0.94, 1.00) 0.07 71 0.99 (0.92, 1.07) 0.80 65 0.97 (0.92,0.29 1.03) 680.95 (0.90,1.01) 0.10 71 0.99 (0.93,1.05) 0.74 65 0.96 (0.91,0.12 1.02) Influenza immunization
Odds ratios area句usted for clinics. This table indicates that a one-age increase in the older adults is associated with the decrease with certain percentage in the receipt of selected PHS
PPIP Intervention Effects
As shown in Table 4, a自er adjusting for the nested nature of data, at time 2 in comparison to time 1,elderly adults were more likely to receive yearly mammography (odds ratio = 2.45,95% C.1. for odds = 1.25-4.80),assessment for tobacco/smoking (odds ratio = 2.66, 95% c.1. for odds = 1.18-6.02), physical activity assessment (odds ratio = 6.34, 95% c.1. for odds = 2.54-15.78), nutrition assessment (odds ratio = 17.96,95% c.1. for odds = 4.89-66.03) and pneumococcal immunization (odds ratio = 2.21, 95% c.1. for odds = 1.02-4.79). The delivery rate of tetanus-diphtheria (Td) immunization for elderly adults was significantly increased from time 2 to time 3 (odds ratio = 3.23, 95% c.1. for odds = 1.35-7.71), while the documentation of the other PHS did not significantly change. Blood pressure (BP) screening was universal: 100% at baseline and time 2. There was only one
elderly subject not documented to receive timely BP screening at time 3 (98.2%,n =51). Table 4. Delivery rates and comparative odds ratios ofsel郎tedpreventive health services
among elderly patients at and between three time points)
Time 1 Time 2 Time 3 Time 2 vs. Time I Time 3 vs. Time 2 %(n2) %(n) %(n) Odds Ratio Odds Ratio
(95% C.l.) (95%c.1.) Screening Tests
NA3
Blood pressure screening 100 100 (65) 98.2 NA (61) (51)
Papanicolaou test (women only) 48.7 55.2 72.4 1.09 (0.22,5.36) 2.44 (0.58,10.18) (37) (29) (29)
Assessments and Counseling Activities
Tobacco/Smoking cessation 45.6 69.0 69.2 2.66(1.18,6.02) 1.02 (0.47,2.23) assessment (68) (71) (65)
Tobacco/Smoking cessation 1.5 7.0 (71) 10.8 4.85 (0.47,49.92) 1.74 (0.45,6.74) counseling (68) (65)
Physical activity assessment 17.6 59.2 53.9 6.34 (2.54,15.78) 0.81 (0.48,1.37) (68) (71) (65)
Physical activity counseling 10.3 18.3 24.6 3.76 (0.47,30.39) 1.45 (0.32,3.37) (68) (71) (65) Nutrition assessment 8.8 56.3 56.9 17.96 (4.89,66.03) 1.06 (0.60,1.88) (68) (71) (65) Nutrition counseling 13.2 32.4 23.1 3.67 (0.72,18.70) 0.71 (0.30,1.69) (68) (71) (65) Immunization Tetanus-Diphtheria 18.5 17.4 47.6 1.01 (0.30,3.39) 3.23(1.35,7.71) (27) (23) (21) Pneumococcus 23.5 36.6 43.1 2.21 (1.02,4.79) 1.40 (0.92,2.11) (68) (71) (65) Influenza 45.6 46.5 46.2 0.94 (0.39,2.27) 1.17 (0.65,2.12) (68) (71) (65)
I. Odds ratios are adjusted for clinics. 2.n=total number of subjects
3.NA: not applicable
Discussion
Systems-level interventions to increase the delivery of preventive services improve the
quality of care of the elderly, as measured by delivery of PHS,as well as the general adult
population (Goodson et aI., 1999; Gottlieb et aI.,2001). Such interventions,which are rarely
used in Medicare managed care populations, have potential to increase preventive care to
this overlooked population (Herman, Speroff & Cebul, 1994; Herman, Speroff & Cebul,
1995). Just as with other populations the increases occurred primarily during the first year of
the program and did not increase significantly thereafter (Dickey & Petitti, 1992; Dietrich,
Sox,Tosteson &Woodru缸~ 1994; Melnikow,Kohatsu & Chan,2000).
Examination of the pattern of differences in the delivery of PHS by age at all time points showed that there were no cases of an increase in delivery of a PHS with age among
elderly patients,although blood pressure was universally measured. Decreases with age were
most prevalent in the assessment and counseling for lifestyle behavior, and least in the
delivery of immunizations.
With respect to screening tests,the decreases in cholesterol and Papanicolaou screening
are consistent with the recommendations ofthe US Preventive Services Task Force,in which
the elderly are not recommended to receive these services as they are unlikely to be of
continued benefit. Although other studies have found decreases in mammography rates with
aging among the elderly (Potosky, Breen, Graubard & Parsons, 1998; The NCI Breast
Cancer Screening Consortium, 1990),we found no difference. The USPSTF guidelines do
not recommend screening after age 70. The rates of mammography among women over 70,
however,were low, consistent with quality care. The universally measured blood pressure
provides an example of what can be accomplished with a functioning system for a
recommended PHS,although it is delivered more frequently than recommended by USPSTF
(U.S. Preventive Services Task Force,1996).
Although the rates for immunizations never reached 50%,this set of PHS showed the
fewest inverse relationships between age and delivery of the service. Both pneumococcal and
influenza immunizations are recommended specifically for the elderly, and providers were
not influenced by the patient's age in their delivery in this study. The rates for
tetanus-diphtheria immunization were (except for time 3) low (under 20%),but only a
age groups,is being given to older patients without regard to age. However,recent US data show the delivery rates of pneumococcal and influenza immunizations to be highest for the
older old(National Center for HealthStatist帥, 1999).
The health care providers were more likely to assess than counsel their elderly patients
on tobacco,physical activity,and nutrition,just as for the general population (McPhee,Bird,
Fordham, Rodnick & Osborn, 1991; Milan, Marcus, Goldstein & Taylor, 1994). An
age-related decrease in services was noted most evidently for physical activity assessment.
Bergman-Evans and Walker reported decreases with age for smoking cessation and physical activity counseling using a nationally representative sample from 1991. Durham and colleagues indicated that the older adults with increasing age were less likely to participate in
a study of utilization of preventive services that included health risk assessment, clinical
screening and health promotion counseling (Durham et aI., 1991). German and colleagues
also reported that the oldest old are less likely to make preventive visits (German et aI.,
1995). The lower participation rate for the older and oldest old may decrease the opportunity to receive lifestyle counseling compared to the young old. Elderly adults represent the most
sedentary segment of the adult population (King,Rejeski& Buchner, 1998),and it has been
reported that the proportion of elderly adults who exercise declines with age (National
Center for Health Statistics, 1994). Prior findings also reveal that activity limitations
increase with age,and the oldest-old are more likely than the young old and older old to be
unable to perform physical activities (National Center for Health Statistics, 1999). These
phenomena may discourage providers from offering physical activity counseling.
For those PHS that are not recommended for routine use among older adults, the
clinician is required to deliver individualized preventive care based on the patient's risk
status (Goldberg & Chavin, 1997). Other services, however, should be systematically
provided for all patients,and office systems,including preauditing of charts (Cardozo et aI.,
1998; Holmboe, Scranton, Sumption & Hawkins, 1998), physician prompts (Balas et aI.,
2000), flow sheets (Herman et aI., 1994), and reminders (Chambers, Balaban, Carlson &
Grasberger, 1991; Chang,Zimmer
weakness was that the study was not designed specifically to examine PHS delivery among
the elderly,and the sample size,particularly for women 's services,may have had insufficient
power to detect small differences (Lipsey, 1990). The major limitation of this study is the
lack of a randomized controlled design, which reduces the possibility to link the results to
the PPIP intervention. Explicitly, a secular trend towards increasing preventive health
services and changes in the case mix of patients, providers, insurance coverage, and
management policies that could account for the findings may have occurred. Thus, our
findings are generalizable only to those Texas health care sites sampled.
From the viewpoint of family practice, great potential exists for the improvement of
health status for the elderly population,who are now living longer. Concern over the health
care cost of this increased longevity will be a new challenge to family physician and public
health workers. Preventive care can serve as a potential solution to cost issues (Fries,Bloch,
Harrington, Richardson & Beck, 1993; Makela, Jokinen, Pyhala, Makela & Ruutu, 1990;
Messonnier, Corso, Teutsch, Haddix & Harris, 1999) and should be intensively pursued to
make increased longevity less costly and less characterized by dysfunction,frailty and low
quality of life.
Acknowledge
This research was supported by a contract from the Texas Department of Health to the
second author. (Reprint requests to Dr. Jong-Long Guo, Department of Health Education,
National Taiwan Normal Universi旬, 162 Sec 1,Hoping E Rd. Taipei,Taiwan)
References:
Allison,P. D. (1999). Logistic regression using the SAS system: Theory and application. Cary,NC: SAS Institute Inc.
Balas,E.A.,S.,W.,Garb, C.T.,Blumenthal,D.,Boren,S. A., & Brown,G. D. (2000). Improving Preventive Care by Prompting Physicians. Archives ofInternal Medicine,160(3),301-308.
Cardozo, L. J.,Steinberg,J.,Lepczyk,M. B.,Binns-Emerick, L.,Cardozo,Y., & Aranha,A. N. (1998). Improving preventive health care in a medical resident practice [see comments]. Archives of InternalMediCi肘, 158(3), 261-264
Chambers, C. Y., Balaban, D. J., Carlson, B. L., & Grasberger, D. M. (1991). The effect of microcomputer-generated reminders on influenza vaccination rates in a university..based family practice center.Journal ofthe
American Board ofFamily Practice,4( I),19-26.
Chang,H.c.,Zimmerman, L.旺,& Beck,J. M.(1995). Impact of chart reminders on smoking cessation practices
of pulmonary physicians.American Journal ofRespiratory&Critical Care Medicine,152(3),984-987.
Dickey, L. L., & Petitti, D. (1992). A patient-held minirecord to promote adult preventive care. The Journal of
Family Practice,34(4),457-463.
Dietrich, A. J., Sox, C. H., Tosteson, T. 眩, & Woodru缸~ C. B. (1994). Durability of improved physician early
detection of cancer after conclusion of interventionsuppo此 CancerEpidemiology,Bioma,如何 & Prevention,
3,335-340.
Durham,M.L., Beresford, S.,Diel汀, P., Grembowski,眩, Hecht,1. A., & Patrick,D. L. (1991). Participation of
higher users in a randomized trial of Medicare reimbursement for preventive services. Gerontologist,31(5),
603-606.
Fries,J. F. (1993). Medical perspectives upon successful aging. In P. B. a. B. Baltes,M. M. (Ed.),Successful Aging
Perspectivesfrom the Behavioral Sciences(413). New York: Cambridge University Press.
Fr悶, J. F., Bloch, D. A., Harrington,旺, Richardson,叭, & Beck, R. (1993). Two-year results of a randomized
controlled trial of a health promotion program in a retiree population: the Bank of America Study [see
comments].American Journal ofMedici,惚,94(5),455-462
German, P. S.,Burton, L. c., Shapiro,鼠,Steinwachs,D. M.,Tsuji, I.,Paglia, M. J., & Damiano, A. M. (1995).
Extended coverage for preventive services for the elderly: response and results in a demonstration population
American Journal ofPublic Health,85(3),379-386.
Goldberg,T.旺,& Chavin,S.I.(1997). Preventive medicine and screening in older adults [see comments].Journal
ofthe American Geriatrics Society,45(3),344-354
Goodson,P.,Gottlieb,N. 旺,& Smith,M. M.(1999). Put prevention into practice: evaluation of program initiation
in nine Texas clinical sites.American Journal ofPreventiveMedici'惚,17(l),73-78.
Gottlieb,N. H.,Huang,P. P.,Blozis,S. A.,Guo,J. L.,& Smith,M. M. (2001). The Impact ofPut Prevention Into
Practice on Selected Clinical Preventive Services in Five Texas Sites.Amerian Journal ofPreventive Medicine,
21(1),35-40.
Herman, C. J., Speroff, T., & Cebul,R. D. (1994). Improving compliance with immunization in the older adult
results of a randomized cohort study [see comments]. Journal of the American Geriatrics Socie紗, 4月 II),
1154-1159.
Herman, C. J., Speroff, T.,& Cebul, R. D. (1995). Improving compliance with breast cancer screening in older
women.Archives ofInternalMedici肘, I刃, 717-722.
Hersey,J. C 叫& aI.,e. (1995). Tools and metrics for evaluation of the "Put Prevention into Practice" program.
Arlington,VA: U. S. Public Health Office of Disease Prevention and Health Promotion.
Holmboe,E.,Scranton,R., Sumption, K.,& Hawkins,R. (1998). Effect of medical record audit and feedback on
residents' compliance with preventive health care guidelines.AcademicMedici肘, 73(8),901-903.
Ives,D. 丘, Lave,J. R.,Traven,N. 眩, Schulz,R.,& Kuller, L. H. (1996). Mammography and pap smear use by
older rural women.Public Health Reports,111(3),244-250.
-
41 一King, A. c., Rejeski, W. J.,&Buchner, D. M. (1998). Physical activity interventions targeting older adults. A critical review and recommendations.American Journal ofPreventiveMedicit紹, 15(4), 316-333.
Lavizzo-Mourey, R., D旬, S. c., Disere肘, D., & Grisso, J. A. (1989). Practicing Prevention for the Elder秒.
Philadelphia,PA: Hanley& Belfus,Inc.
Lipsey,M. W. (1990).Design sensitivity: statistical power for experimental research. Newbury Park,California: Sage Publications.
Makela,P. H.,Jokinen, c.,Pyhala,R.,Makela,M.,& Ruutu,P. (1990). Use of vaccines for respiratory infections. Strategies for influenza and pneumococcal vaccines. Scandinavian Journal of Infectious Diseases -Supplementum,70,141-148.
Mayer, 1. A., Slym凹,D. 1.,Drew,J. A., Wright,B. L.,Elder, 1.P.,& Williams,S. J. (1992). Breast and cervical cancer screening in older women: the San Diego Medicare Preventive Health Project. Preventive Medicine,
21(4),395-404.
McPhee, S. 1., Bird, J. A., Fordham, D., Rodnick,J. E., & Osborn, E. H. (1991). Promoting cancer prevention activities by primary care physicians. Results of a randomized,controlled trial.JAMA,266(4),538-544. Melnikow, J., Kohatsu, N. D., & Chan, B. K. (2000). Put prevention into practice: a controlled evaluation.
AmericanJournal ofPublic Health,90(10),1622-1625.
Messonnier,M. L.,Corso,P. S.,Teutsch,S. M.,Haddix,A.仁, & Harris,J. R. (1999).An ounce of prevention ... what are the returns? Second edition,1999.American Journal ofPreventive Medicine,16(3),248-263. Milan,F., Marcus,底, Goldstein,M.,& Taylor, E. (1994). Training in exercise counseling. Academic Medicine,
69(10),822-823.
National Center for Health Statistics. (1994).1994 National Health Interview Survey,Second Supplement of Aging (between October 1994 and March 1996): Center for Disease Control and Prevention.
National Center for Health Statistics. (1999).Health,United States,1999Health and Aging Chartbook. Hyattsville, Maryland: U.S. Government Printing Office
Potosky, A. L., Breen,N.,Graubard,B. 1.,& Parsons,P. E. (1998). The association between health care coverage and the use of cancer screening tests. Results from the 1992 National Health Interview Survey. Medical Care.
36(3),257-270.
SAS Institute Inc.(1999). SAS OnlineDoc®,Version 8. Cary,NC: SAS Institute Inc.
The NCl Breast Cancer Screening Consortium. (1990). Screening mammography: A missed clinical opportunity?
JournalofAmerican MedicalAssociati帥, 264( I),54-58.
U.S. Preventive Services Task Force. (1996). Guide to Clinical Preventive Services (2nd ed.). Baltimore: Williams
& Wilkins.
U.S. Department of Health & Human Services. (1994). Clinici帥 's Handbook of Preventive Services. (Vol. ISBN No.0-16-043115-8). Washington DC: U. S. Government Printing Office.
Walker, S. N., Volkan,K.,Sechrist, K. R., & Pender, N. 1. (\988). Health-promoting life styles of older adults: comparisons with young and middle-aged adults,correlates and patterns. Ans Advances in Nursing Science, 11(1),76-90.
年齡與預防保健服務利用之關係一以美國德
州五醫院老年門診病患為例
享F畫畫隆、 Nell
H.
Gottlieb 、 CaroleK.
Holahan 、 PhilipP.
Huang 、 MicheleMurphy Smith
、費久失摘要
本研究推估美國德州 IPut Prevention Into PracticeJ 預防保健公共衛生計畫是否應加
老人的預防保健服務量,並探討年齡與接受預防保健服務之關係。以查閱病人病歷為資 料來源,為一為期三年的縱貫性研究,於三所家庭醫學科和兩所社區衛生中心的老年病 患為研究對象。於第一年至第二年間,肺炎和流行性感冒疫苗和吸菸、運動和營養評估 的服務量皆有顯著增加。於第二年和第三年間,破傷風一白喉混合疫苗的服務量則有顯 著增加。所有病患幾乎皆接受定期血壓測量(每兩年至少一次)。此外,在三年間所研 究的 10 項預防保健服務,其中的共有9 次( 9/30) 顯示出老人的年齡與接受的服務量有 顯著的負向關係。研究結果顯示老人仍未全面性的接受預防保健服務,雖然老人並未被 建議必須例行性的接受部分預防保健服務,這些預防保健服務的提供必須因人而異。而 老人被建議接受的預防服務項目,建議醫師應該於門診中例行提供,以促進老年人的身 體健康。本研究經驗可供台灣未來推行預防保健服務之參考。 關鍵詞:老年人、預防保健服務、縱貫性研究 - 43 一