Department of Business Administration
I-Shou University
Master thesis
A Study on the Satisfaction of the Customers in
Hotel Services
Advisor: Dr LIOU, JIN-PIN, Ph.D
Co-advisor: HO SY TAN, Ph.D
Graduate Student: HOANG TUAN VINH
ACKNOWLEDGEMENT
First, I would like to express my sincerely thanks to the teachers of ISHOU University who have equipped me with wide valuable knowledge over time.
I especially thank Dr.Liou Jin Pin, who has guided scientific dissertation, has instructed me practical approach to detect topics and has dedicated instructions to completing this thesis. In particular, I am extremely grateful and thankful to Dr.Liou Jin Pin, and Dr.Ho Sy Tan, who show their interests, coach my learning process, and render guidelines and suggestions in the course of my thesis completion.
Finally, I sincerely thank my family, colleagues, friends and relatives, who have given me enthusiastic support, suggestions and help during my study and research.
ABSTRACT
In recent years, tourism has always significantly contributed to the overall economic growth of An Giang Province. Revenue from tourism business grows year by year. In such development of tourism, the hotel business in An Giang Province has the quite huge contribution. The development of hotel services helps to serve and satisfy the needs of accommodation of tourists during the travel. Currently, tourists are increasingly interested in and have a higher demand for hotel service quality. This thesis is conducted to explore factors influencing customers’ satisfaction toward the hotel services in An Giang. The result shows that responsiveness, trust, reliability and tangibles are the influencing factors.
Keywords: satisfaction, hotel service, responsiveness, trust, reliability, tangibles
TABLE OF CONTENTS
ACKNOWLEDGEMENT ... i
ABSTRACT ... ii
TABLE OF CONTENTS ... iii
LIST OF FIGURES ... v
LIST OF TABLES ... vi
CHAPTER 1 INTRODUCTION ... 1
1.1 REASON TO CHOOSE THE TOPIC ... 1
1.2 RESEARCH OBJECTIVES ... 1
1.3 SCOPE, SUBJECTS OF THE RESEARCH ... 2
1.4 RESEARCH METHODS ... 2
1.5 STRUCTURE OF THE THESIS ... 2
CHAPTER 2 LITERATURE REVIEW ... 3
2.1 OVERVIEW OF AN GIANG PROVINCE, TOURISM INDUSTRY AND OPERATIONAL SITUATION OF AN GIANG TOURIMEX JOINT STOCK COMPANY ... 3
2.1.1 Overview of an giang province ... 3
2.1.2 The operation of tourism industry of an giang province ... 3
2.1.3 An Giang Tourimex Joint Stock Company ... 4
2.2 THEORETICAL FOUNDATION AND RESEARCH MODEL ... 5
2.2.1 The concept and characteristics of the service ... 5
2.2.2 Service quality ... 6
2.2.3 Satisfaction ... 10
2.2.4 Research model of satisfaction ... 11
2.2.5 Some applied researches that use the servqual measurement scale ... 12
CHAPTER 3 RESEARCH METHODS ... 15
3.1 RESEARCH DESIGN ... 15
3.1.1 Qualitative research ... 15
3.1.2 Quantitative research ... 16
3.2 SAMPLE DESIGN... 16
3.3 MEASUREMENT SCALE OF SERVICE QUALITY ... 18
3.4 MEASUREMENT SCALE OF TRUST ... 19
3.5 MEASUREMENT SCALE OF SATISFACTION ... 19
CHAPTER 4 RESEARCH RESULTS ... 20
4.1 DESCRIPTIVE STATISTICS ... 20
4.1.1 Service quality scale ... 20
4.1.2 Credibility scale ... 21
4.1.3 Satisfaction scale ... 22
4.2 SCALE EVALUATION ... 22
4.2.1 Exploratory factor analysis ... 23
4.2.2 Testing the factors by using Cronbach Alpha ... 25
4.3 ADJUSTING THE RESEARCH MODEL ... 26
4.4 TESTING THE RESEARCH MODEL OF THE SATISFACTION ... 28
4.4.1 Correlation analysis(Pearson coefficient) ... 28
4.4.2 Regression analysis ... 30
4.4.3 Variance analysis (ANOVA) ... 34
4.4.4 Testing hypotheses of the model ... 35
4.5 SUMMARY ... 36
CHAPTER 5 CONCLUSIONS & RECOMMENDATIONS ... 38
5.1 ABOUT TRUST ... 38
5.2 ABOUT RESPONSIVENESS ... 39
5.3 ABOUT RELIABILITY ... 40
5.4 ABOUT TANGIBLES ... 41
5.5 ABOUT AGE GROUP AND NATIONALITY ... 43
5.6 CONCLUSION ... 44
REFERENCES ... 48
APPENDIX ... 50
LIST OF FIGURES
Figure 2.1 Proposed research model ... 18 Figure 4.1: Adjusted research model ... 28
LIST OF TABLES
Table 3.1: Research sample design ... 16
Table 3.2: Sample information ... 17
Table 4.1: Results of descriptive statisticsof service quality ... 21
Table 4.2: Results of descriptive statisticsof the credibility ... 21
Table 4.3: Results of descriptive statisticsof the satisfaction ... 22
Table 4.4: The correlation coefficient matrix ... 29
Table 4.5: Summary of the model ... 31
Table 4.6: Statistical coefficient of each variable in the regression equation ... 32
CHAPTER 1
INTRODUCTION
1.1 REASON TO CHOOSE THE TOPIC
Tourism is now considered as one of the leading service sectors thathas high growth rate and attracts many nations to join because of the huge benefits in terms of economy and society offered by this sector. Thanks to its enormous contribution, tourism has become a key economic sector for many countries around the world.
In recent years, tourism has always significantly contributed to the overall economic growth of An Giang Province. Revenue from tourism business grows year by year.
In such development of tourism, the hotel business in An Giang Province has the quite huge contribution. The development of hotel services helps to serve and satisfy the needs of accommodation of tourists during the travel. Currently, tourists are increasingly interested in and have a higher demand for hotel service quality. For enterprises, the quality of services in general, especially food service quality in particular, is regarded as a tool to attract customers, which increases the competitiveness and improves the business efficiency. In the context of growing competition for hotel services with different ranks, in order to improve and meet the increasing demand of travelers, thenit is needful to pay attention to the quality of hotel services.However, the issue of service quality still has limitations in terms of perception and actual situation. Through the actual investigation, it shows objective and subjective reasons that make the hotel services do not fully meet the requirements of tourists. The issuehere is the need for research to find solutions to further improve the hotel service quality. Starting from the above objective reasons, the topic
“Research the satisfaction of the customers in the hotel services” is very necessary.
It has important significance in terms of both theory and practice for hotel services. This research was conducted in An Giang Province in general and at An Giang Tourimex Joint Stock Company in particular.
1.2 RESEARCH OBJECTIVES
• Evaluation of the customer satisfaction regarding the hotel services of An 1
Giang Tourimex Joint Stock Company
• Identification of the factors that affect the customer satisfactionregarding the hotel services of An Giang Tourimex Joint Stock Company
• Proposal of the orientations for the solutions to improve the hotel service quality of An Giang Tourimex Joint Stock Company
1.3 SCOPE, SUBJECTS OF THE RESEARCH
It is to research the operating activities in three main hotels of An Giang Tourimex Joint Stock Company in the area of An Giang Province in August 2015. They are Dong Xuyen Hotel, Long Xuyen Hotel (located in Long Xuyen City) and Ben Da Nui Sam Hotel (Chau Do Town).
Subjects of the research are visitors and tourists who used the services at the three hotels Dong Xuyen, Long Xuyen and Ben Da Nui Sam in August 2015.
1.4 RESEARCH METHODS
Qualitative research and quantitative research are used to evaluate the customer satisfaction. Qualitative research explores, adjusts and supplements the measurement scalesof service quality, trust scale and satisfaction scale. Quantitative research testsscale model and theoretical modelregarding service quality, satisfaction regarding servicequality.
1.5 STRUCTURE OF THE THESIS
Chapter 1: Introduction
Chapter 2: Theoretical foundation Chapter 3: Research methods Chapter 4: Research results
Chapter 5: Conclusion & Recommendation
CHAPTER 2
LITERATURE REVIEW
2.1 OVERVIEW OF AN GIANG PROVINCE, TOURISM INDUSTRY AND OPERATIONAL SITUATION OF AN GIANG TOURIMEX JOINT STOCK COMPANY
2.1.1 Overview of an giang province
An Giang Province is an agricultural province of the Mekong Delta.It shares border with Dong Thap Province in the East, Kien Giang Province in the West, Can Tho Province in the South and the Kingdom of Cambodia in the North. An Giang has 11 administrative divisions, which include nine districts: Chau Thanh, Chau Phu, Thoai Son, Tinh Bien, Tri Ton, Cho Moi, Phu Tan, Tan Chau, An Phu, Chau Doc Town and Long Xuyen City. It has an area of 3,406 square kilometers and a population of over 2.1 million people.Its land borderswith the Kingdom of Cambodia is 97 km in lengthwith twointernational border gatesof Tinh Bien (road), Vinh Xuong (waterway) and Khanh Binh national border gate (both road and waterway). Economic strength is the agriculture with two key productsthat are rice and fish (shark catfish, basa). The Province has the potential for tourism development thanks to favorable natural conditions with the system of historic and culturalmonuments, beauty spots, mountainous area, border are and national festival of Via Ba Ceremony.
2.1.2 The operation of tourism industry of an giang province
Together with favorable natural conditions, An Giang Province has been early forming natural tourist attractions in various types of cultural tourism, ecotourism, belief tourism, resort, etc. The important tourist attractions whichhave the conditions to grow are SamMountain (Chau Doc), Cam Mountain and Tra Su Cajuput Forest(Tinh Bien), Sap Mountain andthe Oc Eoarchaeological site (Thoai Son),Tuc Dup Hill (Tri Ton), My Hoa Hung tourist site (Long Xuyen), Bung Binh Thien tourist site (An Phu) and the border economic areas.
Annually, the large numbers of tourists who visit attractions in An Giang Province mainly take visit to Ba Chua Xu Temple in Sam Mountain, Chau Doc in the
form of religious and spiritual tourism. Moreover, they combineto visit othermain spots of the Province. In addition to the favorable conditions in terms of nature, culture, history, borderetc.then until now,the tourism products of An Giang Province are almost nothing. Especially, the servicesystem to serve thetravelersare very limited (hotels, hostels, dining, etc.).
2.1.3 An Giang Tourimex Joint Stock Company
Previously, An Giang Tourimex Joint Stock Company was a State-owned enterprise that operated in the area of trade and tourism. By implementing the policy of the Government, in October 2005, the company was officially transformed from State enterprise into Joint Stock Company.
The operational structure of joint stock companyincludes the Board of Directors, General Director and three functionaldepartments which are HR Department, Accounting and Finance Department, Import and Export Department with total managers and employees of 350 people.
Activities regarding tourism of the company include the operations of the tourism establishments: Dong Xuyen Hotel, Long Xuyen Hotel, Ben Da Nui Sam tourist site, Tuc Dup Hill tourist site, travel servicecenter and An Hai Son tourist site (Kien Giang). The total number of guest rooms is 200 rooms (167 rooms in An GiangProvince). Of which, business operations of three hotels Dong Xuyen, Long Xuyen and Ben Da Nui Sam in An Giang Province are the main activities of the company in tourism. Revenue accounts for 70.1% of tourism general revenue and accounts for 100% of the total visitors in An Giang(2014).
Activities regarding tourism of the company include the operations of the tourism establishments: Dong Xuyen Hotel, Long Xuyen Hotel, Ben Da Nui Sam tourist site, Tuc Dup Hill tourist site, travel servicecenter and An Hai Son tourist site (Kien Giang). The total number of guest rooms is 200 rooms (167 rooms in An GiangProvince). Of which, business operations of three hotels Dong Xuyen, Long Xuyen and Ben Da Nui Sam in An Giang Province are the main activities of the
company in tourism. Revenue accounts for 70.1% of tourism general revenue and accounts for 100% of the total visitors in An Giang(2014).
Dong Xuyen Hotel (58 guest rooms) faces with three facades. One facade faces Nguyen Hue A Street and the other two facades face Luong Van Cu Street and Nguyen Van Cung Street, respectively. It is located in the heart of Long Xuyen City, which is very convenient for hotel business. The hotel has the advantage of being one of the 3-star hotels in An Giang Province, which are located in the heart of Long Xuyen City, a very convenient location.
Long Xuyen Hotel (37 guest rooms), located right on the corner lot of Luong Van Cu and Nguyen Van Cung in the the heart of Long Xuyen City, that is very convenient for the hotel business. This is a 2-star hotel located in a very favorable location.
Ben Da Nui Sam Hotel (72 guest rooms), located on National Highway 91, not far from the Ba Chua Xu Temple, Sam Mountain in Chau Doc. The hotel has a beautiful, spacious and airy location, that is great for the hotel business, to host the travelers to visit Ba Chua Xu annually. This is a 2-star hotel.
2.2 THEORETICAL FOUNDATION AND RESEARCH MODEL 2.2.1 The concept and characteristics of the service
Currently, there are many definitions of service given out, and according to the researchers, it could be understood as follows:
“Service is an activity or series of activities; it has more or less the intangible nature, but not necessarily. It presents in the interactions between customers and service personnel and/or material resources or commodities and/or the service delivery system in the form of solutions to solve the issues of the customers” (Gronroos, 1990, adapted from Paul Lawrence Miner, 1998).
“Service is a process that consists of back office activities and front office activities, where customers and service providers interact with each other. The purpose of this interaction is to satisfy the needs and wants of customers by the way customers expect, as well as to create values for customers” (Bui Nguyen Hung, 2004)
Service has a number of characteristics, but three characteristics often cited in the literature include Intangibility, Heterogeneity and Inseparability.
Intangibility
Shostack (1977, adapted from Paul Lawrence Miner, 1998) assumed that there is no thing/event, which is merely a product, or service and he said that there is a continuous progression between the tangible product and intangible service.
A.Parasuraman, Valarie A. Zeithaml and Leonard L. Berry (1985) also suggested that the intangibility means “Most services cannot be measured, counted, tested and certified before providing to ensure service quality”.
Heterogeneity
Service will be performed differently in different types. For example, services that are provided in tourism are different from the one provided for the library.
Inseparability
Services production and consumption occur simultaneously and the interaction between the provider and recipient of the services may affect the service quality.
2.2.2 Service quality
2.2.2.1 Definition
Currently, there are many different definitions of service quality. However, in general, the definition of service quality is what the customers perceive. Each customer will have different perception as well as needs. Thus, their perception of the service quality is also different.
According to Joseph Juran & Frank Gryna, “quality is the conformity to demands”.
According to Armand Feigenbaum, “quality is the customer decision, which replies on practical experience of the product or service. It is measured on the ground of customer requirements, which may be specified or not, be conscious or be simply felt, be entirely subjective or be professional in nature. In addition, it always represents the moving target in a competitive market”.
According American Society for Quality, “Quality shows the superiority of goods and services, especially to the extent of satisfying all the needs and customer satisfaction”.
According to Peter Senge et al., “quality is a transition in a manner in which wethink and work together, we assess and give in the way we measure success. All of us work together to design and operate value-added system together with quality testing, customer services, process improvement and good relationships with suppliers and good relationship with community that we are serving and within the community in which we operate at an optimum level for a common purpose”.
2.2.2.2 Types of service quality gap
On the ground of interview results of the management group and customer group on the service quality, A.Parasunaman, Valarie A. Zeithaml & Leonard L. Berry (1985) presented the general service quality model with five gaps to measure the service quality.
GAP 1: It is the gap between the customer expectation and the perception of the manager. The research results show that, managers do not always understand the customer perception of service quality, necessary factors to satisfy the demands of customers as well as the implementation level to get the qualified service. The bad understanding of these could affect the judgment about the quality of customers.
GAP 2: The gap between the perception of managers and what is interpreted into the criteria for service quality. This gap exists because managers can understand the customers’ expectation. However, sometimes, managers cannot get that information to make appropriate service criteria. For example, managers want food to be served at the table within 10 minutes after the customers order food (as fast as possible). Nevertheless, they also know that customers want their food in just 5 minutes. This means that managers have realized what customers want, but sometimes cannot meet.
GAP 3: It is the gap between the criteria for service quality and the provision of service. When managers realize the customers’ expectation, they design the service standards to meet customers’ requirements (regulation of the time for customer service as fast as expected by the customers). However, in the implementation process, the employees do not comply with the proposed standards. Poor skills or employees’ unwillingness to provide service dedicatedly create this gap.
GAP 4: It is the gap between providing serviceand information to the outside (to the customers). Advertising on public media and other relationships of enterprise may affect customers’ expectations. If expectationplays an important role in the assessment on the quality of customer service, then the enterprises should make sure notto make big promise onadvertisement because it generates a high expectation from customers. Information to the outside can not only affect the expectations of customers, but also get the judgmentsof customersabout service received.
GAP 5: It is the gap between the expected service (expectation) and perceived service (perception). It seems that the low and high rating for the service quality depends on the judgment of the customersabout the actual service performance and customers’ expectations about services. The service quality that a customerperceivesis a function of the width and the magnitude of the gap between expected service and perceived service.
2.2.2.3 Service quality model
The results from interviews with group of managers and customer groups are considered as the foundation for a brief model regarding nature and factors that influence theservice quality judged by the customers. The foundation of this model is a sequence of gaps that are discussed above and shown in Figure 1.1. Service qualityjudged by the customers depends on the size and direction of GAP 5. Service quality model can be described as follows:
GAP 5 = f (GAP 1, GAP 2, GAP 3, GAP 4)
Gap model in service quality concept is one of the models that is well received for its 8
contribution and has best value in the literature on services (Brown and Bond, 1995, adapted from Arsah Shahin).
2.2.2.4 Evaluation of the service quality
According to Bui Nguyen Hung and Vo Khanh Toan (2005), currently, there are many tools to measure service quality; nevertheless, there are two common models, which are used to evaluate the quality of services. Firstly,the model ofGronroos (1984b) suggested that service quality is evaluated on two aspects: (1) the technical quality and (2) functional quality. Secondly,the model Parasuraman et al. (1985) which service quality is evaluated on the ground of fivegaps. However, perhaps, the model of Parasuraman et al. is more commonly used thanks to the materiality, detail and evaluation tools that aretested and updated by authors and colleagues.
According to Danuta A. Nitecki (1997), among the most popular tools for quality assessment of service quality is the service quality scale (SERVQUAL) of Parasuraman et al. He introduced the SERVQUAL 5 gap scale and measurement measured service quality by the calculation of the heterogeneity between expectation and perception of the customers. A marketing research group, which includes Berry, Parasuraman and Zeithaml, designed this tool. Through many qualitative researches, they developed a measurement set that includes five factors. Customers evaluate them as the most significantfactors for the quality of services, no matter what service sectors. They are:
• Tangibles: It is the appearance of the facilities, equipment, human resources, instruments, and communication materials.
• Reliability: It is the ability to perform services accurately and reliably.
• Responsiveness: It is the willingness to help customers and provide services quickly.
• Assurance: It is the knowledge and politeness of staffs and the ability to create confidence and trust of staffs to customers.
• Empathy:It is the general and individual concern about each customer.
SERQUAL measurement scale helps service providers clearly understand the customers’ expectations and customers’ reviews for specific types of services, as well as the improvement in service quality over time. Measurement scale also helps to orient specific service factorsthat should be improved and opportunities for training and retraining staffs. Being analyzed at the level of detail, the data provided through the application of the measurement scale has very high practical significance for service managers in measuring customer satisfaction.
Being developed in 1988, the SERQUAL measurement scale has consistently been used in research on many service sectors such as health care, banking, equipment repair and other professional sectors.
2.2.3 Satisfaction
Satisfaction is a feeling state of a person starting from the comparison of results obtained from the product/service with the expectations of that person (Kotler, 2001).
On the ground of perception of service quality, satisfaction can be divided into three levels:
- Not satisfied: when a customer’s perception is less than their expectation - Satisfied: when the customer’s perception is equal to their expectation
- Very satisfied: when the customer’s perception is greater than their expectation Perception of the service qualityis a result of the gap between expected serviceand perceived service. In addition, satisfaction is also a comparison of these two values. When the gap between expected service and perceived service is narrowed to zero, it shall be considered as customer satisfaction.
Service quality is the cause (origin) creating customer satisfaction. At present, there is no consensus among researchers about the concept, nevertheless, most researchers believe that there is a relationship between service quality and customer satisfaction (Cronin and Taylor, 1992; Spereng, 1996; adapted from Bui Nguyen Hung and Vo Khanh Toan, 2005).
Satisfaction is a function of expectation, perception together with the gap 10
between the perception and expectation (Oliver, 1980, adapted from King, 2000). Zeithaml and Bitner (2000) suggested that the service pricingcouldinfluence significantly the perception of service quality, satisfaction and value (adapted from Bui Nguyen Hung and Vo Khanh Toan, 2005). Moreover, Bui Nguyen Hung and Vo Khanh Toan haveadded it into the research model of customer satisfaction (apart from fivefactors of service quality measurement scale SERVQUAL) in the topic “Service quality of water metersinstallation in Ho Chi Minh City and some solutions”.
In addition, the trust is a factor that has significant correlation with satisfaction. Guido Mollering surveyed itin the customer – provider relationship in the British printing industry. Customers assume thatthey shall be more satisfied when the provider is more reliable (Guido Mollering, 2003). To measure the trust, Guido Mollering presented the measurement scale, whichconsists of two parts. They are Perceived trustworthiness with 10 variables and Actual trust with 01 variable.
According to Nguyen Phuong Hung (2001),customer satisfaction is also influenced by other factors such as product characteristics, situational factor and personal characteristics.
There are very few researches, which have focused on examining the explanation degree of the components of service quality for customer satisfaction, especially in specific service sector (Lassar et al. 2000, adapted from Bui Nguyen Hung and Vo Khanh Toan, 2005).
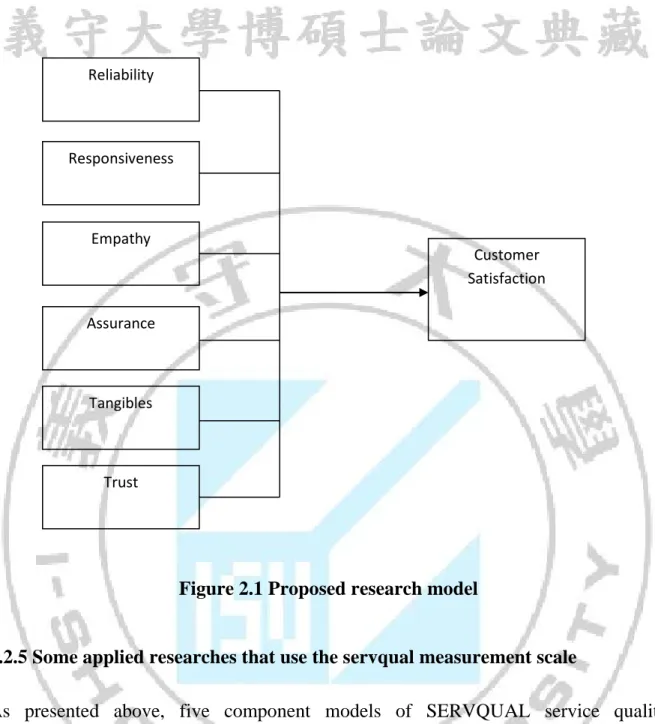
2.2.4 Research model of satisfaction
In this topic, the model of Parasuraman et al. (1985), with five components of service quality measurement scale: Tangibles, Reliability, Responsiveness, Assurance andEmpathy, is used to measure the customer satisfaction with service quality in hotel.
Moreover, Trust is considered as a factor that has significant correlation with satisfaction, which examined by Guido Mollering for the customer – provider relationship in the British printing industry (Guido Mollering, 2003). Therefore, the research model of this topic, in addition to five components of service quality, proposes toadd the Trust factor in the model (Figure 2.4).
Figure 2.1 Proposed research model
2.2.5 Some applied researches that use the servqual measurement scale
As presented above, five component models of SERVQUAL service quality measurement scale of Parasuraman et al. has been widely used by researchers around the world (Asubonteng et al.,1996; Buttle, 1996; Robinson, 1999, adapted from Bui Nguyen Hung and Vo Khanh Toan, 2005) in the research for sectors: Car tyre retail service (Carman, 1990), Hotel (Saleh and Ryan, 1992), Tourism and travel (Fick and Ritchie, 1991), Warranty service for automobiles (Bouman and van der Wiele, 1992), Information services (Pitt et al. 1995), High quality education (Ford et al. 1993; McElwee and Redman, 1993), Hospital (Johns, 1993), Audit (Freeman and Dart, 1993), Aviation (Frost and Kumar, 2000), Provision of food for the passengers in the
Reliability Responsiveness Empathy Assurance Tangibles Trust Customer Satisfaction 12
aviation sector (Bakus et al., 1993a), Local government (Brysland and Curry, 2001; Wisniewski 2001; Scott and Shieff, 1993).
According to Bui Nguyen Hung and Vo Khanh Toan (2005), the test results of the researches show that:
- Service quality is not stable in the components of servicequality; it is changed in accordance with the context, type of services. Service quality in different markets will be different.
- The reliability is limited due to the use of the gap scores to evaluate the service quality.
Domestically, this research model has been applied specifically by researchers in measuringcertain types of service quality, namely:
Bui Nguyen Hung and Vo Khanh Toan (2005) conducted the research topic “Service quality of water meters installation in Ho Chi Minh City and some solutions”,using the measurement scale of five components of Parasuraman et al. and pricing measurement scaleto measure the customer satisfaction for the service qualityof installation of water meters in Ho Chi Minh City.
Research results have confirmed the statements of previous researchers, who assume that the components of servicequality are unstable and dependent on the field of research.Measuring latent variables by many observed variables will increase the value and reliability of the measurement.Different service sectors will have different characteristics, so the adjustment of some conceptsin measurement scales to suit each sector and each research market is necessary.The components of service quality have different interpretation level for customer satisfaction. Meanwhile, the customer satisfaction is explained by many different factors beyond the quality of services.Pricing is a very sensitive factor with the customer and has significant influence on the customer satisfaction. The pricing contributesto research model on the customer satisfaction for service quality.
Nguyen Thanh Long (2006) used the SERVPERF scale (variant from 13
SERVQUAL) to do research on training quality of An Giang University. The research results show that five original components of the SERVPERF scale are rearranged into five components: Lecturer, staff, facility (tangible facility), trust, empathy. All these above fivecomponents have positive relationship with student satisfaction and have differences in satisfaction of students form different faculties and different academic year.
CHAPTER 3 RESEARCH METHODS
3.1 RESEARCH DESIGN
The research is performed in two steps: Qualitative (preliminary) and quantitative (formal).
3.1.1 Qualitative research
It is used to discover, adjust and supplement the measurement scales, which uses technical exchange, direct discussion with the customer and manager. Its questionnaire has 22 initial sections of servicequality scale and 11 original variablesof credibility scale to measure customer satisfaction (3 variables). Initial questions are designed in the form of open questions to gather additional relevant variables from customers and experts.
Performing this step is to explore new observed variables to add to the research model as well as to eliminate the unsuitable variables for the culture, types of services,aiming at creating appropriate questionnaire for official research.
The subjectsof the discussions and interviews are customers,who used the hotel service of the company, and experts, managers in this field. The purpose is to determine what customers expect from hotel services, which factors make them feel comfortable when using hotel services. Moreover, it also learnshow well managers understand their customers and which factors make customerssatisfy under the perspective of managers, experts.
This step is conducted through direct interviews with 30 customers, who are using the serviceof the hotel, and the key managers of the hotel. Replying on that foundation, the questionnaire is corrected for suitability.
3.1.2 Quantitative research
It tests the measurement scale and theoretical model.The research is implemented after the adjustment of questionnaire in qualitative research by words that are clear and easy to understand, in addition to the supplement and elimination of the unsuitable variables. The questionnaires were sent to customers who used the hotel services of An Giang Tourimex Joint Stock Company. The obtained data is processed by SPSS 13.0 Software, through the following analyses:
• Descriptive statistics
• Evaluation of measurement scale of concepts • Adjustment of the research model
• Inspection of the conformity of the model by correlation analysis, multiple regression, analysis of variance (ANOVA)
• Testing of hypotheses
• Proposal for service quality improvement
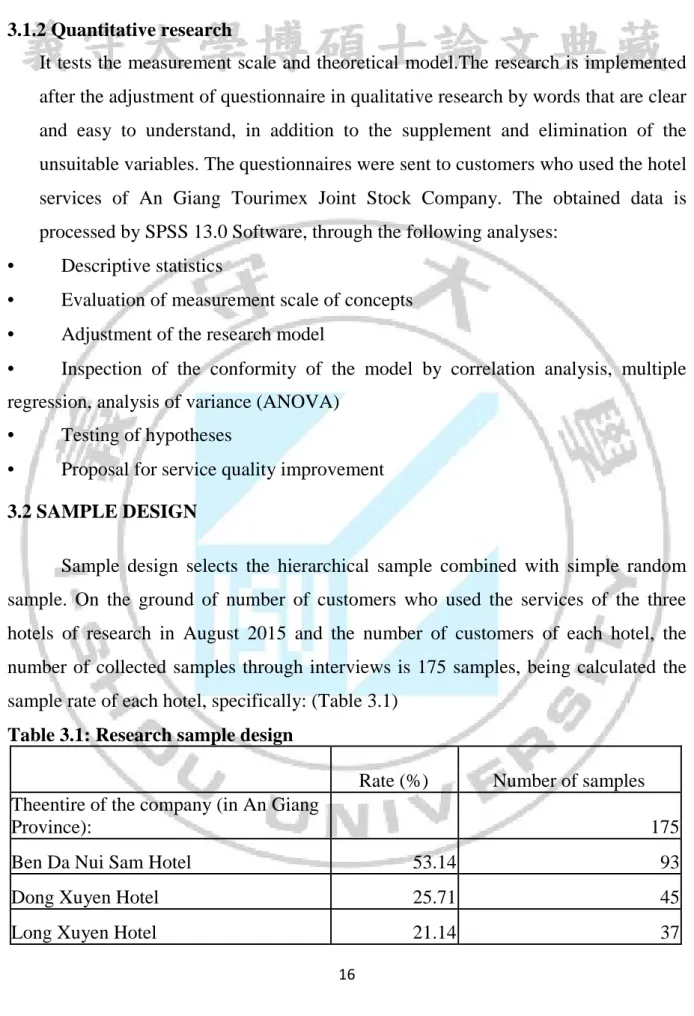
3.2 SAMPLE DESIGN
Sample design selects the hierarchical sample combined with simple random sample. On the ground of number of customers who used the services of the three hotels of research in August 2015 and the number of customers of each hotel, the number of collected samples through interviews is 175 samples, being calculated the sample rate of each hotel, specifically: (Table 3.1)
Table 3.1: Research sample design
Rate (%) Number of samples
Theentire of the company (in An Giang
Province): 175
Ben Da Nui Sam Hotel 53.14 93
Dong Xuyen Hotel 25.71 45
Long Xuyen Hotel 21.14 37
On that basis, random customers who used and have used hotel services in August 2015 were selected to send questionnaires with adjusted questions. Together with 26 questions, the sample size of 175 is good enough for factor analysis. Normally, at least the sample size must be more than four or five times the number of variables in factor analysis (Hoang Trong and Chu Nguyen Mong Ngoc, 2005)
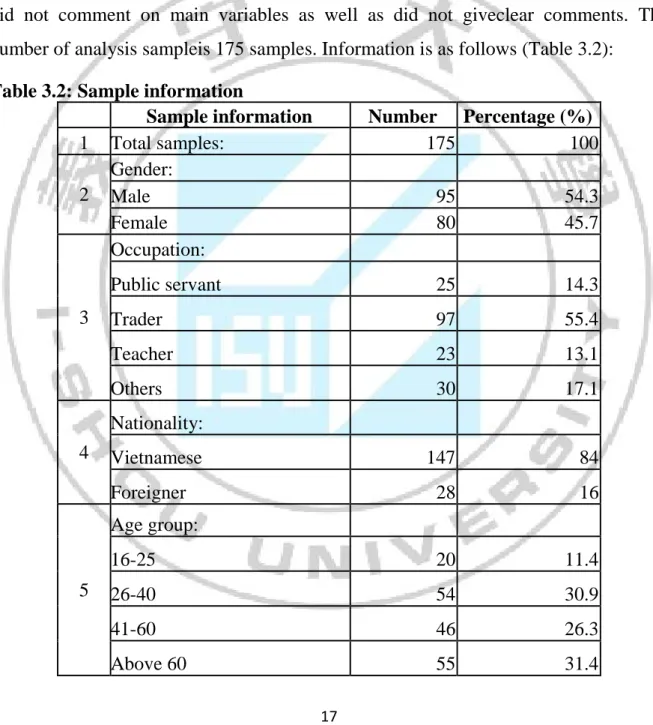
With total 200 samples sent to customers, 184 questionnaires were collected (92%).Of which,nine samples were considered invalid because they had omission and did not comment on main variables as well as did not giveclear comments. The number of analysis sampleis 175 samples. Information is as follows (Table 3.2):
Table 3.2: Sample information
Sample information Number Percentage (%)
1 Total samples: 175 100 2 Gender: Male 95 54.3 Female 80 45.7 3 Occupation: Public servant 25 14.3 Trader 97 55.4 Teacher 23 13.1 Others 30 17.1 4 Nationality: Vietnamese 147 84 Foreigner 28 16 5 Age group: 16-25 20 11.4 26-40 54 30.9 41-60 46 26.3 Above 60 55 31.4 17
3.3 MEASUREMENT SCALE OF SERVICE QUALITY
SERVQUAL measurement scale of service quality with 22sections question showsfive components: (1)Trust, (2) Responsiveness, (3) Assurance, (4) Empathy, (5) Tangibles.After the qualitative research, through the discussion with the customers and managers, some variables are removed and some new variables are added to fit the type of hotel services, which are perceived by the customers and managers. Results of official questionnaires of service quality scaleto perform quantitative research is formed and arranged in chronological order, from check-intime to check-out time.They are shown as follows:
1 Staffs welcome customers at the time they step into the hotel. 2 Hotel is always willing to help the customers.
3 Procedures at the reception desk are done quickly.
4 Hotel quickly responds the information that the valued customers ask for. 5 Hotel shows the interest in customers in a friendly manner.
6 Hotel focuses on meeting the customers requirements.
7 Hotel handles the situations in the most convenient way for customers.
8 The staffs have good professional knowledge, meeting the customers’
requirements.
9 The staffs show the politeness, graciousness to the valued customers. 10 The valued customers feel assured when staying in this hotel.
11 The dress of the staff is neat and elegant.
12 The hotel facilities are fit for the star-standard of the hotel.
13 The layout of the hotel facilities meets the customers’ requirements. 14 Hotel creates the tranquility for the resting of the customers.
15 The reception hall is airy, clean and convenient. 16 Hotel’s services meet the star-standard of the hotel. 17 Hotel handles the operation quickly, professionally.
18 Hotel clearly and convincingly explains the relevant issues. 19 Food & drink in the hotel assure the food safety.
Service quality uses 5-point Likert measurement scale to measure, including 1. Totally disagree, 2. Disagree, 3. Acceptable, 4. Agree, 5. Totally agree.
3.4 MEASUREMENT SCALE OF TRUST
Being similar to measurement scale of service quality, measurement scale of Trust has 11 original sections of question. After discussing with the customers, the managers, many unsuitable variables with hotel services have been removed and some new variables are added accordingly. After adjustment, results of questionnaire of measurement scale of Trust are presented as follows:
1 Hotel rate is reasonable.
2 Hotel’s servicesare better than you think. 3 Customers had known this hotel.
4 You trust the serving quality of the hotel.
Trust also uses the 5-point Likert measurement scale to measure, including 1. Totally disagree, 2. Disagree, 3. Acceptable, 4. Agree, 5. Totally agree.
3.5 MEASUREMENT SCALE OF SATISFACTION
After the adjustment, measurement scale of the customer satisfaction is shown as follows:
1. General satisfaction of the customers on service quality 2. The level of responses to the customers’ requirements 3. Serving manner of the hotel
The customer satisfaction also uses the 5-point Likert measurement scale to measure, including 1. Very dissatisfied, 2. Dissatisfied, 3. Acceptable, 4. Satisfied, 5. Very satisfied.
CHAPTER 4 RESEARCH RESULTS
4.1 DESCRIPTIVE STATISTICS 4.1.1 Service quality scale
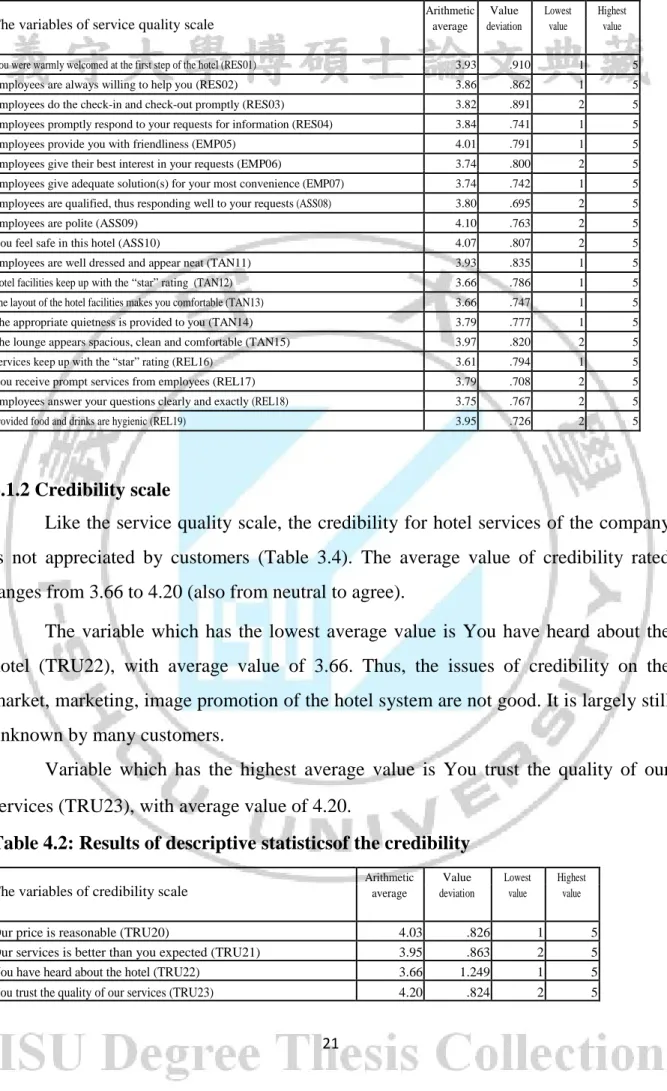
The statistical table for results (Table 4.1) with 19 variables to measure customer satisfaction with service quality, and the usage of 5 point Likert scale to evaluate it show that customers were not completely satisfied with the hotel service quality of An Giang Tourimex. The average score ranges from 3.61 to 4.10 (i.e. from neutral to agree). This is reasonable because in fact customers had complaints, and customers’ perspectives are different that are demonstrated all levels from strongly disagree to strongly agree in the same question section.
Three lowest rated contents by customers are Services keep up with the “star” rating (REL16), with average value of 3.61; Physical facilities keep up with the “star” rating (TAN12), with average value of 3.66; the layout of hotel facilities makes you comfortable (TAN13), with average value of 3.66.
This corresponds with customer complaints in the process of gathering their opinions: the hotel facilities are old; lack of high speed Internet connection as well as Wi-Fi; TV has few channels without English channels; hot uncomfortable elevator (Dong Xuyen Hotel), lack of elevator (Long Xuyen Hotel); sound proofing system is not good; hotel room supplies are insufficient...
Three highest rated contents by customers are Employees provides you with friendliness (EMP05), with average value of 4.01; you feel safe in the hotel (ASS10), with average value of 4.07;Employees are polite (ASS09) with average value of 4.10. This also corresponds to the praise from customers for the security, the friendliness and courtesy of staffs…
Table 4.1: Results of descriptive statisticsof service quality
The variables of service quality scale
Arithmetic Value Lowest Highest average deviation value value
You were warmly welcomed at the first step of the hotel (RES01) 3.93 .910 1 5 Employees are always willing to help you (RES02) 3.86 .862 1 5 Employees do the check-in and check-out promptly (RES03) 3.82 .891 2 5 Employees promptly respond to your requests for information (RES04) 3.84 .741 1 5 Employees provide you with friendliness (EMP05) 4.01 .791 1 5 Employees give their best interest in your requests (EMP06) 3.74 .800 2 5 Employees give adequate solution(s) for your most convenience (EMP07) 3.74 .742 1 5 Employees are qualified, thus responding well to your requests (ASS08) 3.80 .695 2 5
Employees are polite (ASS09) 4.10 .763 2 5
You feel safe in this hotel (ASS10) 4.07 .807 2 5
Employees are well dressed and appear neat (TAN11) 3.93 .835 1 5 Hotel facilities keep up with the “star” rating (TAN12) 3.66 .786 1 5 The layout of the hotel facilities makes you comfortable (TAN13) 3.66 .747 1 5 The appropriate quietness is provided to you (TAN14) 3.79 .777 1 5 The lounge appears spacious, clean and comfortable (TAN15) 3.97 .820 2 5 Services keep up with the “star” rating (REL16) 3.61 .794 1 5 You receive prompt services from employees (REL17) 3.79 .708 2 5 Employees answer your questions clearly and exactly (REL18) 3.75 .767 2 5 Provided food and drinks are hygienic (REL19) 3.95 .726 2 5
4.1.2 Credibility scale
Like the service quality scale, the credibility for hotel services of the company is not appreciated by customers (Table 3.4). The average value of credibility rated ranges from 3.66 to 4.20 (also from neutral to agree).
The variable which has the lowest average value is You have heard about the hotel (TRU22), with average value of 3.66. Thus, the issues of credibility on the market, marketing, image promotion of the hotel system are not good. It is largely still unknown by many customers.
Variable which has the highest average value is You trust the quality of our services (TRU23), with average value of 4.20.
Table 4.2: Results of descriptive statisticsof the credibility
The variables of credibility scale
Arithmetic Value Lowest Highest average deviation value value
Our price is reasonable (TRU20) 4.03 .826 1 5
Our services is better than you expected (TRU21) 3.95 .863 2 5 You have heard about the hotel (TRU22) 3.66 1.249 1 5 You trust the quality of our services (TRU23) 4.20 .824 2 5
4.1.3 Satisfaction scale
Like the two previous scales, satisfaction scale is also rated as not completely satisfied by customers (Table 4.3), with the lowest average value of 3.88 and highest value of 4.07 (from neutral to agree).
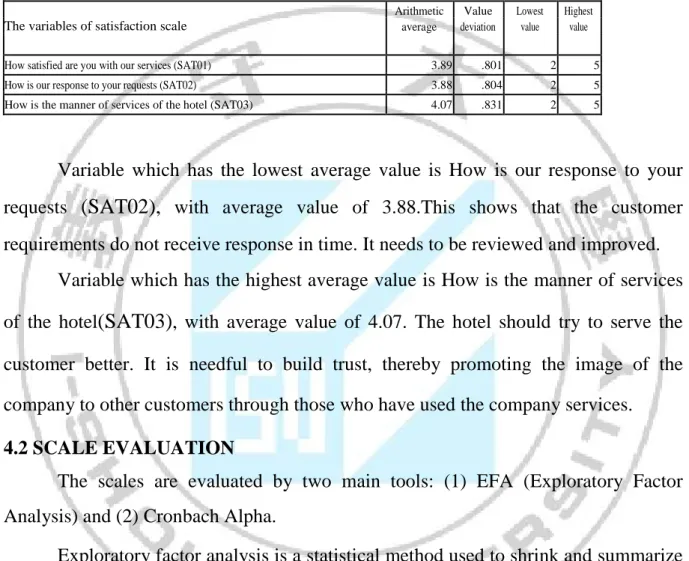
Table 4.3: Results of descriptive statisticsof the satisfaction
The variables of satisfaction scale
Arithmetic Value Lowest Highest average deviation value value
How satisfied are you with our services (SAT01) 3.89 .801 2 5 How is our response to your requests (SAT02) 3.88 .804 2 5 How is the manner of services of the hotel (SAT03) 4.07 .831 2 5
Variable which has the lowest average value is How is our response to your requests
(SAT02),
with average value of 3.88.This shows that the customer requirements do not receive response in time. It needs to be reviewed and improved.Variable which has the highest average value is How is the manner of services of the hotel
(SAT03)
, with average value of 4.07. The hotel should try to serve the customer better. It is needful to build trust, thereby promoting the image of the company to other customers through those who have used the company services.4.2 SCALE EVALUATION
The scales are evaluated by two main tools: (1) EFA (Exploratory Factor Analysis) and (2) Cronbach Alpha.
Exploratory factor analysis is a statistical method used to shrink and summarize data (technique to reduce data). This is an interdependence technique, in which all the interdependence relation will be researched. Exploratory factor analysis is commonly used in the process of creating a scale to measure different aspects of the research concept, and to check the individual aspect status of the scale.
Testing by using Cronbach Alpha in order to verify this scale with many variables to have a good scale for each factor being researched (measuring whether a set of question sections drawn from each factor has connection or not). Cronbach
Alpha is a statistical test in terms of the level of closeness that questions in the scale interrelated with each other. In other words, it shows us that if a certain scale is good in a certain aspect or not.
To avoid omitting variables, the sequence to evaluate scale is as follows: firstly, all five components of service quality scale: Reliability, Responsiveness, Assurance, Empathy and Tangibles with 19 variables put into exploratory factor analysis to identify the factors. After performing the EFA with 19 variables, each factor is identified and evaluated in terms of the reliability by using Cronbach Alpha.
Like the service quality scale, the credibility scale with four question sections and the satisfaction scale with three question sections are also performed EFA and evaluated the reliability by using Cronbach Alpha.
4.2.1 Exploratory factor analysis
Exploratory factor analysis is performed with 19 variables of the service quality scale. Exploratory factor analysis is considered appropriate when the value of KMO (Kaiser–Meyer–Olkin) is greater than 0.5. Factor loading less than 0.5 will be removed, cut off pointwhen eigenvalue is greater than 1 and total variance explained is greater than 50% (Hoang Trong and Chu Nguyen Mong Ngoc, 2005). The chosen analytical method is Principal components with varimax rotation. They are performed as follows:
Analyzing the set of 19 observed variables, the obtained result is as follows (Appendix 1): KMO = 0.857, sig.= 0.000 of Bartlett’s test. Therefore, the variables are closely correlated with one or more factors and the overall correlative matrix is a rejected unit matrix according to the results of Bartlett’s test, satisfying the conditions of exploratory factor analysis.
Five factors were extracted with the variance explained of 60.656% (explained the variability of 60.656%). Two variables RES03 and EMP07 that have factor loading less than 0.5 will be deleted.
Continuing to reanalyze the factors with 17 variables (RES03 and EMP07), the result is (Appendix 2) as follows: KMO = 0.841, sig.= 0.000 of Bartlett’s test. This satisfies the conditions of exploratory factor analysis. Four factors are drawn with the
variance explained of 57.479%.
The variables with factor loading are located in two different factors like EMP05 of factor 1, 2 and TAN11 of factor 2, factor 3, it shows that the correlation of these variables and those two factors are not definitive. After performing the factor rotation, variable which has large coefficients of a factor proves that it correlates primarily with the same factor. Thus, it belongs to that factor (Hoang Trong and Chu Nguyen Mong Ngoc, 2005). Variable EMP05 belongs to factor 1 and variable TAN11 belongs to factor 2. After performing exploratory factor analysis with 17 variables above, four factors have been drawn:
+ Factor 1 includes 5 following variables:
You were warmly welcomed at the first step of the hotel (RES01)
Employees are always willing to help you (RES02)
Employees provides you with friendliness (EMP05)
Employees promptly respond to your requests for information (RES04)
You receive prompt services from our employees (REL17)
+
Factor 2 includes 5 following variables:
You feel safe in the hotel (ASS10)
Our employees are polite (ASS09)
The lounge appears spacious, clean and comfortable (TAN15)
Our employees are well dressed and appear neat (TAN11)
Provided food and drinks are hygienic (REL19)
+
Factor 3 includes 3 following variables:
Physical facilities keep up with the “star” rating (TAN12) The layout of hotel facilities makes you comfortable(TAN13)
Our services keep up with the “star” rating(REL16) + Factor 4 includes 4 following variables:
Our employees are qualified, thus responding well to your requests (ASS08)
The appropriate quietness is provided to you (TAN14)
Our services keep up with the “star” rating (EMP06)
Our employees answer your questions clearly and exactly (REL18)
Like the service quality, the credibility with 4 variables is also analyzed, the result is (Appendix 3) as follows: KMO = 0.657, sig.= 0.000 of Bartlett’s test. This satisfies the conditions of exploratory factor analysis. A factor is drawn with the variance explained of 51.342%, in which variable TRU22 which has factor loading less than 0.5 will be deleted.
Continuing to reanalyze the factor of credibility with 3 variables (TRU22), the result is (Appendix 4) as follows: KMO = 0,.643, sig.= 0. of Bartlett’s test, with variance explained of 64.721%. This satisfies the conditions of exploratory factor analysis.
The factor of credibility (TRU) includes 3 following variables:
Our services is better than you expected (TRU21)
You trust the quality of our services (TRU23)
Our price is reasonable (TRU20)
In addition, the satisfaction is also be analyzed, the result is (Appendix 5) as follows: KMO = 0.751, sig.= 0.000 of Bartlett’s test. This satisfies the conditions of exploratory factor analysis. A factor is drawn with the variance explained of 82.470%. Therefore, the factor satisfaction (SAT) incudes 3 variables:
How satisfied are you with our services (SAT01)
How is our response to your requests (SAT02)
How is the manner of services of the hotel (SAT03)
4.2.2 Testing the factors by using Cronbach Alpha
After performing the exploratory factor analysis, the factors have been drawn. Testing the factors by using Cronbach Alpha for each factor in order to measure it a set of questions drawn from each factor has connection or not. Many researchers agreed that when the Cronbach Alpha has value of 0.6 or higher, then it can be used. The value of corrected Item – Total correlation must be greater than 0.3 (Hoang Trong and Chu Nguyen Mong Ngoc, 2005).
The Cronbach Alpha of factor 1 (Appendix 6) has value of 0.801; all 5 variables have the value of Corrected Item-Total Correlation greater than 0.3, satisfying the conditions of the test.
The Cronbach Alpha of remaining factors is as follows: 0.731 for factor 2 with 5 variables; 0.724 for factor 3 with 3 variables; 0.648 for factor 4 with 4 variables. All the variables of factor above have the value of corrected Item – Total correlation greater than 0.3, satisfying the conditions of the test. After performing the exploratory factor analysis for the service quality scale, four factors have been drawn and each was tested by Cronbach Alpha, satisfying the conditions for further analysis.
The credibility is also tested by Cronbach Alpha. The value of Cronbach Alpha is 0.726. All 3 variables in the factor of credibility have the value of corrected Item – Total correlation greater than 0.3, satisfying the conditions for further analysis.
The satisfaction with 3 variables is tested by Cronbach Alpha. The value of Cronbach Alpha is 0.894, the value of corrected Item – Total correlation is greater than 0.3, satisfying the conditions for further analysis.
4.3 ADJUSTING THE RESEARCH MODEL
The above analytical results demonstrate that after performing factor analysis of original 05 factors (components) of the service quality scale, there are 01 factor which has distinct-values is empathy and 04 factors has no distinct-values. They are as below:
+ Factor 1: the Responsiveness (RES) with 05 variables: You were warmly welcomed at the first step of the hotel (RES01); Employees are always willing to help you (RES02); Employees promptly respond to your requests for information (RES04); Employees provides you with friendliness(EMP05); You receive prompt services from our employees (REL17).
+ Factor 2: the assurance (ASS) with 05 variables: Our employees are polite (ASS09); You feel safe in the hotel(ASS10); Staffs have succinct and polite uniform Our employees are well dressed and appear neat (TAN11); The lounge appears spacious, clean and comfortable(TAN15); Provided food and drinks are hygienic (REL19).
+ Factor 3: the tangibles (TAN) with 03 variables: Physical facilities keep up with the “star” rating (TAN12); The layout of hotel facilities makes you comfortable(TAN13); Our services keep up with the “star” rating(REL16).
+ Factor 4: the reliability with 04 variables: Our services keep up with the “star” rating (EMP06); Our employees are qualified, thus responding well to your requests (ASS08); The appropriate quietness is provided to you(TAN14); Our employees answer your questions clearly and exactly (REL18).
The SERVQUAL service quality scale in applying to measure the hotel service quality of An Giang Tourimexhas been changed and adjusted certainly in content. It means that questionnaire is changed and there is an adjustment between factors to form the 04 factors as mentioned. This result reinforces the conclusion of Babakus and Boller (1992) and Cronun and Taylor (1992) that “factors of the service quality could be changed according to the sector or field of research” (Bui Nguyen Hung and Vo Khanh Toan, 2005)
The factor of empathy could be existed theoretically. However, when being applied in An Giang Tourimex, it does not get the clear distinction (it seems almost the same), and does not become a distinct factor. Therefore, it is removed.
After performing factor analysis, the factor of credibility (TRU) with one component is drawn with 03 variables: Room rate is reasonable(TRU20); Our services are better than you expected (TRU21); You trust the quality of our services (TRU23). After performing factor analysis, the factor of satisfaction (SAT) with one component is drawn with 3 variables: How satisfied are you with our services (SAT01); How is our response to your requests(SAT02); How is the manner of services of the hotel (SAT03).
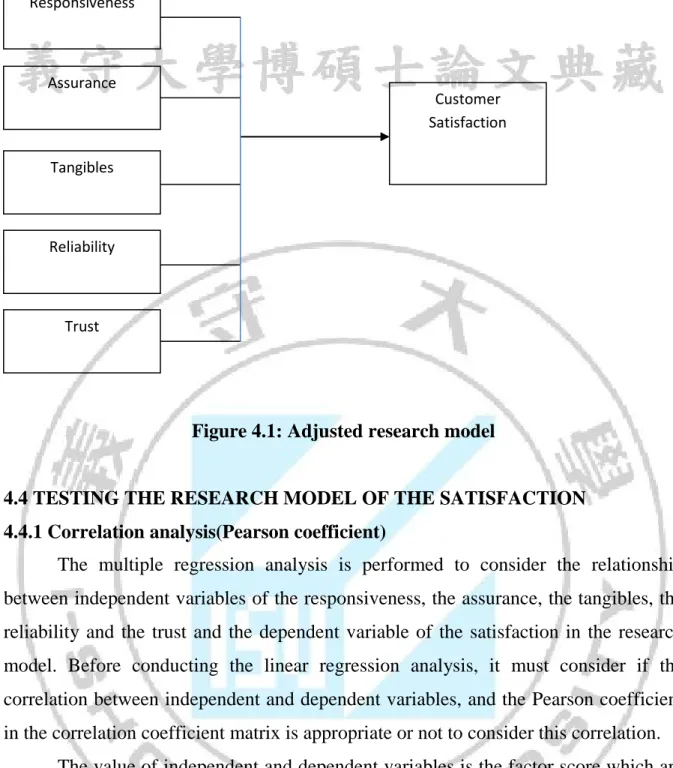
Thus, after the factor analysis, the original research model is adjusted with some hypotheses as follows (Figure 3.2):
H1: The increase in the responsiveness will increase the satisfaction level. H2: The increase in the assurance will increase the satisfaction level. H3: The increase in the tangibles will increase the satisfaction level. H4: The increase in the reliability will increase the satisfaction level. H5: The increase in the trust will increase the satisfaction level.
Figure 4.1: Adjusted research model
4.4 TESTING THE RESEARCH MODEL OF THE SATISFACTION 4.4.1 Correlation analysis(Pearson coefficient)
The multiple regression analysis is performed to consider the relationship between independent variables of the responsiveness, the assurance, the tangibles, the reliability and the trust and the dependent variable of the satisfaction in the research model. Before conducting the linear regression analysis, it must consider if the correlation between independent and dependent variables, and the Pearson coefficient in the correlation coefficient matrix is appropriate or not to consider this correlation.
The value of independent and dependent variables is the factor score which are calculated by the SPSS through factors analysis. It is linear combinations of the observed variables in the standardized service quality scale. The independent variables of responsiveness, the assurance, the tangibles and the reliability are not correlated to each other (Table 4.4) because they are factors estimated through process of factor analysis (Hoang Trong and Chu Nguyen Mong Ngoc, 2005).
Particularly, although the independent variable of the credibility is the standardized factor score calculated by SPSS through factor analysis, it is not an
Responsiveness Assurance Tangibles Reliability Trust Customer Satisfaction 28
estimated factor in the process of factor analysis of the service quality scale. Therefore, it has a certain correlation to the rest of independent variables (factors of the service quality scale) of the model. This needs further consideration about the multicollinearity phenomenon when putting into a regression analysis with independent variables of service quality factors.
Table 4.4: The correlation coefficient matrix
Responsiven ess
Assuranc
e Tangibles
Reliabil
ity Trust Satisfaction
Responsivenes s Correlation coefficient 1 Level of significance (two-tailed) Assurance Correlation coefficient .000 1 Level of significance (two-tailed) 1.000 Tangibles Correlation coefficient .000 .000 1 Level of significance (two-tailed) 1.000 1.000 Reliability Correlation coefficient .000 .000 .000 1 Level of significance (two-tailed) 1.000 1.000 1.000 Trust Correlation coefficient .383** .303** .275** .230** 1 Level of significance (two-tailed) .000 .000 .000 .002 Satisfaction Correlation coefficient .451** .202** .258** .238** .672** 1 Level of .000 .007 .001 .001 .000 29
significance (two-tailed)
** Significant correlation 0.01 (two-tailed)
Dependent variables of the satisfaction is correlated with each independent variable (Table 4.4) which is demonstrated through the correlative coefficient as follows: the responsiveness (0.451), the assurance (0.202), the tangibles (0.258), the reliability (0.238), the trust (0.672) are performed two-tailed test with the statistical significance of 1%. In general, we can conclude that these independent variables can be applied in the model to explain dependent variable of the satisfaction.
4.4.2 Regression analysis
The multiple regression analyzing is performed to review the effect of each independent variable: the responsiveness, the assurance, the tangibles, the reliability and the trust on the satisfaction of customers (dependent variable).
The model of multiple linear regression expresses the satisfaction as below: Satisfaction = B0 + B1 * trust + B2 * responsiveness + B3 * assurance
+ B4 * reliability + B5 * tangibles.
Of which, B1, B2, B3, B4, and B5 are partial regression coefficients.
The trust, the responsiveness, the assurance, the tangibles and the reliability are independent variables and the satisfaction is dependent variable.
The regression analysis is implemented by the method of stepwise selection. This method just in turn adds one independent variable to the model. Independent variables which have the strongest positive or negative correlation with the dependent variable will be applied to the equation firstly. If the variable does not meet the conditions, the process will be stopped and there will be no more independent variables in the equation. If it meets the input conditions, the next (second) independent variable will be added in. It will be the one which explains the most the changing level of the dependent variable in combination with the first variable. The analysis is just kept going on like that. After putting the first variable, the computer will consider if to delete it or not according to the exit standard. In the next step, variables which are not in the equation will be considered to input. After each step,
variables in the equation will be considered again to delete. Variables will be removed until there will be no more variables which can achieve the entry and exit standard. (Hoang Trong and Chu Nguyen Mong Ngoc, 2005; Loan Le, 2000).
The result of the regression analysis by the Stepwise according to the entry standard with PIN=0.05 and the exit standard with POUT=0.10 shows that:
Independent variable of the assurance does not meet the entry standards then be removed from the research model. Four remaining variables which are the responsiveness, the tangibles, the reliability and the trust are qualified and are put into the model to be considered.
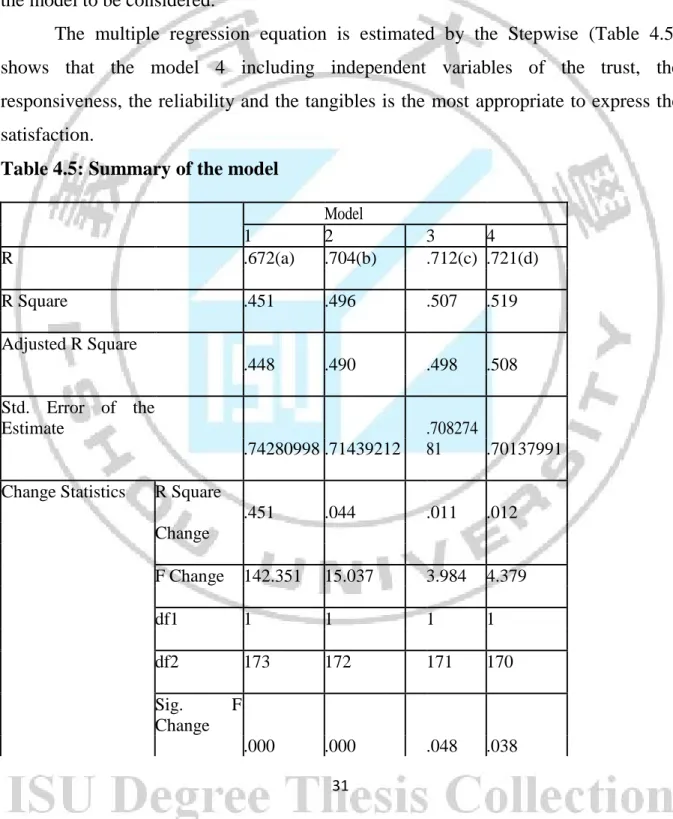
The multiple regression equation is estimated by the Stepwise (Table 4.5) shows that the model 4 including independent variables of the trust, the responsiveness, the reliability and the tangibles is the most appropriate to express the satisfaction.
Table 4.5: Summary of the model
Model 1 2 3 4 R .672(a) .704(b) .712(c) .721(d) R Square .451 .496 .507 .519 Adjusted R Square .448 .490 .498 .508 Std. Error of the Estimate .74280998 .71439212 .708274 81 .70137991
Change Statistics R Square
.451 .044 .011 .012 Change F Change 142.351 15.037 3.984 4.379 df1 1 1 1 1 df2 173 172 171 170 Sig. F Change .000 .000 .048 .038 31
32
(a) Independent variable: Trust
(b) Independent variable: Trust, Responsiveness
(c) Independent variable: Trust, Responsiveness, Reliability
(d) Independent variable: Trust, Responsiveness, Reliability, Tangibles (e) Dependent variable: Satisfaction
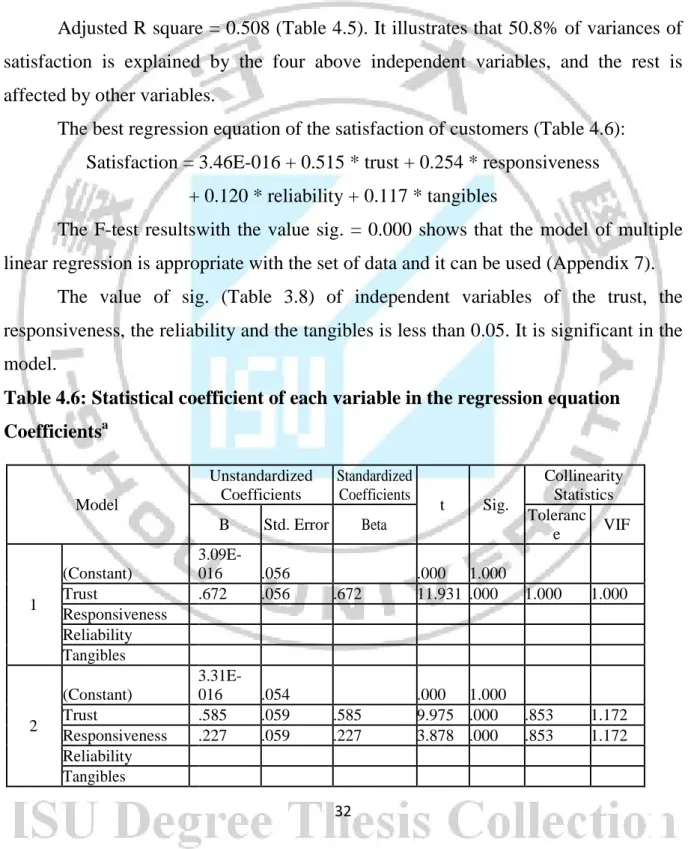
Adjusted R square = 0.508 (Table 4.5). It illustrates that 50.8% of variances of satisfaction is explained by the four above independent variables, and the rest is affected by other variables.
The best regression equation of the satisfaction of customers (Table 4.6): Satisfaction = 3.46E-016 + 0.515 * trust + 0.254 * responsiveness
+ 0.120 * reliability + 0.117 * tangibles
The F-test resultswith the value sig. = 0.000 shows that the model of multiple linear regression is appropriate with the set of data and it can be used (Appendix 7).
The value of sig. (Table 3.8) of independent variables of the trust, the responsiveness, the reliability and the tangibles is less than 0.05. It is significant in the model.
Table 4.6: Statistical coefficient of each variable in the regression equation Coefficientsa Model Unstandardized Coefficients Standardized Coefficients t Sig. Collinearity Statistics
B Std. Error Beta Toleranc
e VIF 1 (Constant) 3.09E-016 .056 .000 1.000 Trust .672 .056 .672 11.931 .000 1.000 1.000 Responsiveness Reliability Tangibles 2 (Constant) 3.31E-016 .054 .000 1.000 Trust .585 .059 .585 9.975 .000 .853 1.172 Responsiveness .227 .059 .227 3.878 .000 .853 1.172 Reliability Tangibles
3 (Constant) 3.39E-016 .054 .000 1.000 Trust .555 .060 .555 9.247 .000 .800 1.249 Responsiveness .239 .058 .239 4.088 .000 .845 1.183 Reliability .111 .055 .111 1.996 .048 .938 1.066 Tangibles 4 (Constant) 3.46E-016 .053 .000 1.000 Trust .515 .062 .515 8.243 .000 .725 1.380 Responsiveness .254 .058 .254 4.359 .000 .832 1.202 Reliability .120 .055 .120 2.177 .031 .932 1.073 Tangibles .117 .056 .117 2.092 .038 .906 1.104
a. Dependent Variable: Satisfaction
The result of the regression model testing (Table 4.6) demonstrates that there is no multicollinearity phenomenon because the variance inflation factors – VIF of variables in the model are very low, from 1.0 to 1.38 and less than 10 (Hoang Trong and Chu Nguyen Mong Ngoc, 2005).
Checking whether the variance of error is unchanged which is infringed or not by correlative testing Spearman with the hypothesis Ho is: the ranking correlation coefficient of overall is 0. The regression equation has lots of explained variables then the ranking correlation coefficient could be calculated between the absolute value of the residual and each separate variable.
The inspection result shows that (appendix 8): value sig. of variables of the credibility, the responsiveness and the tangibles have the absolute value of the residual in order are 0.755, 0.856, 0.332 and 0.041. This means that we cannot reject the hypothesis Ho, meaning the variance of error is unchanged. Thus, the linear regression model above could be used (Hoang Trong and Chu Nguyen Mong Ngoc, 2005).
Inspecting the dispersed chart of the standardized residual and the standardized predicted value shows that the residual distributes randomly and does not form any specific shape (appendix 9). So, the linear association and equal variance are satisfied.
Checking the chart of frequencies (appendix 10) shows that the residual distribution is normal approximate (in average mean=0 and the standard deviation Std. Dev.=0.988 is closing to 1). Thus, we can conclude that the standard distribution hypothesis is not infringed.
Therefore, the regression equation is performed as above is appropriate. The factor of trust with the regression coefficient of 0.515 is the most influential factor to the satisfaction of customers. Following factors that have influence levels on the satisfaction of customers such as the responsiveness with the regression coefficient of 0.254, the reliability with the regression coefficient of 0.120 and the tangibles with the regression coefficient of 0.117.
The assurance is removed from the equation; it does not mean that this variable does not contribute to satisfying customers. We can know that with the system of the hotel service of An Giang Tourimex, this basic content is accepted by customers. If we invest to improve this content, perhaps it will increase the satisfaction of customers. However, the improving level will not be much as the other contents. Instead of that, we need to focus on upgrading the contents in the order of the importance as follows: the trust, the responsiveness, the reliability, and the tangibles. It will work much more efficiently.
4.4.3 Variance analysis (ANOVA)
The One – Way ANOVA is performed to discover specifically the satisfaction between different groups. There are hypotheses as below:
H6: There is no difference in the satisfaction between groups of ages.
H7: There is no difference in the satisfaction between groups of occupations. H8: There is no difference in the satisfaction between groups of nationalities. H9: There is no difference in the satisfaction between groups of genders
4.4.3.1 Between groups of ages
The value sig. = 0.001 in the Levene’s statistictest (Appendix 11) can affirm that the variance of the satisfaction between groups of ages is different and reject the hypothesis H6. The value sig.=0.058 (Table of variance analysis ANOVA of ages groups) concludes that there is the difference with the statistical significance about the satisfaction for different ages in the reliability of the test of 90% (0.1).
In case the variance between objects which need to be compared is different, we perform the Tamhane’s T2 (Hoang Trong and Chu Nguyen Mong Ngoc, 2005). The result (Appendix of the Table Post Hoc Tests – group of ages) shows that the trend of average point about the satisfaction is decreased from 4.2 in the age of 16-25 to 3.7 at
age 60 and older. Perhaps the elderly is the more fastidious and stricter in assessment on the satisfaction. The difference in the satisfaction occurs mainly in young age groups from 16-25 and age 60 and older (sig.=0.039). In other age groups, there is no difference in the statistical significance (sig.> 0.1).
4.4.3.2 Between groups of occupations
The value sig. = 0.154 in the Levene’s test (Appendix 12) can affirm that the variance of the satisfaction between groups of ages is equal, accept the hypothesis H7.
In case the variance between objects which need to be compared equally, we perform the Dunnett test (Hoang Trong and Chu Nguyen Mong Ngoc, 2005). For the control category, we choose the first - officials. The value sig.=0.037 (Table of variance analysis ANOVA in occupations) shows that there is no significant difference in pairs between officials groups and the rest regarding the satisfaction with the service quality in the reliability of 90% (0.1).
4.4.3.3 Between groups of nationalities
The value sig. = 0.023 in the statistic Levene’s test (appendix 13) can affirm that the variance of the satisfaction between groups of ages is different and reject the hypothesis H8. The value sig.=0.01 (table of variance analyzing ANOVA in nationalities) can affirm that there is a statistical significance difference in the satisfaction in different nationalities, in the reliability of 90% (0.1).
Foreigners feel satisfied more than Vietnamese do. Maybe foreigners who come to An Giang Province do not belong to elegant group mostly. Under the current service condition and the cost which is appropriate in comparison with the condition in countries of foreigners, they feel more satisfied.
4.4.3.4 Between male and female gender
The value sig. = 0.557 in the statistical Levence’s test (Appendix 14) can say that the satisfaction between age groups is equal, then the hypothesis H9 is accepted. The value sig. =0.298 (table of variance analyzing ANOVA in genders) can say that there is not statistical significance difference in the satisfaction in different gender, in the reliability of 90% (0.1).
4.4.4 Testing hypotheses of the model
Through the result of the multiple regression analysis, the assurance is removed from the model. The trust, the responsiveness, the reliability and the tangibles have the relation to the satisfaction.
Therefore, hypotheses of the research model H1, H3, H4 and H5 are accepted, the H2 is denied.
Hypotheses for a comparison of the difference between subjects when analyzing ANOVA show that the H7 and H9 are accepted; the F6 and F8 are denied.
Thus, the satisfaction of customer is explained by responsiveness, reliability, tangibles and trust. There is a difference of satisfaction in groups of age, but there is only a significant difference between the age of 16-25 and the age of elders above 60 and between different nationalities.
4.5 SUMMARY
The research is conducting through two steps; they are the qualitative research and the quantitative one. The qualitative research is used to discover, adjust and supplement scales to be appropriate with each term of the service. After adjusting and supplementing questionnaires, there are 19 question sections of the service quality scale, 04 sections of the trust scale that are ready to do the quantitative research to measure satisfaction of customer with the service quality with 03 question sections.
The quantitative research is performed according to the method of partial level sampling combined with simple random selection, sample size n=175 to check the scales and the theoretical model. Of which, man accounts for 54.3%, woman accounts for 45.7%; public servant accounts for 14,3%, business man accounts for 55.4%, teacher accounts for 13.1%, other jobs accounts for 7.1%; Vietnamese accounts for 84%, foreigners accounts for 16%; in age of 16-25 accounts for 11.4%, from 26-40 accounts for 30.9%, 41-60 accounts for 26.3%, more than 60 accounts for 31.4%.
Collected data are processed by the software SPSS 13.0 through analyses to get the result.
The method of descriptive statistics by the SPSS 13.0 shows that customers do not really feel satisfied with the service quality of An Giang Tourimex. It means that in some specific aspects, customers still complain about the hotel service quality of the
company.
Through assessment on scales by two main tools which are exploratory factor analysis (EFA) and Cronbach Alpha coefficient test, there are 04 factors which are from the service quality scale and there is 01 factor of trust will be put in the model to study satisfaction by the regression analysis. Of which, dependent variable is satisfaction and independent variables are trust, responsiveness, assurance, reliability and tangibles. Finally, the factor of assurance is removed from the research model.
Testing the correlative coefficient Pearson and the multiple regression equation of factors which are from the factor analysis, we have the model about the hotel service quality of customers of the An Giang Tourimex as follow:
Satisfaction = 3,46E-016 + 0,515 * trust + 0,254 * responsiveness + 0,120 * reliability + 0,117 * tangibles