訴訟風險、生產限制與審計需求對審計公費影響之實證分析
計畫類別: 個別型計畫 計畫編號: NSC92-2416-H-004-033- 執行期間: 92 年 08 月 01 日至 93 年 07 月 31 日 執行單位: 國立政治大學會計學系 計畫主持人: 戚務君 共同主持人: 張清福 報告類型: 精簡報告 處理方式: 本計畫可公開查詢中 華 民 國 93 年 10 月 14 日
Wuchun Chi
E-mail: [email protected] Tel: 886-2-29393091 ext. 81031
Fax: 886-2-26573204
Address: 64, Sec. 2, Chih-Nan Rd, Wenshan, Taipei, Taiwan. Department of Accounting, National Chengchi University.
This version: October, 2004
ABSTRACT: This study examines whether and how the Enron-Andersen affair
affected audit fees by investigating the sample before (years 2000 and 2001) and after (years 2002 and 2003) the occurrence of this prominent event in the U.S. audit market. The results show that, on average, audit fees have not only increased but that the fee premiums of the remaining Big 4 audit firms are also higher post-Enron. The fee-cutting phenomenon in an initial engagement is still applicable for former Andersen clients, who had to switch to a new auditor in the year 2002. However, among the clients of Big 4 auditors, the degree of fee-cutting is statistically greater for former Andersen’s clients as compared to those for non-former Andersen’s clients, ceteris paribus. The changed structure of audit pricing is not just a one shot reaction by the audit industry after the first year of the affair, but has lasted to the second year. Finally, post-Enron, I find evidence of higher fees for Big 4 industry specialists relative to non-specialist auditors, but this result only applies when the client is a small company.
Keywords: audit fees; auditor specialization; brand name; Enron-Andersen affair;
fee-cutting.
Data Availability: All data are available from public sources.
____________
I. INTRODUCTION
This paper examines whether and how audit pricing was affected by the prominent Enron-Anderson affair. Numerous related issues on this affair have been addressed in the literature, e.g., the market participants’ reaction to the Enron-Andersen affair (Chaney and Philipich 2002; Asthana et al. 2003; Doogar et al. 2003), the timing of switching to new auditors by clients of Andersen (Barton 2003), auditors’ conservatism on reported
earnings and reporting opinions (Willekens and Bauwhede 2003; Krishnan 2004), and the market’s audit fees (Asthana et al. 2004). In this study, I further investigate whether and how this affair affects audit pricing from the following four points of view – a decreased supply of audit firms, a brand name effect, a fee-cutting phenomenon, and auditor specialization.
The “vanishing” of Arthur Andersen (hereafter AA) caused other audit firms to manage their audit risks more cautiously by choosing from a number of available strategies for controlling risk. For instance, they can enhance audit quality, improve planning and audit scope judgment (Simunic and Stein 1996; Walo 1995), increase audit fees to include a coverage premium (Pratt and Stice 1994), increase the instances of modified opinions (Krishnan and Krishnan 1996), manage their portfolio of clients by excluding highly risky auditees (Krishnan and Krishnan 1997), and make the investment to screen clients and form a strategy as a litigator (Matsumura et al. 2002). However, none of these strategies are free to the audit firm. Whichever endeavor is undertaken to offset the litigation risks, including the reduction of audit failure by increasing quality control, enhancing audit planning, adjusting their portfolio of clients, or increasing audit fees as a risk premium, they all share the same consequence that audit fees become higher, either indirectly due to lifting the audit cost and in turn raising audit fees or directly by inflating audit fees. The implementation of these types of strategies by audit firms constitutes the major motivation of this study, to empirically investigate the effects of the Enron-Andersen affair on audit pricing.
Specifically, AA, one of the largest Big 5 audit firms, was barred from reporting on the audits of SEC-registered companies after August 2002. This undoubtedly made it necessary for audit firms to react against increased litigation risk. The previously mentioned alternatives for managing litigation costs all affect auditing costs, which consequently affect audit fees. In addition, the barring of AA decreased the supply in the audit industry since AA had a large market share. More importantly, the former Big 5 now became the Big 4; thus, the bargaining power of the firms remaining in the Big 4 should be higher. These two issues motivate my first two research goals: to examine whether, on average, audit fees are higher after the Enron-Andersen affair and whether the increased audit pricing occurs in the entire audit industry or just in the remaining Big 4 audit firms who have an established brand name. The third goal is to reexamine the so-called fee-cutting phenomenon. Since AA’s former clients have to find new auditors, I reexamine whether the fee-cutting phenomenon still exists even after this prominent affair hurt auditor reputation. The final goal is to investigate the role of auditor industry specialization on fee premiums before and after the affair.
Consistent with my hypotheses, the evidence shows that, on average, audit fees are higher after the Enron-Andersen affair, and the increased audit fees originate from the Big 4’s brand name effect rather than from an increase in the non-Big 4 audit firms’ profit margin. The fee-cutting practice still exists after the event and the degree of fee-cutting is relatively stronger for former AA clients as compared to non-former AA clients in their initial engagements. Finally, while there is no evidence to support that there is a positive role of industry specialization on audit pricing before Enron, this study finds some evidence of higher fees for Big 4 industry specialists relative to non-specialist auditors. However, this result only applies to small companies due to their low bargaining power against big audit firms.
The remainder of the paper is organized as follows. The next section discusses the literature on audit pricing, takes a brief look at the Enron-Andersen affair including a review of existing studies on this event, and constructs research hypotheses. Section 3 describes the research design and sample selection. The empirical results and robustness analysis are reported in Section 4. This study concludes in Section 5.
II. LITERUTURE REVIEW AND HYPOTHESES
Many important factors determining audit fees were analyzed by previous studies in the accounting and auditing literature. In this section, I focus on the components of audit fees that are relevant to my main research questions with respect to the brand name effect, the fee-cutting phenomenon, auditor industry expertise, as well as other control variables. I will also briefly review the Enron-Andersen affair and outline some related research. Brand Name
Since accounting firms earn client-specific quasi rents due to technological advantages of incumbency and large audit firms have more clients, larger audit firms have more at stake if a loss in reputation occurs. Therefore, large audit firms are likely to offer more guarantees than small audit firms. Based on the product differentiation theory, prior studies showed that Big 8 auditors earn higher audit fees than non-Big 8 auditors (see, e.g., Francis 1984; Francis and Stokes 1986; and Palmrose 1986). Similar to the prior literature, I use a dummy variable, BIG, to indicate whether the auditee is a client of a Big 4 (5) audit firm. Particularly, I investigate whether the earlier findings that fee premiums may be attributed to a brand name effect exist in the post-Enron period. Fee-Cutting
Assuming that the audit market is highly price competitive and that the client’s switching costs and auditor’s start-up costs are non-zero, DeAngelo (1981) provides a theory to demonstrate and predict low-balling. She defines low-balling as setting audit fees below total costs on initial audit engagements. Since low-balling itself cannot be directly observed, DeAngelo’s work sparked many empirical studies to analyze a highly related issue – whether price cutting occurs in initial audit fees (e.g., Francis 1984; Simon and Francis 1998; and Craswell and Francis 1999). Because former AA clients have to
switch their auditor in the year 2002, we have a unique opportunity to reexamine the fee-cutting phenomenon during a very recent period.
Auditor Industry Expertise
This study also examines the role of auditor industry expertise on the pricing of Big 4 audits post-Enron. Unlike the brand name effect, which is simply measured by whether the audit firm is a Big 4 firm, specialization is investigated by focusing on the audit firm’s market leadership position. The literature offers mixed evidence as to the existence of an industry specialization premium. Craswell et al. (1995), who use Australian data from 1987, DeFond et al. (2000), who use 1992 data from Hong Kong, and Casterella et al. (2004), who use 1994 data from the U.S., report that there exists an industry
specialization premium.1 In contrast, Ferguson and Stoke (2002), who use Australian data from the 1990s, find no strong evidence for industry-specialist premiums. Ferguson et al. (2003) re-use the same data set, and find evidence that industry-specialist premiums exist when office-level measures of specialization are considered. Since the collection of office-level (or city-level) industry data for U.S. audit firms is cost prohibitive, this paper measures auditor specialization at the firm-wide level.
Control Variables
I control for several variables that are expected to affect audit fees. These are: auditee size (LnASSETS), the number of consolidated subsidiaries (SUBS), the number of business segments (SEGMENTS), the percentage of total assets in receivables and
inventories (RECINV), net income divided by total assets (ROI), whether the firm incurred a loss in the past three years (LOSSES), whether the auditor’s opinion is a non-standard unqualified opinion (OPINION), and debt ratio (LEVERAGE). For details on the choice of these variables, I refer the reader to previous studies such as, Simunic (1980), Craswell, Francis, and Taylor (1995), Craswell and Francis (1999), Francis (1984), and Casterella et al. (2004).
The Enron-Andersen Affair and Related Research
This event became public on October 16, 2001, when Enron announced that its third quarter earnings included a nonrecurring after tax charge of $1.01 billion due to
accounting errors. It ended with AA’s termination on June 15, 2002, when the federal jury prohibited AA from conducting and reporting on audits of SEC-registered companies after August 2002.2 Chaney and Philipich (2002) find that AA’s non-Enron clients experienced a significantly negative market reaction upon AA’s admission that a significant number of documents had been shredded. In addition, Asthana et al. (2003) and Doogar and Xie (2003) further suggest that the impairment in the credibility of AA generated spillover effects on other auditors.
1 Note that the finding in Casterella et al. (2004) that Big 6 industry specialists’ fees are significantly higher than those of non-specialists exists only for companies in the lower half of their sample, which they partitioned based on size.
Since former AA clients have to find a new auditor by August 2002, Barton (2003) investigates the timing of their decision to switch auditors in order to examine the demand for auditor reputation. She documents that, on average, large, well-known and highly reputable clients care more for auditor reputation based on the evidence that those firms dismissed AA sooner and selected one of the remaining Big 4 as their new auditor.
In addition to studies that examine the reaction of the stock market and firms’ auditor switching decisions, there are many others that focus on the responses of the remaining auditors. Aldred (2002) indicates that litigation risk and costs of professional liability insurance have soared by more than 100% for the remaining Big 4 auditors. Willekens and Bauwhede (2003) find that the number of qualified reports increased following the Enron-Andersen affair and Krishnan (2004) proposes and supports the view that enhanced earnings conservatism became a common strategy for the remaining
auditors.
Asthana, Balsam, and Kim (2004) find that audit fees and the premium charged by Big 4 audit firms both increased in the year 2002, the first year after the Enron-Andersen affair. They also find that in 2002, former AA clients pay lower audit fees than continuing clients of Big 4 audit firms. My study complements their research by investigating
auditor industry expertise, the brand name effect, and the fee-cutting phenomenon with an extended sample period. This allows us to further examine how this affair affects audit fees for a longer period of time rather than rely on data from the year 2002 alone. Specifically, this study asks whether the impact of this affair on audit fees is just a one- shot effect that is reflected in a particular year or whether it had a permanent effect on audit pricing. In addition, I also design different regression models and use a different methodology to address my research issues.
Hypotheses
Because AA was barred from reporting on the audits of SEC-registered companies after August 2002, former AA clients had to switch to new auditors by that date. In my research sample, the proportion of all clients and of clients of Big 5 firms that were audited by AA in the years 2000 and 2001 is 20.43% and 22.43%, respectively. Thus, the barring of AA resulted in a decrease in the supply of audit firms in the audit market. From this viewpoint, I formulate the following first hypothesis3:
H1: Average audit fees increased after the Enron-Andersen affair.
The prior literature mentioned that Big 8 (6) (5) audit firms have a better reputation, which is reflected in their premiums and higher audit pricing. When the Big 5 audit firms became today’s Big 4 audit firms after the affair, their bargaining power should have increased if their reputation is considered to be a scarce asset to financial statements users.
Thus, the second hypothesis is:
H2: The audit fees of Big 4 firms are higher after the Enron-Andersen affair.
Finally, previous studies found that the fee-cutting phenomenon exists when firms are in their initial engagements. The fact that former AA clients have to switch to another audit firm implies that they will enter the initial stage of new engagements when they choose a new auditor. Based on the low-balling theory, I expect that these firms will have lower audit fees, which leads to the following hypothesis:
H3: Former AA clients have lower audit fees in their new and initial engagements.
Even though there is no clear evidence on the association between auditor industry specialization and audit pricing, especially, using recent U.S data, it is nonetheless important for us to understand the role of auditor expertise in audit pricing and whether it changed post-Enron. Assuming that obtaining a good quality audit became more
important after Enron-Andersen, then my last hypothesis predicts that the audit fees paid to auditors who have specialization in a particular industry increased post-Enron.
H4: Post-Enron, the effect of auditor industry expertise on audit pricing increased among the clients of Big 4 audit firms.
In sum, I hypothesize that audit fees have increased after the prominent
Enron-Andersen affair, audit fees for firms choosing Big 4 are higher than what they were before the affair, and former AA clients have lower audit fees in their initial
engagements when they switch to a new auditor. In addition, I further examine the impact of auditor industry expertise on audit pricing before and after the affair. Specifically, this study contributes to the line of audit pricing research by probing into the consequences of a reduction in the supply of audit firms, the reputation effect, the fee-cutting phenomenon, and auditor industry specialization. This provides us with an overall understanding of how the Enron-Andersen affair affected audit pricing.
R
ESEARCHM
ETHOD ANDS
AMPLEResearch Method
(years 2000 and 2001) and after (years 2002 and 2003) the Enron-Andersen affair. Since AA was barred from the audits of SEC-registered companies after August 2002, I exclude non calendar year data in order to guarantee that the data in 2002 completely falls into the period after this affair .4 To examine H1, I regress the natural logarithm of audit fees on the two dummy variables that test my hypotheses and a set of control variables as shown in Equation (1) below:
LnFee = b0 + b1 BIG + b2 LnASSETS + b3 SUBS + b4SEGMENTS
+ b5RECINV + b6ROI + b7LOSSES + b8 OPINION
+ b9LEVERAGE + b10AFTER + ε. (1)
where:
LnFee = the natural logarithm of audit fees (in thousands of dollars);
BIG = 1 if the company employs a Big 4 (5) auditor, and 0 otherwise;
LnASSETS = the natural logarithm of total assets;
SUBS = the square root of the number of subsidiaries;
SEGMENTS = the number of business segments reported in Compustat;
RECINV = the percentage of total assets in receivables and inventories;
ROI = net income divided by total assets;
LOSSES = 1 if the firm reports negative income in any of the previous
three years, and 0 otherwise;
OPINION = 1 if the firm receives a non-standard unqualified audit
opinion, and 0 otherwise;
LEVERAGE = the ratio of total debt to total assets;
4 Of course, another potential cutoff point is August, 2002. However, I do not use this cutoff point because it will cause ambiguity in classifying the full sample into before event or after event periods. Based on the remarks from Barton (2003), former AA clients with different characteristics have different auditor dismissal decisions occurring anytime after the Enron-Andersen affair started in October 16, 2001. To explain why it may be hard to partition the full sample into before and after periods for firms with non-calendar years, consider the following examples. If a former AA client with a May 31 fiscal year switches its auditor on July 31, 2002 (i.e., fees in this year are still paid to AA), then the audit fees in the year 2002 should be in the before event period. However, if the firm switches auditors on March 31, 2002 (i.e., fees in this year will be paid to the new auditor), then the audit fees in the year 2002 should be in the after event sample. To make a clear identification on whether observations should be classified in the before or the after event periods, I eliminate the firms that are non-calendar year. Therefore, all audit fees data in the year 2002 will be exactly in the after event period.
AFTER = 1 if the data belongs to the year 2002 or 2003, and 0
otherwise.
A significant positive coefficient on AFTER, b10, supports H1, which states that average audit fees shifted upwards after the Enron-Andersen affair. To test H2, I add several cross terms that multiply AFTER by the other variables that appear in Equation (1)
as follows:
LnFee = b0 + b1BIG + b2LnASSETS + b3 SUBS + b4SEGMENTS
+ b5RECINV + b6ROI + b7LOSSES + b8OPINION
+ b9LEVERAGE + b10AFTER + b11AFTER × BIG
+ b12AFTER × LnASSETS + b13AFTER × SUBS
+ b14AFTER × SEGMENTS +b15AFTER × RECINV
+ b16 AFTER × ROI + b17AFTER × LOSSES.
+ b18AFTER × OPINION + b19AFTER × LEVERAGE + ε (2)
In Equation (2), a positive coefficient b11 supports H2. In fact, some research design
issues should be emphasized here. First, the interpretation of the coefficients in Equations (1) and (2) is somewhat different depending on whether we are testing H1 or H2.
Specifically, in Equation (2), since the dummy variable BIG equals zero when the
observation is a non-Big 4 (5) client, the coefficient on AFTER, b10, captures the
incremental audit fees of non-Big 4 clients post-Enron. The coefficient on AFTER × BIG,
b11, measures the incremental audit fees of the clients of Big 4 post-Enron. Thus, in
Equation (2), the result where both b10 and b11 are positive supports that audit fees in both
types of audit firms, the Big 4 or the non-Big 4, are higher after the Enron-Andersen affair. On the contrary, a result that only b11 (b10) is significantly positive indicates that
the audit fees of the clients of Big 4 (non-Big 4) only have increased post-Enron. Differently, in Equation (1), a positive coefficient on AFTER supports that, on average,
audit fees are higher post-Enron. Therefore, Equation (2) is used to demonstrate whether only one type or both types of audit firms increase their audit fees after Enron-Andersen. Second, under the condition that H3 is valid, the estimated coefficients on AFTER in
Equation (1), AFTER in Equation (2), and AFTER × BIG in Equation (2) will become
smaller. The reason is that the low-balling effect will lower audit fees in the initial engagement. Specifically, those firms that were audited by AA are in the first year of a new engagement in the year 2002, and if they do not switch auditors in the next year then the year 2003 constitutes the second year of their engagement. Those former AA clients with fee-cutting all belong to “AFTER =1” in Equation (1) and Equation (2) which will
Thus, this will dilute the evidence to support H1 and H2 using Equation (1). Conversely, if H1 and H2 can be supported by Equations (1) and (2), then the evidence is more robust.5
Third, it should be very important to discriminate between the effects of H1 and H2, where audit fees increase post-Enron, and H3, where audit fees, affected by fee-cutting, decrease after the affair. In order to make H3 testable separately, I only choose the post-Enron sample and add several new dummy variables. Initially, I delete the
observations that are for the years 2000 and 2001 or that are for clients of non-Big 4 (i.e., I only include the union of post-Enron period and clients of Big 4). Next, I add four new dummy variables – FORMERAA1st, FORMERAA2nd, NonFORMERAA1st, and
NonFORMERAA2nd. Since the data in this new sample are clients of the Big 4 in the
years 2002 or 2003, there are five mutually exclusive scenarios that could occur in this particular sample: (1) former AA clients whose auditor tenure equals one, where
FORMERAA1st is coded as one and zero otherwise; (2) former AA clients whose auditor
tenure equals two, where FORMERAA2nd is coded as one and zero otherwise; (3)
non-former AA clients whose auditor tenure equals one, where NonFORMERAA1st is
coded as one and zero otherwise; (4) non-former AA clients whose auditor tenure equals two, where NonFORMERAA2nd is coded as one and zero otherwise; and (5) non-former
AA clients whose auditor tenure is at or above three, where the previous four dummy variables must be all coded as zero. Particularly, I use the following regression to test my final hypothesis that the fee-cutting effect existed after the Enron-Andersen affair:
LnFee = b0 + b1FORMERAA1st + b2FORMERAA2nd
+ b3NonFORMERAA1st + b4NonFORMERAA2nd
+ b5LnASSETS + b6 SUBS+ b7 SEGMENTS + b8 RECINV
+ b9 ROI + b10 LOSSES + b11 OPINION + b12 LEVERAGE + ε (3)
H3 predicts a negative coefficient on FORMERAA1st, b1. It is reasonable to expect that the coefficient b1 is smaller that b2 because the fee-cutting effect should be more powerful in the first year of an audit engagement as compared to the second year. Similarly, using the fee-cutting practice also predicts a negative coefficient on
NonFORMERAA1st, b3. To compare the relative degree of fee cutting between former AA clients and non-former AA clients, I will test the null hypothesis that b1 = b3.
Similar to Ferguson et al. (2003), two auditor variables are specified to test H4, which states that the effect of industry expertise on audit pricing increased post-Enron. The first variable, AUDITOR#1, indicates if the observation is audited by the specific Big 4 (5) audit firm that is the leader for that particular observation’s industry; and the second
5 If all former AA clients switch to Big 4 firms, then the estimated coefficient on AFTER in Equation (2) will not be affected by the low-balling or fee-cutting effect.
variable, AUDITOR#2, indicates if the observation is audited by the second-ranked Big 4 (5) audit firm in that particular industry. The Ordinary Least Squares (OLS) regression model is specified as follows:
LnFee = b0 + b1 AUDITOR#1+ b2 AUDITOR#2 + b3 LnASSETS + b4 SUBS
+b5 SEGMENTS + b6 RECINV + b7 ROI + b8 LOSSES + b9 OPINION
+ b10 LEVERAGE + b11 AFTER + b12 AFTER × AUDITOR#1
+ b13 AFTER × AUDITOR#2 + b14 AFTER × LnASSETS
+ b15 AFTER × SUBS + b16 AFTER × SEGMENTS
+b17 AFTER × RECINV + b18 AFTER × ROI + b19 AFTER × LOSSES.
+ b20 AFTER × OPINION + b21 AFTER × LEVERAGE + ε (4)
The coefficients on AUDITOR#1 and AUDITOR#2, b1 and b2, examine whether
auditor specialization is associated with higher audit fees before the Enron-Andersen affair. The coefficients on the cross terms AFTER×AUDITOR#1 and
AFTER×AUDITOR#2, b12 and b13, document whether this existed post-Enron. In
particular, the difference between the coefficients b1 and b12 describes the incremental
fees after the affair for the first-ranked Big 4, while the difference between the coefficients b2 and b13 documents the incremental fees after the affair for the
second-ranked Big 4. Using these tests, this paper reports whether the Enron-Andersen affair changed the role of auditor industry expertise in determining audit fees.
Using 1994 data from the U.S. which they partition based on firm assets, Casterella et al. (2004) report that there exists an industry specialization premium for companies in the lower half of their sample. They explain that small size companies pay a fee premium for expertise due to their low bargaining power. Thus, I also partition my sample into two subgroups according to median of assets and I re-estimate Equation (4) for each sample period.
Finally, to mitigate the effects of outliers and potential errors in the data, I winsorize the top and bottom 1 percentiles of all the variables to perform the four regression
models.6 Sample
My initial sample consists of 37,688 firm-years that are available from Standard & Poor’ Research Insight Compustat for the years 2000 to 2003. To fit the analysis
requirements, I first excluded financial institutions from the sample (Standard Industrial Classification (SIC) codes between 6000 and 6999). This reduces the sample by 8,965 observations. I further eliminated firms with non-calendar or missing years (9,558 firms),
and also deleted observations with missing data required for the independent variables of the regression models (7,160 firms). Finally, firms without publicly available audit fees data were eliminated (3,916 firms). This process resulted in a final sample with 8,089 firm-years. Table 1 summarizes the sample selection procedure by each year from 2000 to 2003.
[Insert Table 1 Here]
E
MPIRICALR
ESULTSUnivariate Tests
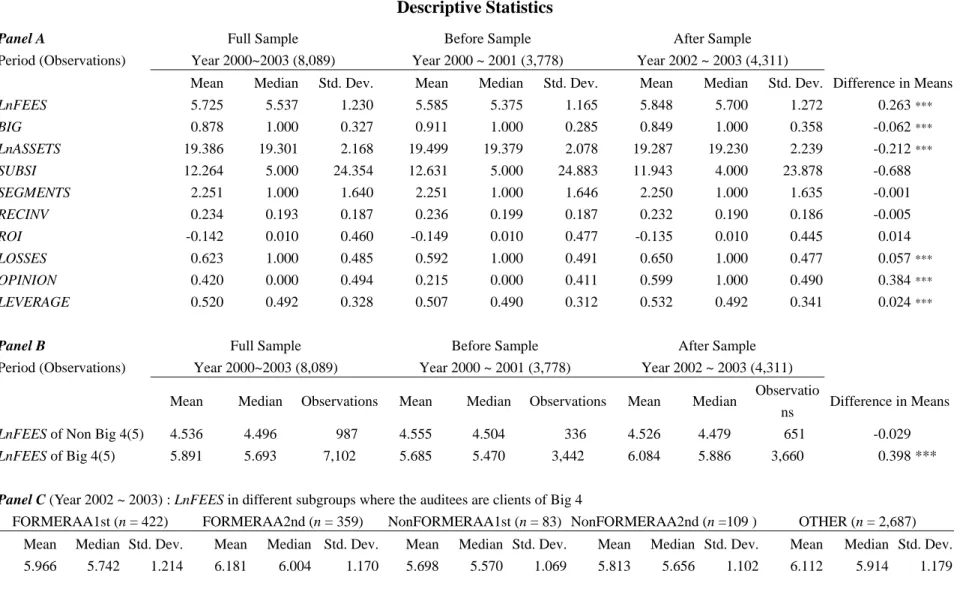
Descriptive statistics are reported in Table 2 for the full sample (from years 2000 to 2003) and the two partitioned samples, before the Enron-Andersen affair (before sample) and after the Enron-Andersen affair (after sample). Since there are four (five)
international big audit firms in the after (before) sample, I use Big 4 (5) to represent the big audit firms in the after (before) sample.
[Insert Table 2 Here]
Panel A shows that all variables, except for SUBSI, SEGMENTS, RECINV, and ROI, are significantly different in the before and after samples. Since the average increase in
LnFEES of 0.263 (from 5.585 to 5.848 post-Enron) is significant (p-value < 1%), H1’s prediction that audit fees are higher in the after sample is supported by this univariate test. Additionally, the increase in LOSSES (from 0.592 to 0.650) and OPINION (form 0.215 to 0.599) might imply that not only did the so-called aggressive accounting skills lessen after the affair (since the occurrence of losses increased), but also that auditors became more conservative as shown by the significant increase in the number of non-standard unqualified opinions. The increased debt ratio (LEVERAGE increase from 0.507 to 0.532) might reflect investors’ lack of confidence in the stock market, which caused companies to switch their financing activities from equity to debt.
Panel B documents the audit fees of non-Big 4(5) audit firms (hereafter
Non-Big-Subgroup) and Big 4(5) audit firms (hereafter Big-Subgroup) in the before and
after samples. While there are no significant changes in audit fees in the
Non-Big-Subgroup post-Enron, audit fees increased in the Big-Subgroup (average
LnFEES increased from 5.685 to 6.084 with p-value < 1%). In fact, in terms of direction, audit fees in the Non-Big-Subgroup decreased rather than increased (LnFEES decreased from 4.555 to 4.256) after the affair. Therefore, I find that the overall increase in average audit fees may be attributed to the brand name of Big 4 firms since this phenomenon only exists in the Big-Subgroup.
Since audit fees are higher in the Big-Subgroup post-Enron, I further investigate audit fees with respect to firms that are former AA or non-former AA clients. Panel C demonstrates statistics of LnFEES for the following subgroups: former AA clients whose auditor tenure equals one (labeled by FORMERAA1st), former AA clients whose auditor tenure equals two (labeled by FORMERAA2nd), non-former AA clients whose auditor tenure equals one (labeled by NonFORMERAA1st), non-former AA clients whose auditor tenure equals two (label by NonFORMERAA2nd), and the remaining others (labeled by OTHER). We can see that LnFEES in the FORMERAA1st subgroup (5.966) and LnFEES in the NonFORMERAA1st subgroup (5.698) are both lower than that in the OTHER subgroup (6.112). Additionally, un-tabulated results show that the difference in average LnFEES between the OTHER subgroup and the two initial years of engagement subgroups (i.e., FORMERAA1st and NonFORMERAA1st) are both significant at the 5% level. Thus, this univariate test validates H3. Note that, LnFEES in the FORMERAA1st subgroup (5.966) is higher than that in the NonFORMERAA1st subgroup (5.698) implying that the degree of fee-cutting is less for former AA clients; however, this
observation will be overturned in the multiple regression analysis that will be shown later. Specifically, we will see that ignoring the potential effect of control variables causes us to mistakenly infer that the degree of fee-cutting, in terms of its magnitude, is not greater for former AA clients.
In fact, some confounding factors will affect the quality of inference through the univariate tests directly. For instance, the fact that the mean of LEVERAGE is bigger in the after sample (0.507 vs. 0.532) may cause a greater LnFEES after Enron-Andersen simply because high risk firms, as proxied by LEVERAGE, generally have to pay higher audit fees. In contrast, the fact that the mean of LnASSETS in the before sample, 19.499, is significantly greater than that in the after sample, 19.287, may dilute the power on the evidence to support H1 because it is well-known that big firms pay higher audit fees than small firms. Therefore, to obtain more rigorous evidence on audit fees with respect to the affair, adopting multiple regression models should be desirable.
Finally, Panel D shows that there is no strong evidence to support that auditor industry specialization receives a premium in the before sample where the means in its three subgroups, AUDITOR#1, AUDITOR#2, and NonAUDITOR#1or#2, are 5.663, 5.818, and 5.628, respectively. The mean difference between AUDITOR#1 and
NonAUDITOR#1or#2, 0.034 (p-value = 0.440) is not significant while the mean difference between AUDITOR#2 and NonAUDITOR#1or#2, 0.190 (p-value < 1%) is statistically positive in the before sample. This univariate test reveals that, in the after sample, the role of auditor specialization has an effect on fee premiums because the mean difference between AUDITOR#1 and NonAUDITOR#1or#2, 0.121 (p-value < 1%) and that between AUDITOR#2 and NonAUDITOR#1OR#2, 0.234 (p-value < 1%) are both statistically positive in the after sample. However, as compared to the second-ranked auditor, audit fees are significantly lower for clients of the first-ranked auditor both in the
before and after samples (both with p-value < 5%). Finally, comparing the three
are all statistically higher post-Enron (all with p-value <1%). Correlation Matrix Results
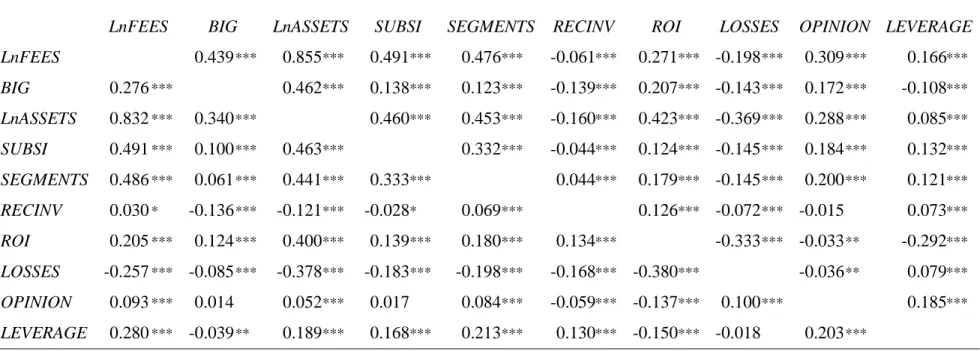
Table 3 documents the correlation matrix before (see the lower triangular) and after (see the above triangular) the Enron-Andersen affair. Consistent with my H2 conjecture, corr(LnFEES, BIG) rises from 0.276 (in the before sample) to 0.439 (in the after sample). Additionally, there in an increase in corr(LnFEES, OPINION) of 0.216 (from 0.093 to 0.309). Craswell and Francis (1999) explain that higher fees are associated with modified opinions due to the added investigative effort required in such circumstances. However, the increased correlation may also be attributed to an increase in audit risk management if firms with qualified opinions are considered to be a high litigation risk by nature.
[Insert Table 3 Here]
Multivariate Tests
The OLS audit fees regression models are documented in Table 4 where the reported p-values for all parameters are two-tailed probabilities. The last two rows of the table show that the adjusted R2 are all greater than 75% and the corresponding right-tailed probabilities of the F-ratios are all significantly below 1%, which indicates that a good fit was achieved by all regressions models.
[Insert Table 4 Here]
The coefficient on AFTER (b10 = 0.354 with p-value < 1%) in Equation (1)
demonstrates that, on average, audit fees are significantly higher after the
Enron-Andersen affair. Thus, I find that H1 is supported by the data. The signs of the estimated coefficients on the control variables (in the upper part of the full sample) are all consistent with prior studies. They show that audit fees are positively related to BIG,
LnASSETS, SUBS , SEGMENTS, RECINV, LOSSES, OPINION, and LEVERAGE, and negatively related to ROI.7
To test H2, I conduct the same analysis using Equation (2). All estimated results on the control variable are consistent with those in Equation (1). However, the estimated coefficient on AFTER (b10 = 0.096, p-value = 0.601) is now insignificant although its sign
is still positive. Therefore, I find no strong evidence to support that audit fees of non-Big 4 audit firms increased after the Enron-Andersen affair. On the contrary, I find evidence that audit fees of clients of the Big 4 increase after the affair because of the significant
7 Craswell and Francis (1999) explain that the result that firms with higher ROI have lower fees is consistent with auditor-client risk sharing, i.e., more profitable clients assume more of the total risk that is shared between the auditor and the client.
coefficient on AFTER × BIG (b11 = 0.192 and p-value < 1%). These results are supportive
of H2, which states that the fee charging power of audit firms with a brand name increases after the event. Furthermore, the estimation of Equation (2) reveals that the results supporting H1, that on average audit fees increase post-Enron, can be attributed to the Big 4 audit firms rather than non-Big 4 audit firms.
Finally, the last column of Table 4 reports the results on testing H3. I find that the coefficient on FORMERAA1st (-0.205) is statistically negative (p-value < 1%),
supporting my H3 conjecture that audit fees for former AA clients switching to Big 4 post-Enron are significantly lower than audit fees in other situations. As for non-former AA clients, the fee-cutting phenomenon in their initial engagement does not appear to be significant since the estimated coefficient on NonFORMERAA1st equals -0.087 with a two-tailed p-value of 0.191. Thus, the existence of fee-cutting practices is supported at the 10% significance level, under the condition that we perform a one-tailed test. An un-tabulated result points out that the difference between the coefficients on
FORMERAA1st and NonFORMERAA1st of -0.118 (i.e., -0.205 minus -0.087) is
statistically negative (p-value < 10%, two-tailed). Thus, unlike the results which appeared in the univariate tests, after considering control variables, the degree of fee-cutting is greater for former AA clients who switch to Big 4 post-Enron as compared to any other new client which hires a Big 4 firm at the same time.
Although they are mixed, some additional observations on the results are worth mentioning here. In Equation (2), the coefficient on AFTER × ROI (b16 = 0.138 and
p-value < 1%) is significantly positive. Previous studies mentioned that ROI can be viewed as a proxy for audit risk, since risk sharing between profitable clients and auditors is higher. We can see from Table 4 that audit fees are more sensitive to this factor after the affair. As for RECINV, another common measure used to proxy for the audit risk variable, I find that its association with audit fees decreases post-Enron, as shown by the
statistically negative coefficient on AFTER × RECINV (b15 = -0.290 and p-value < 1%).8
Finally, if we assume that the variable LOSSES reflects a firm’s increased litigation risk, (i.e. a firm which incurs losses during the previous three years has a high litigation risk) instead of the conventional view that losses represent an inability to pay higher fees (as discussed for example by Craswell and Francis 1999), then I also find evidence that audit fees are more sensitive to litigation risk post-Enron. However, this paper hesitates to make such conclusions on audit risks and litigation since some of the evidence is not fully consistent with the interpretations put forth by the previous literature on audit fees.
Robustness Analysis
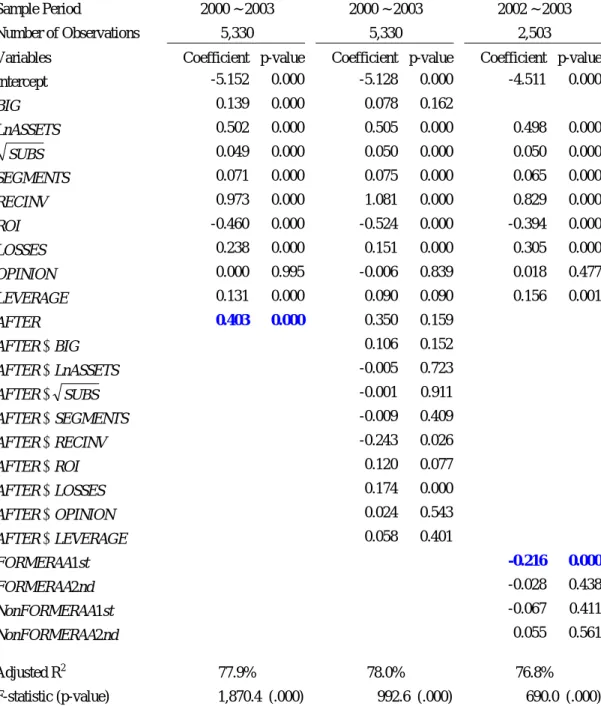
Several sensitivity checks are performed in this study. First, I perform the analysis using the firms that have complete data for every year in the sample from 2000 to 2003. The results are shown in Table 5. Comparing the results of Table 4 with Table 5, we can
8 I have also replaced RECINV by receivables and inventories separately instead of aggregating them and found that all results are qualitatively unchanged.
see that all inferences above are qualitatively unchanged except for H2, since the coefficient on AFTER × BIG (0.106) is not significantly different from zero (p-value = 0.152) at the conventional levels in two-tailed tests. Therefore, H2 can be supported only through a one-tailed test. Nevertheless, the rest of the analysis is robust to the change in the data set.
[Insert Table 5 Here]
Second, I re-estimate the models by considering that Simuic (1980) and Palmreose (1986) noted that audit fees are lower for utility companies (SIC code 49). I add a dummy variable to control for this industry effect and find, in un-tabulated results, that the conclusions are the same as documented in Table 4. Additionally, the conclusions are not sensitive to the unwinsorized data.
One Year Effect or Longer?
Finally, I check whether the findings of this study are only applicable to the first year after the event. Thus, I re-estimate Equation (1) and Equation (2) by changing the definition of the after sample as follows: To investigate the one-year effect, I use observations in the year 2002 as the after sample; to examine the two-year effect, I use year 2003 data as the after sample instead. Note that, observations in the years 2000 and 2001 are both in the before sample. The analysis reported in Table 6 shows that the Enron-Andersen effect on audit pricing has lasted for at least two years.
[Insert Table 6 Here]
Analysis of Auditor Industry Expertise
Table 7 reports the results for Equation (4), where the non-Big 4(5) observations are excluded. We can see in the first column of Table 7 (full Big 4(5) sample) that the
coefficients on AUDITOR#1 (b1 = -0.059) and AUDITOR#2 (b2 = 0.031) are both
negative, although only b1 is significant. Therefore, there is no evidence of a significant positive relationship between fee premiums and auditor specialization before the affair. However, the positive coefficients on AFTER×AUDITOR#1, (b12 =0.031) and
AFTER×AUDITOR#2 (b13 = 0.016), although still insignificant, show that the direction of
the relationship between fee premiums and specialization is different post-Enron.
Following Casterella et al. (2004), I partition the full Big 4(5) sample into two subgroups using the median of LnASSETS in the corresponding sample year. Specifically, the median of LnASSETS in the years 2000, 2001, 2002, and 2003 is 19.695, 19.357, 19.466, and 19.752, respectively. Using the median as a benchmark, I divide the sample into
reported in the last two columns of Table 7.
[Insert Table 7 Here]
Consistent with the findings of Casterella et al. (2004), I find that auditor industry specialization is not associated with higher fee premiums in the upper half sample since all AUDITOR#-related variables are negative before and after the affair. However, I find weak evidence supporting a positive relationship between fee premiums and auditor specialization in the lower half sample because the positive estimated coefficient on
AFTER×AUDITOR#1 is only marginally insignificant (two-tailed p-value = 0.114). In
addition, by comparing the estimated coefficient on AFTER×AUDITOR#2 between the three columns, we can see that its largest value appears in the lower half column. Finally, to examine the incremental change in the role of auditor industry specialization on audit pricing before and post-Enron, I test for the difference between the coefficients on
AUDITOR#1 and AFTER×AUDITOR#1 (i.e., b1 vs. b12) and the difference between the
coefficients AUDITOR#2 and AFTER×AUDITOR#2 (i.e., b2 vs. b13) for each column. The
un-tabulated results show that b1 – b12 and b2 – b13 equals .089 (p-value <10%) and 0.046
(p-value = 0.416), in the full Big 4(5) column, 0.075 (p-value = 0.201) and 0.091 (p-value = 0.221), in the lower half column, and 0.078 (p-value = 0.299) and 0.051 (p-value = 0.533), in the upper half column. Thus, when I use the classification into three levels of specialists that was employed by Ferguson et al. (2003), I find no strong evidence to support that the audit industry specialization effect on fee premiums increased post-Enron.
I further classify auditor specialists by combining AUDITOR#1 and AUDITOR#2 as a group and the remaining observations as another. In other words, I form a new dummy variable AUDITOR#1or#2 to describe the observations that are audited by either first- or second- ranked Big 4 (5) audit firms in that particular industry. The results are reported in Table 8.
[Insert Table 8 Here]
For small size clients (lower half column), I find strong evidence of higher fees for Big 4 industry specialists relative to non-specialists in the U.S. audit market. This can be seen in the positive and statistically significant coefficient on AFTER×AUDITOR#1or#2, 0.058 (p-value <10%). Thus, the hypothesis that post-Enron, the effect of auditor industry expertise on audit pricing increased among the clients of Big 4 audit firms is supported when the auditee is a small company.
S
UMMARYThe prominent Enron-Andersen affair resulted in the barring of Arthur Andersen, one of the largest ever Big 5 audit firms, from reporting on the audits of SEC-registered companies after August 2002. This undoubtedly reinforced the necessity for the
remaining audit firms to adjust their practices post-Enron. The purpose of this study is to investigate whether and how audit fees are affected by the Enron-Andersen affair.
I adopt the following perspective to address this issue: the barring of Arthur Andersen decreased supply in the audit industry, and more importantly, the past Big 5 became the now Big 4. This implies that the bargaining power of firms remaining in the Big 4 should be higher. Therefore, audit fees will increase on average, but this will be mainly due to the brand name effect, which can be seen in the audit fees of the clients of Big 4 being higher than those of the non-Big 4. Furthermore, since former AA clients have to find new auditors by August 2002, we have a unique sample in which we can reexamine whether the fee-cutting phenomenon that occurs in initial engagements, still exists post-Enron.
In summary, I find strong evidence to support those conjectures. That is, on average, audit fees are higher after the Enron-Andersen affair; and the increased audit fees originate from the brand name effect of the remaining Big 4 audit firms rather than the non-Big 4 audit firms. In addition, the fee-cutting phenomenon still exists after the prominent affair. Among the clients of Big 4 auditors, the degree of fee cutting is
statistically greater for former Andersen’s clients as compared to non-former Andersen’s clients, ceteris paribus. The changed structure of audit pricing is not just a one shot reaction by the audit industry, but has lasted to the second year. Furthermore, post Enron, I find that when the client is a small company there is evidence of higher fees for Big 4 industry specialists relative to non-specialist auditors.
Finally, this paper does not analyze several related issues. For example, I investigate the effect of auditor expertise on audit fees, with expertise defined at the firm-wide level only. It needs future studies to address this issue by defining auditor expertise at the office level. In addition, it is also important for practitioners and researchers to understand whether and how audit firms altered their audit planning and professional materiality judgments after this affair.
R
EFERENCESAldred, C. 2002. Auditors’ E&O costs add up, Business Insurance 36 (5): 3-4.
Asthana, S., S. Baslsam, and J. Krishnan. 2003. Audit firm reputation and client stock price reactions: evidence from the Enron experience. Working paper, Temple University.
Asthana, S., S. Baslsam, and S. Kim. 2004. The effect of Enron, Andersen, and Sarbabes-Oxley on the market audit service. Working paper, Temple University. Barton, J. 2003. Who cares about auditor reputation? Working paper, Emory University,
Atlanta.
Casterella, J. R., J. R. Francis, B. L. Lewis, and P. L. Walker. 2004. Audito industry specialization, client bargaining power, and audit pricing. Auditing: A Journal of
Practice & Theory 23: 123-140.
Chaney, P. and K. Philipich. 2002. Shredded reputation: the cost of audit failure. Journal
of Accounting Research 40:1221-1245.
Craswell, A. T., and J. R. Francis. 1999. Pricing initial audit engagements: A test of completing theories. The Accounting Review 74 (April): 201-216.
—, —, and S. Taylor. 1995. Auditor brand name reputations and industry specializations.
Journal of Accounting and Economics 20: 297-322.
DeAngelo, L. E. 1981. Auditor independence low-balling and disclosure regulation.
Journal of Accounting and Economics 3: 93-117.
DeFond, M., J. Franncis, and T. J. Wong. 2000. Auditor industry specialization and market segmentation: Evidence from Hong Kong. Auditing: A Journal of Practice
& Theory 19: 49-66.
Doogar, R., T. Sougiannis, and H. Xie. 2003. The impairment of auditor credibility: stock market evidence from the Enron-Andersen Saga. Working paper, University of Illinois at Urbana-Champian.
Francis, J. R. 1984. The effect of audit firm size on audit prices – A study of the Australian market. Journal of Accounting and Economics 6: 133-151.
Francis, J., and D. Stokes. 1986. Audit prices, product differentiation, and scale economics: Further evidence from Australian audit market. Journal of Accounting
Research 24 (2): 283-293.
Ferguson, A., and D. Stokes. 2002. Brand name audit pricing, industry specialization and leadership premiums post-Big and Big 6 mergers. Contemporary Accounting
Research 19: 77-110.
—, J, Francis, and D. Stokes. 2003. The effects of firm-wide and office-level industry expertise on audit pricing. The Accounting Review 78: 429-448.
Krishnan G. V. 2004. Auditors’ risk management and reputation building in the post-Enron environment: an examination of earnings conservatism of former Andersen clients. Working paper, George Mason University.
Krishnan, J., and J. Krishnan. 1996. The role of economic trade-offs in the audit opinion decision: An empirical analysis. Journal of Accounting, Auditing, & Finance 11 (Fall): 565-586.
—, and —. 1997. Litigation risk and auditor resignations. The Accounting Review 72 (October): 539-560.
Matsumura, E. M., S. Yoo, and R. R. Tucker. 2002. Managing auditor litigation risk by screening clients and forming a strategy as a litigator. Working paper, University of Wisconsin-Madison.
Palmrose, Z-V. 1986. Audit fees and audit size: Further evidence. Journal of Accounting
Research 23: 97-110.
Pratt, J., and J. D. Stice. 1994. The effects of client characteristics on auditor litigation risk judgments, required audit evidence, and recommended audit fees. The
Accounting Review 69 (October): 639-656.
Simon, D., and J. Francis. 1988. The effects of auditor change on audit fees: Tests of price cutting and price recovery. The Accounting Review (April): 259-269.
Simunic, D. A., 1980. The pricing of audit services: theory and evidence. Journal of
Accounting Research 18 (Spring): 161-190.
Simunic, D. A., and M. T. Stein. 1996. The impact of litigation risk on audit pricing: A review of economics and evidence. AUDITING: A Journal of Practice & Theory 15 (Supplement): 119-134.
Walo, J. C. 1995. The effects of client characteristic on audit scope. AUDITING: A
Journal of Practice & Theory 14 (Spring): 115-124.
White, H. 1980. A heteroskedasticity-consistent covariance matrix estimator and a direct test for heteroskedasticity. Econometrica 48: 817-838.
Willekens, M. and H. Bauwhede. 2003. Auditor reporting conservatism as a defense mechanism against increased post-Enron litigation risk. Working paper, Catholic University of Leuven, Belgium.
TABLE 1
Sample Selection: 2000 to 2003
2000 2001 2002 2003 Total
Available on S&P’s Research Insight Compustat 9,388 9,533 9,544 9,223 37,688 (Less): Financial institutions (SIC codes between
6000 and 6999) (2,181) (2,267) (2,284) (2,233) (8,965) Non fiscal year firms (or missed) (2,459) (2,398) (2,373) (2,328) (9,558) Missing data for independent variables (1,805) (1,742) (1,703) (1,910) (7,160) Audit fees unavailable (1,360) (931) (865) (760) (3,916)
TABLE 2 Descriptive Statistics
Panel A Full Sample Before Sample After Sample Period (Observations) Year 2000~2003 (8,089) Year 2000 ~ 2001 (3,778) Year 2002 ~ 2003 (4,311)
Mean Median Std. Dev. Mean Median Std. Dev. Mean Median Std. Dev. Difference in Means
LnFEES 5.725 5.537 1.230 5.585 5.375 1.165 5.848 5.700 1.272 0.263*** BIG 0.878 1.000 0.327 0.911 1.000 0.285 0.849 1.000 0.358 -0.062*** LnASSETS 19.386 19.301 2.168 19.499 19.379 2.078 19.287 19.230 2.239 -0.212*** SUBSI 12.264 5.000 24.354 12.631 5.000 24.883 11.943 4.000 23.878 -0.688 SEGMENTS 2.251 1.000 1.640 2.251 1.000 1.646 2.250 1.000 1.635 -0.001 RECINV 0.234 0.193 0.187 0.236 0.199 0.187 0.232 0.190 0.186 -0.005 ROI -0.142 0.010 0.460 -0.149 0.010 0.477 -0.135 0.010 0.445 0.014 LOSSES 0.623 1.000 0.485 0.592 1.000 0.491 0.650 1.000 0.477 0.057*** OPINION 0.420 0.000 0.494 0.215 0.000 0.411 0.599 1.000 0.490 0.384*** LEVERAGE 0.520 0.492 0.328 0.507 0.490 0.312 0.532 0.492 0.341 0.024*** Panel B Full Sample Before Sample After Sample
Period (Observations) Year 2000~2003 (8,089) Year 2000 ~ 2001 (3,778) Year 2002 ~ 2003 (4,311)
Mean Median Observations Mean Median Observations Mean Median Observatio
ns Difference in Means
LnFEES of Non Big 4(5) 4.536 4.496 987 4.555 4.504 336 4.526 4.479 651 -0.029
LnFEES of Big 4(5) 5.891 5.693 7,102 5.685 5.470 3,442 6.084 5.886 3,660 0.398 ***
Panel C (Year 2002 ~ 2003) : LnFEES in different subgroups where the auditees are clients of Big 4
FORMERAA1st (n = 422) FORMERAA2nd (n = 359) NonFORMERAA1st (n = 83) NonFORMERAA2nd (n =109 ) OTHER (n = 2,687) Mean Median Std. Dev. Mean Median Std. Dev. Mean Median Std. Dev. Mean Median Std. Dev. Mean Median Std. Dev.
TABEL 2 (continued)
Panel D:
only Big 4 (5) included Full Sample Before Sample After Sample Period (Observations) Year 2000~2003 (7,102) Year 2000 ~ 2001 (3,442) Year 2002 ~ 2003 (3,660)
Mean Median Observations Mean Median Observations Mean Median Observation
s Difference in Means
LnFEES of AUDITOR#1 5.898 5.710 2,828 5.663 5.462 1,278 6.093 5.892 1,550 0.430 ***
LnFEES of AUDITOR#1 6.028 5.819 1,755 5.818 5.565 807 6.206 6.003 948 0.388 ***
LnFEES of Non
AUDITOR#1or#2 5.787 5.568 2,519 5.628 5.421 1,357 5.972 5.802 1,162 0.344 *** *, ** and *** indicate that the differences are significantly different from zero at the 10, 5, and 1 percent levels, respectively, in two-tailed tests. LnFEES = the natural logarithm of audit fees (in thousands of dollars); BIG = 1 if the company employs a Big 4 (5) auditor, and 0 otherwise; LnASSETS = the natural logarithm of total assets; SUBSI = the number of subsidiaries; SEGMENTS = the number of business segments reported on Compustat; RECINV = the percentage of total assets in receivables and inventories; ROI = net income divided by total assets; LOSSES = 1 if the firm reports negative income in any of the previous three years, and 0 otherwise; OPINION = 1 if the firm receives a non-standard unqualified audit opinion, and 0 otherwise; LEVERAGE = total debt to total assets ;
AUDITOR#1 =1if the observation is audited by the specific Big 4 (5) audit firm that is the leader for that particular observation’s industry, and 0 otherwise; AUDITOR#2 = 1 if the observation is audited by
TABLE 3a Correlation Matrix
LnFEES BIG LnASSETS SUBSI SEGMENTS RECINV ROI LOSSES OPINION LEVERAGE
LnFEES 0.439 *** 0.855 *** 0.491 *** 0.476 *** -0.061*** 0.271 *** -0.198 *** 0.309 *** 0.166*** BIG 0.276 *** 0.462 *** 0.138 *** 0.123 *** -0.139*** 0.207 *** -0.143 *** 0.172 *** -0.108*** LnASSETS 0.832 *** 0.340 *** 0.460 *** 0.453 *** -0.160*** 0.423 *** -0.369 *** 0.288 *** 0.085*** SUBSI 0.491 *** 0.100 *** 0.463 *** 0.332 *** -0.044*** 0.124 *** -0.145 *** 0.184 *** 0.132*** SEGMENTS 0.486 *** 0.061 *** 0.441 *** 0.333 *** 0.044*** 0.179 *** -0.145 *** 0.200 *** 0.121*** RECINV 0.030 * -0.136 *** -0.121 *** -0.028 * 0.069 *** 0.126 *** -0.072 *** -0.015 0.073*** ROI 0.205 *** 0.124 *** 0.400 *** 0.139 *** 0.180 *** 0.134*** -0.333 *** -0.033 ** -0.292*** LOSSES -0.257 *** -0.085 *** -0.378 *** -0.183 *** -0.198 *** -0.168*** -0.380 *** -0.036 ** 0.079*** OPINION 0.093 *** 0.014 0.052 *** 0.017 0.084 *** -0.059*** -0.137 *** 0.100 *** 0.185*** LEVERAGE 0.280 *** -0.039 ** 0.189 *** 0.168 *** 0.213 *** 0.130*** -0.150 *** -0.018 0.203 ***
a Lower triangular contains Pearson correlation coefficients for the before Enron-Andersen period (n = 3,778) while upper triangular belongs to that of after
Enron-Andersen period (n = 4,311).
*, **, and *** indicate that the Pearson correlations are significantly different from zero at the 10, 5, and 1 percent levels, respectively, in two-tailed tests. LnFEES = natural logarithm of audit fees (in thousands of dollars); BIG = 1 if the company employs a Big 4 (5) auditor, and 0 otherwise; LnASSETS = the natural logarithm of total assets; SUBSI = the number of subsidiaries; SEGMENTS = the number of business segments reported on Compustat; RECINV = the percentage of total assets in receivables and inventories; ROI = net income divided by total assets; LOSSES = 1 if the firm reports negative income in any of the previous three years, and 0 otherwise; OPINION = 1 if the firm receives a non-standard unqualified audit opinion, and 0 otherwise; and LEVERAGE = total debt to total assets.
TABLE 4
Audit Fee Regression Models With LnFEES as The Dependent Variable
Sample Period 2000 ~ 2003 2000 ~ 2003 2002 ~ 2003
Number of Observations 8,089 8,089 3,660
Variables Coefficient p-value Coefficient p-value Coefficient p-value
Intercept -4.313 0.000 -4.134 0.000 -3.834 0.000 BIG 0.231 0.000 0.106 0.003 LnASSETS 0.458 0.000 0.454 0.000 0.463 0.000 SUBS 0.059 0.000 0.058 0.000 0.059 0.000 SEGMENTS 0.065 0.000 0.072 0.000 0.060 0.000 RECINV 0.782 0.000 0.921 0.000 0.743 0.000 ROI -0.299 0.000 -0.368 0.000 -0.292 0.000 LOSSES 0.248 0.000 0.161 0.000 0.312 0.000 OPINION 0.042 0.005 0.039 0.110 0.039 0.061 LEVERAGE 0.135 0.000 0.141 0.000 0.178 0.000 AFTER 0.354 0.000 0.096 0.601 AFTER × BIG 0.192 0.000 AFTER × LnASSETS 0.005 0.634 AFTER × SUBS 0.002 0.754 AFTER × SEGMENTS -0.013 0.185 AFTER × RECINV -0.290 0.000 AFTER × ROI 0.138 0.001 AFTER × LOSSES 0.167 0.000 AFTER × OPINION 0.003 0.935 AFTER × LEVERAGE -0.003 0.957 FORMERAA1st -0.205 0.000 FORMERAA2nd -0.020 0.539 NonFORMERAA1st -0.087 0.191 NonFORMERAA2nd 0.078 0.200 Adjusted R2 77.6% 77.9% 75.6% F-statistic (p-value) 2,810.5 (.000) 1,499.9 (.000) 945.9 (.000)
Variable definition: LnFEES = the natural logarithm of audit fees (in thousands of dollars); BIG = 1 if the company employs a Big 4 (5) auditor, and 0 otherwise; LnASSETS = the natural logarithm of total assets; SUBSI = number of subsidiaries;
SEGMENTS = number of business segments reported on Compustat; RECINV = percentage of total assets in receivables and
inventories; ROI = net income divided by total assets; LOSSES = 1 if the firm reports negative income in any of the previous three years, and 0 otherwise; OPINION = 1 if the firm receives a non-standard unqualified audit opinion, and 0 otherwise;
LEVERAGE = total debt to total assets; AFTER = 1 if the data belongs to the year 2002 or 2003, and 0 otherwise. All tests are
TABLE 5 Robustness Analysis
Regression Models for Firms Which Existed in Every Year in the Sample Period
Sample Period 2000 ~ 2003 2000 ~ 2003 2002 ~ 2003
Number of Observations 5,330 5,330 2,503
Variables Coefficient p-value Coefficient p-value Coefficient p-value
Intercept -5.152 0.000 -5.128 0.000 -4.511 0.000 BIG 0.139 0.000 0.078 0.162 LnASSETS 0.502 0.000 0.505 0.000 0.498 0.000 SUBS 0.049 0.000 0.050 0.000 0.050 0.000 SEGMENTS 0.071 0.000 0.075 0.000 0.065 0.000 RECINV 0.973 0.000 1.081 0.000 0.829 0.000 ROI -0.460 0.000 -0.524 0.000 -0.394 0.000 LOSSES 0.238 0.000 0.151 0.000 0.305 0.000 OPINION 0.000 0.995 -0.006 0.839 0.018 0.477 LEVERAGE 0.131 0.000 0.090 0.090 0.156 0.001 AFTER 0.403 0.000 0.350 0.159 AFTER × BIG 0.106 0.152 AFTER × LnASSETS -0.005 0.723 AFTER × SUBS -0.001 0.911 AFTER × SEGMENTS -0.009 0.409 AFTER × RECINV -0.243 0.026 AFTER × ROI 0.120 0.077 AFTER × LOSSES 0.174 0.000 AFTER × OPINION 0.024 0.543 AFTER × LEVERAGE 0.058 0.401 FORMERAA1st -0.216 0.000 FORMERAA2nd -0.028 0.438 NonFORMERAA1st -0.067 0.411 NonFORMERAA2nd 0.055 0.561 Adjusted R2 77.9% 78.0% 76.8% F-statistic (p-value) 1,870.4 (.000) 992.6 (.000) 690.0 (.000)
Variable definition: LnFEES = the natural logarithm of audit fees (in thousands of dollars); BIG = 1 if the company employs a Big 4 (5) auditor, and 0 otherwise; LnASSETS = the natural logarithm of total assets; SUBSI = the number of subsidiaries;
SEGMENTS = the number of business segments reported on Compustat; RECINV = the percentage of total assets in receivables
and inventories; ROI = net income divided by total assets; LOSSES = 1 if the firm reports negative income in any of the previous three years, and 0 otherwise; OPINION = 1 if the firm receives a non-standard unqualified audit opinion, and 0 otherwise;
LEVERAGE = total debt to total assets; AFTER = 1 if the data belongs to the year 2002 or 2003, and 0 otherwise. All tests are
TABLE 6
The One-Year and Two-Year Effects of The Enron-Andersen Affair
Sample Period One-Year Effect 2000, 2001, and 2002 Two-Year Efffect 2000, 2001, and 2003 One-Year Effect 2000, 2001, and 2002 Two-Year Efect 2000, 2001, and 2003 (Number of Observations) (6,097) (5,770) (6,097) (5,770)
Variables Coeff. p-value Coeff. p-value Coeff p-value Coeff p-value Intercept -4.255 0.000 -4.275 0.000 -4.134 0.000 -4.134 0.000 BIG 0.199 0.000 0.202 0.000 0.106 0.003 0.106 0.003 LnASSETS 0.456 0.000 0.457 0.000 0.454 0.000 0.454 0.000 SUBS 0.059 0.000 0.059 0.000 0.058 0.000 0.058 0.000 SEGMENTS 0.068 0.000 0.067 0.000 0.072 0.000 0.072 0.000 RECINV 0.825 0.000 0.847 0.000 0.921 0.000 0.921 0.000 ROI -0.321 0.000 -0.337 0.000 -0.368 0.000 -0.368 0.000 LOSSES 0.217 0.000 0.222 0.000 0.161 0.000 0.161 0.000 OPINION 0.048 0.007 0.044 0.017 0.039 0.110 0.039 0.111 LEVERAGE 0.142 0.000 0.128 0.000 0.141 0.000 0.141 0.000 AFTER 0.285 0.000 0.432 0.000 0.053 0.808 0.163 0.478 AFTER × BIG 0.183 0.001 0.216 0.000 AFTER × LnASSETS 0.003 0.788 0.004 0.752 AFTER × SUBS 0.002 0.790 0.003 0.745 AFTER × SEGMENTS -0.012 0.309 -0.014 0.243 AFTER × RECINV -0.278 0.003 -0.272 0.006 AFTER × ROI 0.119 0.007 0.126 0.047 AFTER × LOSSES 0.157 0.000 0.182 0.000 AFTER × OPINION 0.017 0.641 0.005 0.891 AFTER × LEVERAGE 0.015 0.785 -0.028 0.633 Adjusted R2 77.3% 77.5% 77.4% 77.8% F-statistic (p-value) 2,071.7 (.000) 1,991.6 (.000) 1,102.9 (.000) 1,062.4 (.000)
Variable definition: LnFEES = the natural logarithm of audit fees (in thousands of dollars); BIG = 1 if the company employs a Big 4 (5) auditor, and 0 otherwise; LnASSETS = the natural logarithm of total assets; SUBSI = the number of subsidiaries;
SEGMENTS = the number of business segments reported on Compustat; RECINV = the percentage of total assets in receivables
and inventories; ROI = net income divided by total assets; LOSSES = 1 if the firm reports negative income in any of the previous three years, and 0 otherwise; OPINION = 1 if the firm receives a non-standard unqualified audit opinion, and 0 otherwise;
LEVERAGE = total debt to total assets; AFTER = 1 if the data belongs to the year 2002 or 2003, and 0 otherwise. All tests are
TABLE 7
Analysis of Industry Expertise (non-Big 4(5) Observations Excluded)
Sample Period Full Big 4(5) 2000 ~ 2003 Lower Half 2000 ~ 2003 Upper Half 2002 ~ 2003 Number of Observations 7,102 3,551 3,551
Variables Coefficient p-value Coefficient p-value Coefficient p-value
Intercept -4.134 0.000 -1.547 0.000 -6.590 0.000 AUDITOR#1 -0.059 0.007 -0.014 0.591 -0.093 0.005 AUDITOR#2 -0.031 0.228 -0.036 0.272 -0.058 0.112 LnASSETS 0.460 0.000 0.325 0.000 0.573 0.000 SUBS 0.055 0.000 0.044 0.000 0.046 0.000 SEGMENTS 0.073 0.000 0.038 0.000 0.071 0.000 RECINV 1.011 0.000 0.829 0.000 1.355 0.000 ROI -0.397 0.000 -0.267 0.000 -0.386 0.000 LOSSES 0.160 0.000 0.196 0.000 0.125 0.000 OPINION 0.034 0.183 0.028 0.425 0.002 0.950 LEVERAGE 0.162 0.000 0.140 0.002 0.202 0.003 AFTER 0.255 0.217 -0.395 0.289 -0.092 0.814 AFTER × AUDITOR#1 0.031 0.330 0.061 0.114 -0.015 0.762 AFTER × AUDITOR#2 0.016 0.664 0.054 0.247 -0.006 0.904 AFTER × LnASSETS 0.006 0.604 0.043 0.033 0.018 0.347 AFTER × SUBS 0.003 0.719 0.008 0.607 0.001 0.943 AFTER × SEGMENTS -0.013 0.203 -0.021 0.159 -0.008 0.525 AFTER × RECINV -0.241 0.005 -0.330 0.001 -0.149 0.296 AFTER × ROI 0.100 0.032 0.132 0.006 0.173 0.250 AFTER × LOSSES 0.156 0.000 0.119 0.005 0.166 0.000 AFTER × OPINION -0.005 0.891 -0.006 0.887 0.129 0.007 AFTER × LEVERAGE 0.007 0.896 0.045 0.471 -0.024 0.788 Adjusted R2 76.2% 41.6% 70.7% F-statistic (p-value) 1,085.4 (.000) 121.5 (.000) 408.1 (.000)
Variable definition: LnFEES = the natural logarithm of audit fees (in thousands of dollars); BIG = 1 if the company employs a Big 4 (5) auditor, and 0 otherwise; LnASSETS = the natural logarithm of total assets; SUBSI = the number of subsidiaries;
SEGMENTS = the number of business segments reported on Compustat; RECINV = the percentage of total assets in receivables
and inventories; ROI = net income divided by total assets; LOSSES = 1 if the firm reports negative income in any of the previous three years, and 0 otherwise; OPINION = 1 if the firm receives a non-standard unqualified audit opinion, and 0 otherwise;
LEVERAGE = total debt to total assets; AFTER = 1 if the data belongs to the year 2002 or 2003, and 0 otherwise; AUDITOR#1
=1if the observation is audited by the specific Big 4 (5) audit firm that is the leader for that particular observation’s industry, and 0 otherwise; AUDITOR#2 = 1 if the observation is audited by second-ranked Big 4 (5) audit firm in that particular industry, and 0 otherwise. All tests are based on White (1980).
TABLE 8
Further Analysis of Industry Expertise
Sample Period Full Big 4(5) 2000 ~ 2003 Lower Half 2000 ~ 2003 Upper Half 2002 ~ 2003 Number of Observations 7,102 3,551 3,551
Variables Coefficient p-value Coefficient p-value Coefficient p-value
Intercept -4.136 0.000 -1.559 0.000 -6.606 0.000 AUDITOR#1or#2 -0.048 0.015 -0.022 0.353 -0.079 0.008 LnASSETS 0.460 0.000 0.326 0.000 0.574 0.000 SUBS 0.055 0.000 0.044 0.000 0.046 0.000 SEGMENTS 0.073 0.000 0.038 0.000 0.072 0.000 RECINV 1.012 0.000 0.829 0.000 1.357 0.000 ROI -0.397 0.000 -0.267 0.000 -0.386 0.000 LOSSES 0.159 0.000 0.196 0.000 0.125 0.000 OPINION 0.033 0.190 0.029 0.409 0.002 0.965 LEVERAGE 0.161 0.000 0.140 0.002 0.202 0.003 AFTER 0.253 0.221 -0.382 0.303 -0.094 0.811 AFTER × AUDITOR#1or#2 0.025 0.387 0.058 0.096 -0.012 0.793 AFTER × LnASSETS 0.006 0.597 0.042 0.034 0.018 0.345 AFTER × SUBS 0.003 0.727 0.008 0.604 0.000 0.960 AFTER × SEGMENTS -0.013 0.190 -0.021 0.161 -0.008 0.495 AFTER × RECINV -0.240 0.005 -0.335 0.001 -0.144 0.313 AFTER × ROI 0.100 0.031 0.133 0.006 0.176 0.242 AFTER × LOSSES 0.157 0.000 0.117 0.005 0.166 0.000 AFTER × OPINION -0.004 0.910 -0.007 0.867 0.130 0.007 AFTER × LEVERAGE 0.007 0.896 0.046 0.461 -0.023 0.804 Adjusted R2 76.2% 41.6% 70.7% F-statistic (p-value) 1,199.7 (.000) 134.2 (.000) 450.9 (.000)
Variable definition: LnFEES = the natural logarithm of audit fees (in thousands of dollars); BIG = 1 if the company employs a Big 4 (5) auditor, and 0 otherwise; LnASSETS = the natural logarithms of total assets; SUBSI = the number of subsidiaries;
SEGMENTS = the number of business segments reported on Compustat; RECINV = the percentage of total assets in receivables
and inventories; ROI = net income divided by total assets; LOSSES = 1 if the firm reports negative income in any of the previous three years, and 0 otherwise; OPINION = 1 if the firm receives a non-standard unqualified audit opinion, and 0 otherwise;
LEVERAGE = total debt to total assets; AFTER = 1 if the data belongs to the year 2002 or 2003, and 0 otherwise.
AUDITOR#1or#2 =1if the observation is audited by the specific Big 4 (5) audit firm that is the leader or second-ranked for that