國立臺灣大學生命科學院植物科學研究所 碩士論文
Graduate Institute of Plant Biology College of Life Science National Taiwan University
Master Thesis
文心蘭 ascorbate peroxidase 對阿拉伯芥在中高溫生長下 對於開花機制的調控功能
Molecular function of Oncidium ascorbate peroxidase on thermal-induced flowering process in
Arabidopsis thaliana
黃柏睿 Bo-Ruei Huang
指導教授:葉開溫 博士 Advisor: Kai-Wun Yeh, Ph.D.
中華民國 100 年 7 月 July, 2011
1
Table of the Content
Chinese Abstract ... 8
English Abstract ... 9
1. Introduction ... 11
1.1 Oncidium Grower ramsey ... 12
1.2 The Current Work on Oncidium Phase Transition ... 13
1.3 Regulatory Pathways of Flowering ... 16
1.3.1 Research of Flowering Time in the Pre-molecular Biology Era ... 16
1.3.2 Regulation of Flowering by Day Length ... 17
1.3.3 Gibberellic Acid Pathway: A Hormonal-Controlled Flowering ... 18
1.3.4 Autonomous Pathway of Flowering ... 19
1.3.5 Effect of Ambient Temperature on flowering ... 20
1.3.5.1 Effect of Vernalization on Flowering ... 20
1.3.5.2 Thermal-induced flowering ... 21
1.4 Ascorbate: An Emerging Field in the Regulation of Flowering Time ... 22
1.4.1 Physiological Functions of Ascorbate ... 22
1.4.2 Ascorbate: A Negative Regulator of the Phase Transition in Planta ... 23
1.5 The Bridge between Ascorbate and Flowering ... 25
1.5.1 The Issue of Ascorbate Peroxidase ... 25
1.5.2 Hierarchy of Hydrogen Peroxide, Ascorbate and Ascorbate Peroxidase in Flowering process ... 26
1.6 Goals of This Thesis ... 27
2. Results………. 28
2.1 Characterization of Transgenic Arabidopsis Overexpressing Oncidium Ascorbate Peroxidase ... 28
2.1.1 Generation of Transgenic Arabidopsis Overexpressing Oncidium Ascorbate Peroxidase ... 28
2.1.2 Morphological Characterization of OgAPXOX Transgenic Plants ... 29
2.1.3 Effects of Oncidium Ascorbate Peroxidase on Ascorbate Homeostasis and H2O2 Level under Different Environmental Condition in Arabidopsis ... 29
2
2.1.4 Effect of Oncidium Ascorbate Peroxidase on Flowering Time under
Different Environmental Condition in Arabidopsis ... 31
2.2 Genetic Network of Ascorbate Peroxidase Involving in Thermal-induced Flowering Process ... 34
2.2.1 Decreased Expression Level of FLM in OgAPXOX Plants Suggests the Role of AsA in Regulating Thermal-induced Flowering ... 34
2.2.2 Transcriptional Profiling of OgAPXOX Arabidopsis under Elevated Growth Temperature ... 35
2.2.3 Functional Categories of Expression Clusters in Accordance with Genotypes and Growth Temperature Condition ... 45
2.2.4 Transcription Profiling Revealed That Genes Encoding MYB and AP2 TFs Expressed with Higher/ Lower in OgAPXOX Plants under Elevated Growth Temperature ... 46
2.2.5 Genes Involving in Circadian Rhythm and Starch Synthesis Were Significantly Altered in APXOX Plant under Elevated Growth Temperature ………..48
2.2.6 Quantification of Expression Level of Candidate Genes by Real-time PCR ... 49
2.2.7 Expression Profiling of Candidate Genes in AsA Deficient or Accumulated Mutants ... 51
3. Discussion………... 52
4. Prospective ... 59
5. Materials and Methods ... 61
5.1 Plant Materials and Growth Conditions ... 61
5.2 RNA Extraction, Microarray and qPCR ... 62
5.3 Ascorbate Peroxidase Activity Analysis ... 63
5.4 Ascorbate Measurement ... 65
5.5 Hydrogen Peroxide Measurement ... 68
5.6 Hydrogen Peroxide Staining ... 71
5.7 Quantitative Analysis of Protein Concentration ... 72
5.8 RNA Extraction ... 73
5.9 RT PCR for Gene Expression (One-step RT PCR) ... 77
3
5.10 Construction of Functional Plasmid for Overexpressing the Interested Genes in Arabidopsis ... 78 5.11 Agrobacterium Infiltration (Host: Arabidopsis thaliana Col.) ... 85 References ………. 88
4
List of Tables
Table 1. GO analysis of cluster 1 ... 95
Table 2. GO analysis of cluster 2 ... 98
Table 3. GO analysis of cluster 3 ... 100
Table 4. GO analysis of cluster 4 ... 101
Table 5. GO analysis of cluster 5 ... 102
Table 6. GO analysis of cluster 6 ... 105
Table 7. GO analysis of cluster 7 ... 107
Table 8. GO analysis of cluster 8 ... 110
Table 9. GO analysis of cluster 9 ... 112
Table 10. GO analysis of cluster 10 ... 114
Table 11. Transcriptional profiling of MYB or MYB-like transcription factors. ... 116
Table 12. Transcriptional profiling of AP2-like transcription factors... 118
Table 13. Transcriptional profiling of circadian genes. ... 120
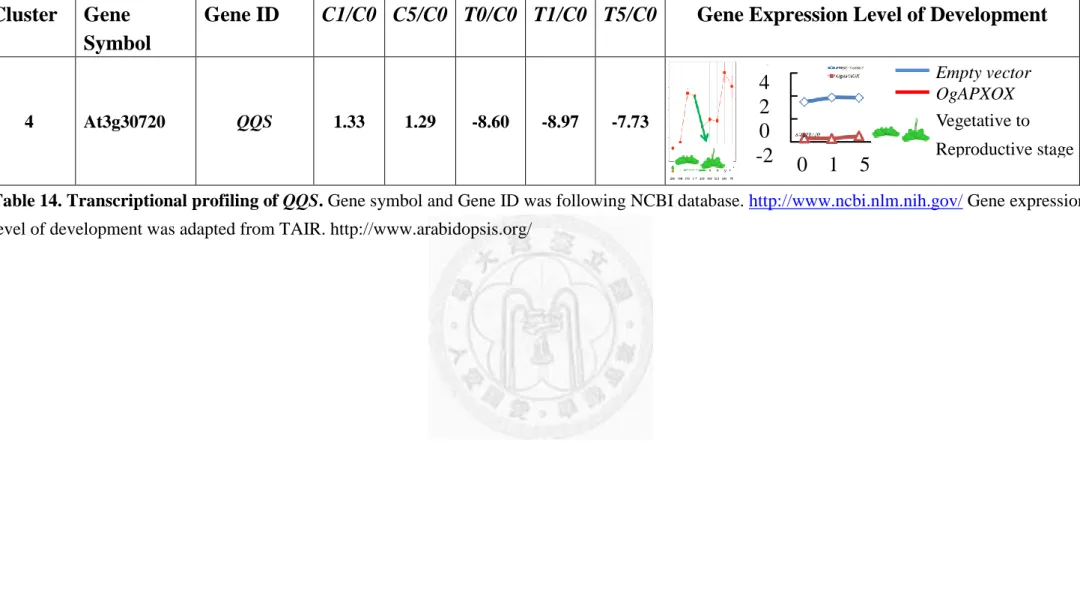
Table 14. Transcriptional profiling of QQS. ... 121
5
List of Figures
Figure 1.The enzymatic activity and expression level of APX in several independent lines ... 122 Figure 2. The foliar phenotype and H2O2 content in transgenic and control plants
growing under long-day photoperiod and 22°C condition. ... 123 Figure 3. The chlorophyll content of control and transgenic plants. ... 124 Figure 4. The AsA level in transgenic and control plants growing under 22°C condition
and long-day photoperiod. AsA content in 4 leaves of transgenic and control plants growing under 22°C condition and long-day
photoperiod………125 Figure 5. The H2O2 content in transgenic and control plants growing under long-day
photoperiod and 22°C condition. ... 126 Figure 6. The AsA level in transgenic and control plants growing under 22°C condition
and short-day photoperiod. ... 127 Figure 7. The H2O2 content in transgenic and control plants growing under 22°C
condition and short-day photoperiod. ... 128 Figure 8. H2O2 level in wild type and OgAPXOX transgenic Arabidopsis after elevating
growth temperature to 30°C. ... 129 Figure 9. AsA content in transgenic plants OgAPXOX after heat treatment. ... 130 Figure 10. The AsA redox ratio in transgenic plants OgAPXOX after elevating growth
temperature to 30°C. ... 131 Figure 11. The higher growth temperature brought about drastic decrease of AsA level
in wild type and transgenic plants. ... 132 Figure 12. The number of rosette leaves at the time of flowering in OgAPXOX and
control plants. ... 133 Figure 13. The phenotype of transgenic Arabidopsis and control plants growing under
6
short-day photoperiod and 22°C condition. ... 134 Figure 14. The flowering time of transgenic Arabidopsis and control plants growing
under 22°C condition and short-day photoperiod. ... 135 Figure 15. The phenotype of transgenic Arabidopsis and control plants growing under
30°C condition and long-day photoperiod. ... 136 Figure 16. The percentage of rosette leave number when flowering in transgenic
Arabidopsis and control plants growing under 30°C condition and long-day photoperiod. ... 137 Figure 17. OgAPXOX transgenic plants exhibited the shorter length of inflorescence
stem. ... 138 Figure 18. The phenotype of transgenic Arabidopsis and control plants growing under
30°C condition and short-day photoperiod. ... 139 Figure 19. The percentage of rosette leave number when flowering in OgAPXOX and
control plants growing under 30°C condition and short-day photoperiod.
... 140 Figure 20. Relative expression levels of thermal sensitivity gene FLOWERING LOCUS
M (FLM) in wild type and transgenic plants under elevated growth
temperature. ... 141 Figure 21. Clustering analysis of 860 transcripts which displayed up- or down-
regulated 2 fold levels between each samples with CK under LD-22°C at 0 day. ... 143 Figure 22. Functional categories of expression clusters in accordance with genotypes
and growth temperature condition. ... 144 Figure 23. Relative expression levels of AP2 transcription factors in wild type and
transgenic plants under elevated growth temperature. ... 145 Figure 24. Relative expression levels of circadian genes in wild type and transgenic
plants under elevated growth temperature. ... 146
7
Figure 25. Relative expression levels of AtMYB70 and QQS in wild type and transgenic plants under elevated growth temperature. ... 147 Figure 26. Relative expression levels of qua-quine starch (QQS) in three independent
lines. ... 148 Figure 27. Relative expression levels of AP2 transcription factors in vtc1 or OgPMEOX
mutants. ... 149 Figure 28. Relative expression levels of circadian genes in vtc1 or OgPMEOX mutants.
... 150 Figure 29. Relative expression levels of AtMYB70 and QQS in vtc1 or OgPMEOX
mutants ... 151 Figure 30. Proposal model of genetic network for activated APX in modulating
flowering process ... 152
List of Appendixes
Appendix 1. The oligonucleotides used for RT-PCR and qRT-PCR. ... 153 Appendix 2. Schematic representation of ascorbate homeostasis in pseudobulb cell of
Oncidium orchid in three developmental stages. ... 154 Appendix 3. Ascorbate oxidation and regeneration from monodehydroascorbate and
dehydroascorbate……….155 Appendix 4. Abbreviation…...……….156
8
中文摘要
南西文心蘭 (Oncidium Gower ramsey) 是亞洲的重要經濟花卉。前人研究指出,
維他命 C 對於開花調節扮演著負調節的角色,然而,文心蘭生長在日∕夜溫度 30/25˚C 較生長於 25/20˚C 環境中,明顯有較高的開花比例。因為較高的生長溫度 可以有效地誘導維他命 C 過氧化氫酶 (OgAPX)的基因表現量與提高其活性,進而 使大量的維他命 C (ascorbate)被消耗掉。為了解維他命 C 在熱誘導開花中所扮演的 角色,我們在阿拉伯芥中大量表現 OgAPX。結果發現,轉殖植物(OgAPXOE)在 22˚C 的生長環境下,其形態上與野生型(control)並無顯著差異。然而提高其生長溫度至 30˚C 時,發現其較野生型有提早開花與較少的葉綠素累積。利用 microarray 分析 受熱與維他命 C 共同影響的基因,發現這些基因主要種類為:氧化還原酶 (oxidoreductase)、老化、防禦、訊號傳遞以及轉錄因子。進一步利用 real-time PCR 檢測下述之基因表現量,包括 AtMYB70、At3g30720、參與 circadian rhythms 以及 含有 AP2-domain 等基因。結果顯示,這些基因在較高的生長溫度中的表現情量確 實較高∕較低。而這些基因於 vtc1 (維他命 C 含量僅有野生型 30%的突變株)也有類 似的較高表現量,而在 OgPMEOX 轉植株 (大量累積維他命 C 的轉殖株)當中卻有 較低的表現量,這些證據顯示這類基因表現確實是受到內生性維他命 C 的含量所 調控。綜合所有結果,我們推論維他命 C 參與在熱誘導開花過程可誘發較上游的 開花相關基因之表現,上述基因皆屬於目前所有已知開花調控機制的較上游調控 因子,此外,我們亦推論:在熱誘導開花中,醣類(sugar/energy)亦可能具有調節開 花機制之功能。
9
Abstract
Oncidium Gower ramsey is an economically important cutting flower in orchid
industry. Mild increase of growth temperature is effective to promote Oncidum
flowering, in example of elevating day/night temperature from 25˚C/20˚C to 30˚C /25˚C.
Our previous studies have revealed that higher growth temperature also induced the
expression of ASCORBATE PEROXIDASE (OgAPX) and resulted in the deprivation of
ascorbate (AsA) level. In order to decipher the underlying role of AsA under
thermal-regulated flowering, OgAPX was overexpressed in Arabidopsis. There was no
significant change on morphology between transgenic and control plants when growing under 22˚C. The OgAPXOE transgenic plants exhibited precocious flowering and
reduction of chlorophyll content compared with control when growing at 30˚C
condition. Microarray analyses of transgenic and control plants growing at 22˚C
condition displayed differential expression patterns of genes to plants growing at 30˚C
in categories in oxidoreductase, senescence, defense, signal transduction and
transcription factors. AtMYB70, AP2, circadian genes and At3g30720, which displayed
up/down-regulated expression pattern under elevated growth temperature condition
were further validated by quantitative RT-PCR. Moreover, their expression levels were
10
associated with the endogenous AsA level and displayed up-regulation level in
ascorbate-deficient mutant, vtc1, but down-regulated level in ascorbate-accumulated
transgenic plants, OgPMEOX. Noteworthy, attenuated expression level of At3g30720
encoding qua-quine starch (QQS) which acting on starch biosynthesis, provides a
regulatory function of AsA state on the cross-talk of thermal- and energy-regulated
flowering. Taken together, our results bring about a genetic network of flowering
mechanism orchestrated by the elevated growth temperature.
11
1. Introduction
Oncidium Gower ramsey in Taiwan is a high-value flower with a net value of
nearly US$7.35 million annually. In 2008, Oncidium cut-flowers made up 41.7% of the
market for cut-flowers in Taiwan. One of the most important strategies to keep Taiwan
as the leading producer of Oncidium in the world is to control Oncidium flowering time
to meet market demand. However, Oncidium flowering time is controlled by the
environmental factors that have intrigued and puzzled phytologists, and the control is
different from flowering controls of Phalaenopsis, Dendrobium and other Orchidaceae
species (Lopez and Runkle, 2005). Studies from Arabidopsis have revealed four
flowering time regulatory pathways, including photoperiod pathway, gibberellin
pathway, the autonomous pathway, and the vernalization pathway (Mouradov et al.,
2002). In the last decades, it has been paid attention to the strong effect of ambient
growth temperature on flowering because of the acute changes in global climate (Long
and Ort, 2010). The thermal-induced flowering would reduce the net yield attributing to
the much shorter vegetative growth for accumulating photosynthesis product. The detail
mechanism of thermal-induced flowering is still unclear, but increased ROS under
elevated growth temperature in plant was perceived as a determinant molecule to trigger
12
flowering (Balasubramanian et al., 2006; Chin et al., unpublished). Ascorbate (AsA) is
an important antioxidant for ROS scavenge, and has been well-identified as a repressor
in flowering process (Shen et al., 2009). This study declares in-depth discussions on
orchestration of AsA level and ambient temperature on the flowering process.
1.1 Oncidium Grower ramsey
People have been fascinated by the beauty and mystery of orchids for a very long
history in Western and Eastern cultures. Orchid varieties have become one of the largest
in floriculture throughout the world. Propagation of orchids became possible because of
the breakthrough in tissue culture techniques and promotes large-scale cultivation of
cuts or potted plants in Taiwan, Netherlands, Germany, Thailand, and United States.
Today, orchid cut-flowers of Oncidium and potted plants of Phalaenopsis had
contributed substantially to the economy in Taiwan.
Oncidium “Gower ramsey” is a hybrid orchid produced by crossing two species
of the same genus: Oncidium Goldiana × Oncidium Guiena gold. Its name was derived from the Greek word „onkos‟, meaning “swelling”. Diverse color in Oncidium lips likes
a dancing girl known “Dancing Lady” orchids. Oncidium has an enlarged bulb structure
13
at the base of their leaves, termed a pseudobulb. The genus Oncidium (Oncidium spp.)
is a thin-leaf, sympodial orchid which was native to tropical and subtropical America‟s
epiphytic orchids, including Florida, Mexico, Central America, West Indies, Brazil,
Peru, Bolivia and Taiwan. Oncidium was mostly planted in Nantou and Pingtung. The
marketable potential for Oncidium Gower ramsey is its long inflorescence for
cut-flowers. The export of Oncidium cut-flowers into Japan had been increasing steadily
from 2002 to 2007. Base on the Japanese flower auction sale figure for 2007, Oncidium
cut-flowers from Taiwan accounted for 87.6% of the total market share. Japan is now
the major market for Oncidium cut-flowers, and the status and future development of
the Oncidium industry in Taiwan is indeed bright.
1.2 Current Work on Oncidium Phase Transition
The pseudobulb of Oncidium is hetroblastic (single internode) type and numerous
studies revealed that carbohydrates and minerals transported from leaves into
developing pseudobulb organ (Yong and Hew, 1995). Tan and coworkers (2005)
reported that peroxidase, sodium/dicarboxylate cotransporter, and mannose-binding
lectin were highly expressed during bolting by subtracting RsaI-digested cDNAs of leaf
14
from those of pseudobulb (Tan et al., 2005). Moreover, fluctuate expression levels of
genes relating to mannan, pectin, and starch and sucrose biosynthesis inferred a
differential requirement of carbohydrate for vegetative and reproductive growth (Wang
et al., 2008).
Pectin and mannan were two important resources for AsA biosynthesis (Wang et
al., 2008), and the higher AsA was also present in the pseudobulb of Oncidium at
vegetative stage (Shen et al., 2009). Moreover, Oncidium sprayed with AsA, displayed
delayed flowering time compared with plants sprayed with water. The endogenous AsA
in longer vegetative (LV) Oncidium variety was obviously higher than wild type and
showed dramatic reduction on flowering (Shen and Yeh, 2010). Apparently, these
results discloses the criterion of the AsA level on Oncidium flowering and pointed out
possible regulation mechanism of phase transition triggered by redox signals
information concerning the changing environmental conditions (Shen et al., 2009).
In Appendix 2, the proposed model hypothesizes the control of the phase
transition by AsA homeostasis at different growth stages in Oncidium (Shen and Yeh,
2010).
The sucrose transported from epiphytic leaves to the pseudobulb, which was
15
preferentially converted to precursors of mannan and pectin. Copious pectin was
demethylated by pectin methylesterase (PME) during cell wall enlargement process in
young pseudobulbs. Concomitant with the degradation of pectin, methanol was
generated. During detoxified process, the methanol converted to H2O2 and
formaldehyde by alcohol oxidase. Furthermore, H2O2 could trigger the expression of
AsA biosynthetic genes including of Smirnoff-Wheeler pathway and prevent the excess
of ROS level. At bolting period, the pectin and mannan decreased gradually and
converted to starch. While a presumable increase of calcium conjugation with cell wall
could result in rigid cell wall which prevented from cell elongation by digest pectin.
Less pectin content would result in a decrease of byproduct from the demethylation of
pectin, including of methanol and H2O2. It also affected the AsA biosynthesis cascades.
Noteworthily, higher OgAPX activity was also present in Oncidium during bolting. It is
possible that it not only scavenges ROS but also reduces the AsA redox ratio and
presumably brought about the bolting (Shen et al., 2009). Moreover, the increase of
starch was further generated and utilized in the pseudobulb to provide energy for floral
development in comparison with deprivation of pectin and AsA (Shen and Yeh, 2010).
Noteworthily, Chin et al indicated the higher activity of APX was apparent in
16
Oncidium, while growing under elevated growth temperature condition, such as
30˚C/25˚C (day/night temperature) and exhibited the higher bolting percentage (95%)
comparing to bolting percentage either at 25˚C/20˚C (50%) or 20˚C /15˚C (35%) (Chin
et al., unpublished data). Thermal-induced flowering has been validated in Arabidopsis
(Shen et al., 2009), and Chin et al disclosed the presumable role of AsA state on the
thermal-induced phase transition of Oncidium (Chin et al., unpublished). Therefore,
APX, an important enzyme on fluctuating AsA redox ratio, has been perceived as a
critical determinant in flowering process in response to versatile environment event
(Chin et al., unpublished data).
1.3 Regulatory Pathways of Flowering
1.3.1 Research of Flowering Time in the Pre-molecular Biology Era
The control of flowering time is an important topic, and plants can be further
classified as long-day plants and short-day plants according to their photoperiod
responses. The essential distinction between long-day and short-day plants is that
flowering in long-day plants is promoted only when the day length exceeds a certain
duration, called the critical day length, in every 24-hour cycle; whereas promotion of
17
flowering in short-day plants requires a day length that is less than the critical day
length. Mouradov provided extensive discussions of flowering pathway and identified
to the photoperiod, gibberellin, vernalization, and autonomous and pathways attributing
to numerous forward and reverse genetic evidences (Mouradov et al., 2002).
1.3.2 Regulation of Flowering by Day Length
Circadian rhythms have a period length of 24 h. Plants are sensitive to light only
at certain times of the day-night cycles. The CO was perceived a determinant gene in
response to different photoperiod affecting flowering. It encodes a putative zinc finger
transcription factor, and its expression was controlled by circadian clock protein, such
as GIGANTEA (GI), FLAVIN-BINDING, KELCH REPEAT, F-BOX 1 (FKF1), and
CYCLING DOF FACTOR1 (CDF1). The FKF-GI complexes repress CDF1 and bring
about CO gene expression. However, stability of CO protein also depends on the
photoreceptor-debilitating proteasome. The decrease of CO protein by PHYB would
be repressed when plant present more CRYs and PHYA protein under long-day
photoperiod. Moreover, COP1 was perceived as a negative regulator of CO, and CRY
protein also inhibit the transport of the E3 ubiquitin ligase-COP1 complex into the
18
nucleus. Apparently, photoreceptor could prevent the excess ubiquitination of the CO
protein under LD condition. The accumulation of CO protein triggers a systemic
flower-induced signal in the leaves and further promotes the expression level of
FLOWERING LOCUS T (FT) transcription. FT, acting as a long distance signal
transducer “florigen”, moves through the phloem from the leaves to the apex. FT
interacts with the meristem-specific bZIP transcription factor FD and conveys the
flowering information from leaves to the shoot apical meristem. Subsequently, the
integrator genes, such as SUPPRESSOR OF OVEREXPRESSION OF CONSTANS 1
(SOC1) and LEAFY (LFY), would be turned on and further promote flowering. It
shows that the blossoming under differential photoperiod is tightly controlled by the
series signaling cascades (Srikanth and Schmid, 2011).
1.3.3 Gibberellic Acid Pathway: A Hormonal-Controlled Flowering
Gibberellin affects the flowering of short-day plant and was perceived by
GIBBEREKKIC INSENSITIVE DWARF 1 (GID), which induced the ubiquitination of
DELLA proteins and brought about the degradation by 26S proteasome. In previous
studies, exogenous application of GA could increase expression level of LFY in
19
short-day photoperiod (Blazquez et al., 1998). Interestingly, the R2R3 type MYB
transcription factors had been implicated in GA signaling (Gocal et al., 2001; Millar and
Gubler, 2005; Millar et al., 2010). MYB33 was induced by GAs in Arabidopsis apex, but
MYB33 and its paralogs, MYB65 and MYB101, would be down-regulated by miR159.
Interestingly, miR159 was also shown to be down-regulated by the DELLA proteins.
Taken together, GA mediates miR159 by repressing DELLA proteins and results in
promoting MYBs to trigger LFY in the meristem (Gocal et al., 2001; Millar and Gubler,
2005; Millar et al., 2010)
.
1.3.4 Autonomous Pathway of Flowering
The autonomous pathway was different from other environmental factors with
internal signals for regulating flowering (Koornneef et al., 1998). FCA/FY interaction
was required for autoregulation of FCA expression and carried out the binding of the
proximal polyadenylation site of FLC transcript resulting in the down-regulation of FLC
(Ausin et al., 2004). Another FLC repressor, FLD, was shown to prevent
hyperacetylation of FLC locus. FPA would express throughout the whole life of plant,
in particular in newly formed tissues and meristems. FPA and FCA were shown to act
20
in a partially redundant function to control RNA-mediated chromatin silencing of FLC
(Schomburg et al., 2001). All of above evidences showed that genes in the autonomous
pathway normally repress the floral repressor FLC by regulating chromatin remodelling
and affect RNA processing.
1.3.5 Effect of Ambient Temperature on flowering
1.3.5.1 Effect of Vernalization on Flowering
The exposure to prolonged periods of cold, winter temperatures is an important
signal to ensure plants flower in the next spring. This process was called vernalization.
Analysis of the genetic differences between rapid cycling and winter-annual varieties of
Arabidopsis thaliana revealed that FRIGIDA (FRI) mediated vernalization via FLC for
winter-annual life history (Johanson et al., 2000) FRI protein interacted with the cap
binding complex (CBC) and further up-regulated FLC shown to block the
transcriptional activation of SOC1. Genetic screen of flowering time mutants affected
by temperature exhibited VERNALIZATION 1 (VRN1), VERNALIZATION 2 (VRN2)
and VERNALIZATION 3 (VRN3) were the up-stream hierarchy to repress FLC (Bond et
al., 2009) at the end of vernalization. VIN3 established the initial silence of FLC, and
21
VRN1 and VRN2 maintained the epigenetic repression of FLC, even after the
temperatures became warmer.
1.3.5.2 Thermal-induced flowering
Besides the vernalization, elevated growth temperature had a marked effect on
flowering. Two Arabidopsis ecotypes, Landsberg erecta (Ler) and Columbia (Col),
displayed the early flowering when growing at temperature condition from 23°C
transiting to 27 ℃ under short-day photoperiod. Balasubramanian (2006) pointed out
that the MADS box transcription factor FLOWERING LOCUS M (FLM), a
FLOWERING LOCUS C (FLC) paralogue was a determinant repressor in the
thermal-induced flowering. Under mild increase in growth temperature, of the active
form of FLM transcript would reduced and further retrieve the expression level of FT
and resulted in more early flowering in two ecotypes under short-day photoperiod.
Interestingly, the up-regulation of FT in the thermal-induced flowering required the
attendance of phytohormone gibberellin rather than CO, which is a flowering activator
controlled by photoperiod (Balasubramanian et al., 2006). The flowering-time repressor
SHORT VEGETATIVE PHASE (SVP) (Hartmann et al., 2000) was also identified well
22
as the determinant repressor in temperature-responsive flowering by down-regulating
FT (Kardailsky et al., 1999; Kobayashi et al., 1999). SVP protein preferentially binded
on vCArG III element of FT promoter and repressed its expression, and brought about
the delayed flowering (Lee et al., 2007).
1.4 Ascorbate: An Emerging Factor in the Regulation of Flowering Time
1.4.1 Physiological Functions of Ascorbate
AsA is primary antioxidant molecule in plants and is considered the most
abundant vitamin on earth (De Tullio and Arrigoni, 2004). The function of AsA has
been validated on plant growth (Pignocchi and Foyer, 2003), programmed cell death (de
Pinto et al., 2006), pathogen responses (Barth et al., 2004), hormone responses,
senescence, as well as protection against environmental stresses including ozone
(Conklin and Barth, 2004), UV radiation (Gao and Zhang, 2008), high temperatures
(Larkindale et al., 2005) and high light intensity (Muller-Moule et al., 2004). Current
evidences exhibited that not only AsA level but also its redox ratio affected versatile
physiological processes, including stomatal movement (Chen and Gallie, 2004) and
flowering time (Kotchoni et al., 2009). Ascorbate oxidase (AO) (EC 1.10.3.3) was an
23
apoplastic enzyme in plants that catalyzes the oxidation of AsA with oxygen to
monodehydroascorbate (MDHA). Transgenic tobacco plants over-expressing the AO
antisense displayed severely delayed flowering and higher AsA redox ratio. (Yamamoto
et al., 2005).
1.4.2 Ascorbate: A Negative Regulator of the Phase Transition in Planta
The concentration of AsA could reach to millimolar in plants (Smirnoff, 2000).
The AsA level in AsA-deficient mutant, VITAMIN C DEFECTIVE 1 (VTC1), contains
30% of wild type AsA content and displayed early flowering time under both LD and
SD photoperiod (Conklin et al., 1997). VTC1 encoded a GDP- D -mannose
pyrophosphorylase (GMP), which is an enzyme in the Smirnoff–Wheeler pathway for
AsA biosynthesis in plants (Conklin et al., 1999). Smirnoff-Wheeler pathway had been
proposed the major route in plants for AsA biosynthesis. The alternative pathways, such
as the galacturonate (GalUA) pathway (Agius et al., 2003), the gulose pathway
(Wolucka and Van Montagu, 2003) and the myo-inositol pathway (Lorence et al., 2004)
also participated in AsA biosynthesis. L-galactono-1,4-lactone:ferricytochrome c
oxidoreductase (GALDH; EC 1.3.2.3) required a redox-sensitive thiol for optimal
24
production of AsA , which is an ultimate step enzyme for AsA biosynthesis (Leferink et
al., 2009).In addition, Shen et al is validated the important role of gene in galacturonate
pathway on phase transition from vegetative to reproductive stage in Oncidium (Shen et
al., 2009). It means that regulation of any AsA biosynthesis affecting final AsA level
would brought about the change of flowering time in Arabidopsis and Oncidium.
Numerous studies (Kotchoni et al., 2009) addresses that vtc1 mutant displayed
early flowering phenotype. However, vtc1 exhibiting delayed flowering under short-day
photoperiod condition could be attributed to lower AsA limiting GA20-oxidase activity
for GA biosynthesis (Kotchoni et al., 2009). Furthermore, Arabidopsis feeded with AsA
precursor, L-galactono-γ-lactone, resulted in delayed LFY expression and late flowering
(Attolico and De Tullio, 2006). Oncidium applying with AsA also resulted in
retardation of inflorescence stalk growth and OgLEAFY expression. In OgPMEOX
transgenic plants, observed very high concentrations of AsA had a negative impacted on
flowering time. An increase in the number of rosette leaves was also observed.(Shen et
al., 2009).
In summary, the role of AsA on regulating flowering could be an orchestration of
ROS/antioxidant homeostasis and well-characterized flowering pathways.
25
1.5 The Bridge between Ascorbate and Flowering
1.5.1 The Issue of Ascorbate Peroxidase
Plants have evolved versatile strategies against the fluctuate environments
including favorable and inappropriate events. AsA is a major constituent of the
intracellular redox buffer in planta. Ascorbate peroxidase (APX; EC 1.11.1.11) is a
major scavenging enzyme to convert H2O2 to H2O by utilizing AsA as its specific
electron donor. Various evidences indicated that APX played a key role in Arabidopsis
in response to abiotic stresses.(Pnueli et al., 2003; Davletova et al., 2005; Miller et al.,
2007; Koussevitzky et al., 2008). Knockout-apx1 plant displayed H2O2 accumulation
and protein oxidation under light stress, but have favor growth potential than control
plants under hyperosmotic or salinity condition (REF). Soybean mutant lacking APX1
also proved more tolerance against chilling. Oppositely, reduced expression of tylAPX
in Arabidopsis would result in the increase of tolerance against both osmotic and salt
stresses. Moreover, apx1/tylapx double mutant exhibited an increased sensitivity to
sorbitol treatment (Miller et al., 2010). Noteworthily, apx1 mutant presented the delay
flowering and discloses its function on AsA redox ratio affecting flowering.
26
1.5.2 Hierarchy of Hydrogen Peroxide, Ascorbate and Ascorbate Peroxidase in
Flowering process
In higher plants, reactive oxygen species (ROS) would be generated from
versatile metabolism during growth or undergoing numerous stresses. Endogenous
H2O2 were mainly produced from vigor cells or organs which exhibit active oxidation,
such as electron transport chains (ETC) in chloroplasts and mitochondria, or
photorespiration in peroxisomes (Noctor and Foyer, 1998; Dat et al., 2000). Plant cells
prevent excess H2O2 via APX functioning on scavenging H2O2 by using AsA. Therefore,
H2O2 trigger a metabolic cascade to reduce AsA level and presumably further affects
phase transition. Increasing H2O2 levels were detected before flowering in morning
glory, wheat and Arabidopsis (Hirai et al., 1995; Badiani et al., 1996). Higher redox
ratio was detected in vegetative growth pseudobulb, and markedly decreased during
bolting period of Oncidium (Shen et al., 2009). Moreover, Chin et al validated
thermal-induced flowering in Oncidium. Oncidium growing under elevated growth temperature 30˚C/25˚C (day/night temperature) displayed higher bolting percentage
(95%) accompanying with the higher APX activity (Chin‟s unpublished data). A drastic
decrease of AsA level and redox were also present in pseudobulb of Oncidum under
27
elevated growth temperature condition. The high expression level and activity of APX
during phase transition under elevated temperature condition figures out a considerable
interlinking between flowering and stress response.
1.6 Goals of This Thesis
AsA level and its redox ratio were recognized as a determinant on regulating
phase transition of Oncidium. Moreover, growth temperature is a critical factor affecting
the AsA status of Oncidium growing under green house or field. The complete and
detailed genetic network is still unclear even in model species, Arabidopsis or rice. In
this thesis, we create Arabidopsis overexpressing OgAPX of Oncidium to investigate the
role of AsA status in controlling flowering under different photoperiod and temperature
condition. We propose a genetic network to address the function of AsA and
temperature on flowering mechanism by analyzing the transcriptional profiling.
28
2. Results
2.1 Characterization of Transgenic Arabidopsis Overexpressing Oncidium Ascorbate Peroxidase
2.1.1 Generation of Transgenic Arabidopsis Overexpressing Oncidium Ascorbate Peroxidase
In order to dissect the role of Oncidium ascorbate peroxidase (OgAPX) on
flowering process, OgAPX was overexpressed in Arabidopsis plant (hereafter denoted
as OgAPXOX) under the control of the cauliflower mosaic virus 35S promoter. We
selected three homozygous lines (OgAPXOX line-2, 4, and 7) for further analysis.
Expression level of the OgAPX in transgenic lines was examined by Northern blotting
(Fig. 1B). The transcript of OgAPX could only be detected in the transgenic plants.
Total protein extracted from leaves for analyzing the APX activity in transgenic lines
and control plants. All transgenic lines displayed higher APX activity compared with
wild type and brought about the reduce of H2O2 (Fig. 1A, 5). (11.28, 8.37, 8.72 and 4.59 μmole H2O2/g F.W. in line-2,-4 and -7, respectively) These results showed that OgAPX
was functioned in Arabidopsis.
29
2.1.2 Morphological Characterization of OgAPXOX Transgenic Plants
Plants growing at 22°C under long-day photoperiod or short-day photoperiod
were hereafter denoted LD-22°C and SD-22℃. To prevent the alteration of timing on
phase transition attributing to elevated growth temperature affecting vegetative growth,
plants would further change their growth temperature when consisting of 6 leaves and
hereafter denoted LD-30°C and SD-30℃, respectively. Transgenic plants growing
under LD-22°C exhibited significantly morphological differences compared with the
control plants (Fig. 2A). The foliar blade of OgAPXOX displayed sharp and flat shape
compared with control plants. Moreover, the transgenic plants exhibited decreasing
chlorophyll level and brought about the chlorortic rosette leaves compared with wild
type (Fig. 3). The whole chlorophyll levels in wild type were 0.14 mg per g F.W., and
transgenic plants were 0.07, 0.06 and 0.02 mg per g F.W. in line-2, 4 and 7,
respectively.
2.1.3 Effects of Oncidium Ascorbate Peroxidase on Ascorbate
Homeostasis and H
2O
2Level under Different Environmental
Condition in Arabidopsis
30
Reactive oxygen species (ROS) are produced through active cellular metabolism,
and plant cells provide with versatile antioxidants and scavenging enzymes to prevent
excessive levels under normal growth condition. In Fig. 1, transgenic plants displayed
increasing APX activity and resulted in decrease of H2O2. Although the significant
decline of H2O2 concentrations was present in transgenic plants under LD-22°C (11.28, 8.37, 8.72 and 4.59 μmole H2O2/g F.W. in line-2, -4 and -7, respectively), the
endogenous AsA levels in OgAPXOX slightly decreased compared with wild type (3.52,
2.57, 3.09 and 3.02 μmole AsA/g F.W. in line-2,-4 and -7, respectively) (Fig. 4, 5).
Histological staining of leaves with 3, 3‟-diaminobenzidine illustrating the location and
intensity of H2O2 also presented less H2O2 in transgenic plants (Fig. 2B).
In Fig. 6, 7, the H2O2 and AsA level in transgenic and control plants had shown
the similar pattern under SD-22°C
Furthermore, H2O2 level in wild type increased more significantly (36.9 μmole
H2O2/g F.W.) after 4 days under LD-30°C compared with OgAPXOX transgenic plants displaying mild increased pattern (20.79, 18.81 and 20.28μmole H2O2/g F.W. in
line-2,-4 and -7, respectively) (Fig. 8). The higher growth temperature brought about
drastic decrease of AsA level and redox ratio in transgenic plants growing under LD and
31
SD (Fig.9, 10 and 11). The redox ratio of AsA in each plants before LD-30°C and after
4 days under LD-30°C changed from 10.86 to 9.74 (wild type), 10.28 to 7.36 (lin-2),
8.49 to 1.29 (line-4), and 6.60 to 2.73 (line-7) respectively. It reveals that utilization of
AsA by APX would be reinforced swiftly under elevated growth temperature for
scavenging excess H2O2 and brought about more severe decline of AsA level and redox
ratio in transgenic plants compared with wild type.
2.1.4 Effect of Oncidium Ascorbate Peroxidase on Flowering Time under Different Environmental Condition in Arabidopsis
Higher bolting was present in Oncidium growing under elevated growth
temperature condition accompanying facilitated activity of APX and deprivation of AsA
(Chen et al., unpublished data). Recent evidences also reveal that a modest increase of
ambient growth temperature is equally efficient in regulating flowering of Arabidopsis
(Blanchard and Runkle, 2006; Lee et al., 2008). In order to understand whether APX
involving in thermal-induced flowering, the flowering time of OgAPXOX transgenic
plants were monitored under different photoperiod and temperature condition . The
flowering time of each plant was determined according to the number of rosettes leaves
32
when flowering initiation. Under LD-22°C condition, the number of rosette leaves when
flowering was 12 in wild type plants, and 10 in line-2,-4 and -7, respectively (Fig. 12).
The timing of flowering between wild type and transgenic plants did not present
significant difference when growing under LD or SD-22°C and speculated that only or
even active APX would not fulfil the flowering (Fig. 12, 13, 14). Furthermore, three
independent lines would be cultivated under LD/SD-30°C from LD/SD -22°C when
consisting of six leaves to monitor the effect of heat on flowering. Transgenic plants
displayed facilitated flowering significantly when plants were grown under LD-30°C
(Fig.15, 16). Wild type and transgenic plant would not flower before consisting of 8
leaves when growing at 22°C, but there were 90 % of OgAPXOX plants flowered before
less than or equal to 8 leaves compared with 40% of wild type. This result indicates that
APX could consolidate the thermal-induced flowering. The transgenic plants exhibited
not only accelerated flowering but also enervated growth potential, such as severe
chlorosis, stunted inflorescence and smaller leaf blade under LD (Fig. 15, 17). Average
length of inflorescence in each transgenic line was shorter than 10 cm (n > 70)
compared with 15cm in control plants under LD. Transgenic plants displayed facilitated
flowering significantly when plants were grown under SD-30°C (Fig. 18, 19).
33
Accordingly, accelerated flowering in OgAPXOX transgenic plants could be attributed
to the swift ROS-scavenging system bringing about drastic decrease of AsA and redox
ratio under elevated growth temperature.
34
2.2 Genetic Network of Ascorbate Peroxidase Involving in Thermal-induced Flowering Process
2.2.1 Decreased Expression Level of FLM in OgAPXOX Plants Suggests the Role of AsA in Regulating Thermal-induced Flowering
P
revious studies showed that AsA was a repressor on flowering in Arabidopsis and Oncidium (Attolico and De Tullio, 2006; Shen et al., 2009). The AsA levelfluctuates in response to various endo- and exo- stimulations, including growth
temperature condition. Transgenic plants showed early flowering under LD/SD-30°C
accompanying with drastic decrease of AsA content and redox states, but it is still
unclear the orchestration and detail mechanism of AsA and heat-stimulation on
flowering process.
Genetic approaches have identified a group of mutants whose flowering time is
affected by AsA level, such as vtc1, ao and OgPMEOX plants (Yamamoto et al., 2005;
Barth et al., 2006; Shen et al., 2009). For instance, some floral genes displayed higher
level in AsA scarcity mutant vtc1, such as LATE ELONGATED HYPOCOTYL (LHY),
TIMINGOF CAB EXPRESSION (TOC1), GIGANTEA(GI), CONSTANS (CO), and
FLOWERING LOCUS C (FLC) (Kotchoni et al., 2009). Moreover, the expression level
35
of FLOWERING LOCUS M (FLM), a FLC paralogous gene, was repressed in
Arabidopsis when growing under higher temperatures condition and figure out novel
thermal-induced flowering pathway (Balasubramanian et al., 2006). The lower
expression level of AtFLM was also present in OgAPXOX transgenic plants compared
with wild type after 5 day under LD-30°C and figured out the role of AsA participating
in flowering coordinating with thermal-induced pathway (Fig. 20).
2.2.2 Transcriptional Profiling of OgAPXOX Arabidopsis under Elevated Growth Temperature
To address this issue, we carried out an analyses of the expression profiling of
OgAPXOX and control plants in response to the elevated growth temperature by 3' IVT
Expression GeneChip (Affymetrix; Arabidopsis ATH1). All plants were growed under
LD-22°C condition. Until they had 6 leaves, a half of transgenic lines and wild type
would be cultivated under LD-30°C and sampled the leaves at 0 day under LD-30°C, at
1 day under LD-30°C and at 5 day under LD-30°C for further analysis. After
normalization of the expression level with wild type growing under 22°C by Gene
Spring GX10.5 (http://www.genomics.agilent.com/homepage.aspx), there were total of
36
860 transcripts selected from the other treatments displaying up- or down- regulated
expression levels (>2 fold). The 860 transcripts were subsequently categorized into 10
clusters using k-means clustering in accordance with the pattern of their temporal
change in the expression profile (Fig. 21A). The clusters consisted of transcripts that
displayed overall trends of either increased (Fig. 21B, clusters 2-9) or decreased (Fig.
21B, cluster 1) gene expression over the different time points in the study. The detail of
all clusters is interpreted:
Cluster 1:
In Fig. 21B and Table. 1, total of 244 transcripts in cluster 1 displayed overall
tends of decreased gene expression. Gene-ontology (GO) analysis of genes in cluster 1 displayed the major subcategories in “molecular function” were function on DNA
binding and provided with transcription regulator activity and transcription factor activity. The major subcategory in “cellular component” was located at endomembrane
system. The major subcategories in “biological process” were related to transcription
factor activity, stress response and response to hormone stimulus. Noteworthily,
abundant genes in cluster 1 were predicted to encode various members of transcription
factors, including MYB, AP2 and protein in circadian clock. Three MYBs, AtMYB48
37
(At3g46130), AtMYB3 (At1g22640), and AtMYB60 (At1g08810), in cluster 1 belong to
R2R3-MYB and have been characterized their function on anthocyanin biosynthesis.
Four genes encoding AP2 protein in cluster 1 belong to RAP2.4 subgroup which
mediating light and ethylene signaling, including At4g39780, At1g64380, At2g22200
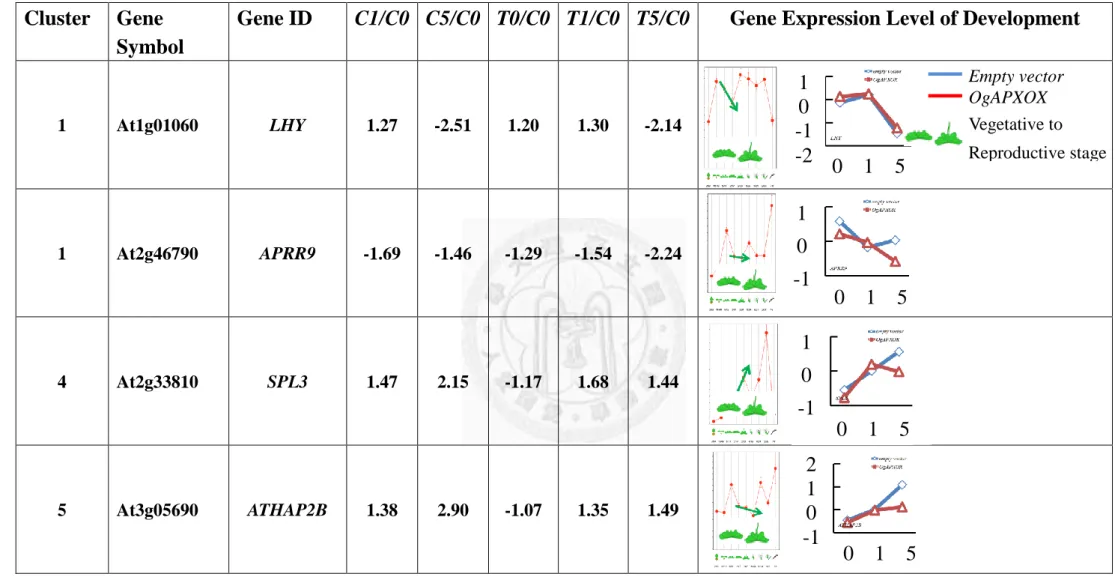
and At1g74930. (Wang et al., 2008). Circadian clock genes, LHY (At1g01060) and
APRR9(At2g46790), regulated flowering time through the canonical CO-dependent
photoperiodic pathway (Nakamichi et al., 2007) and displayed drastically decreased
expression levels under elevated growth temperature. Therefore, it suggests that
antioxidant state (including anthocyanin and AsA), circadian rhythm and
phytohormones level would be altered in response to the change of growth temperature
and AsA state.
Cluster 2:
In Fig. 21B and Table. 2, total of 126 transcripts in cluster 2 displayed slightly
decreased expression pattern after 1 day under LD-30°C, but significant increase in
transgenic plants after 5 day under LD-30°C. GO analysis of genes in cluster 2 displayed the major subcategory in “molecular function” was function on nucleotide
binding. The major subcategory in “cellular component” was located at plasma
38
membrane. The major subcategories in “biological process” were related to defense
response, phosphate metabolic process, response to organic substance and nitrogen
compound biosynthetic process. Noteworthily, abundant genes in cluster 2 were
predicted to encode various members of stress-related transcription factors, including
AtMYB70 (At2g23290) and AtWRKY11 (At4g31550). The transcription factor
AtWRKY11 acted as negative regulator for plant in susceptible to Pseudomonas syringae
pv tomato (Kroj et al., 2006). Moreover, AtMYB70 was likely to be associated with
stress responses but still unclear about its detail function. All of them displayed striking
increase in OgAPXOX under LD-30oC and suggests that their probable functions on
coordination of elevated growth temperature and sensing the redox state change caused
by OgAPXOX.
Cluster 3:
In Fig. 21B and Table. 3, cluster 3 contains 29 transcripts that displayed
significantly decreased expression pattern after 1 day under LD-30°C, but significant
increased after 5 day under LD-30°C. GO analysis of genes in cluster 3 displayed the major subcategory in “molecular function” was function on carbohydrate binding. The
major subcategories in “cellular component” were located at plasma membrane and cell
39
wall. The major subcategories in “biological process” were related to defense response
and response to organic substance. Noteworthily, abundant genes in cluster 3 were
predicted to encode various members of stress-related transcription factors, including
AtGSTF3 (At2g02930) and PR5 (At1g75040). AtGSTF3 encoded glutathione
transferase. PR5 encoded thaumatin-like protein and involved in response to pathogens.
Furthermore, they all displayed drastic decreased expression levels after 1 day under
LD-30°C and increased after 5 day under LD-30°C.It suggests that they were response
to temperature stimulus and response to pathogens at the late phase.
Cluster 4:
In Fig. 21B and Table. 4, there were 63 transcripts in cluster 4, and their expression
levels increased highly in wild type compared with OgAPXOX after 5 day under
LD-30°C. GO analysis of genes in cluster 4 displayed the major subcategory in
“molecular function” was provided with transmembrane transporter activity. The major
subcategory in “cellular component” was located at integral membrane. The major
subcategories in “biological process” were related to temperature stimulus and response
to reactive oxygen species. Noteworthily, abundant genes in cluster 4 were predicted to
encode heat shock transcription factors, including, At5g37670, AtHSP70 (At3g12580),
40
HSP70T-2, At2g19310, HSP81-.1 (At5g52640). Furthermore, they all displayed striking
increase expression levels in transgenic plants after 5 day under LD-30°C, and suggests
that they promote trigger the heat response by sensing AsA state.
Cluster 5:
In Fig. 21B and Table. 5, there were 92 transcripts in cluster 5, and displayed
overall tends of increased gene expression in control and transgenic plants under
LD-30°C compared with cluster 4. GO analysis of genes in cluster 5 displayed the major subcategory in “molecular function” was response to oxidative stress. The major
subcategory in “cellular component” was located at cell wall. The major subcategories
in “biological process” were related to organic substance and response to oxidation
reduction. Noteworthily, abundant genes in cluster 5 were predicted to detoxification
process, including, CYP96A4 (At5g52320), CYP79B2 (At4g39950), CYP81F4
(At4g37410), CYP83B1 (At4g31500), CYP71B3 (At3g26220), CYP89A9 (At3g03470)
and CSD2 (At2g28190). Furthermore, they all displayed increased expression levels
under LD-30°C and suggest oxidoreduction would be responsive to change of growth
temperature and AsA state.
Cluster 6:
41
In Fig. 21B and Table. 6, total of 73 transcripts in cluster 6 displayed steady
expression pattern in control and transgenic plants after 1 day under LD-30°C, but
significant increased in transgenic plants after 5 day under LD-30°C. GO analysis of genes in cluster 6 displayed the major subcategory in “molecular function” was function
on metal ion binding. The major subcategory in cellular component was located at
external encapsulating structure. The major subcategories in “biological process” were
related to oxidation reduction and response to organic substance. Noteworthily,
At3g47480 was predicted to encode calcium-binding protein. Interestingly, At3g47480
displayed striking increase in OgAPXOX plants after 5 day under LD-30°C. It was
suggested that calcium-triggered signal cascade could sense the redox state.
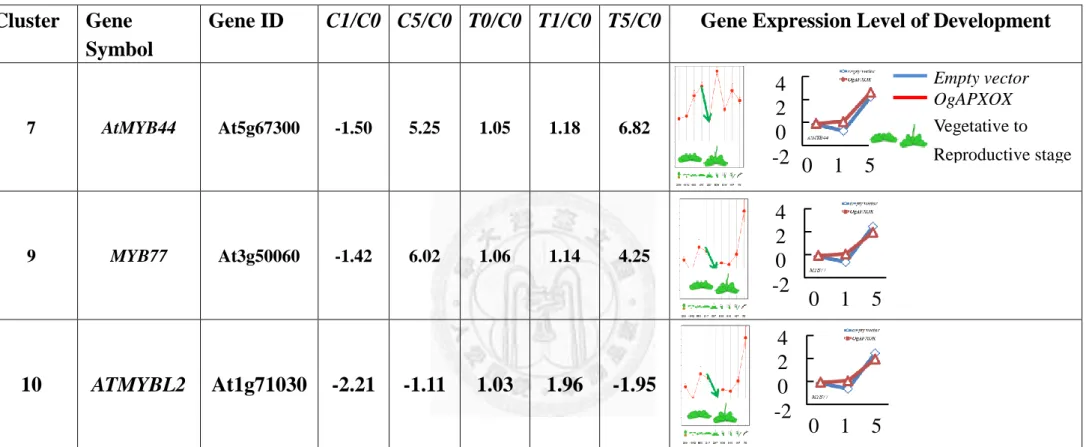
Cluster 7:
In Fig. 21B and Table. 7, total of 49 transcripts in cluster 7 displayed slightly
decreased expression pattern after 1 day under LD-30°C, but significant increased after
5 day under LD-30°C. GO analysis of genes in cluster 7 displayed the major subcategories in “molecular function” were provided with transcription regulator
activity and transcription factor activity. The major subcategory in “cellular component”
was located at intrinsic membrane. The major subcategories in “biological process”
42
were related to endogenous stimulus, defense response, response to organic substance
and response to carbohydrate stimulus. Noteworthily, abundant genes in cluster 7 were
predicted to encode various members of stress response transcription factors, including
AtERF6 (At4g17490), ATERF-2(At5g47220), AtACS11 (At4g08040) and AtACS6
(At4g11280). All of them played important role in ACC synthesis. Interestingly,
transgenic Arabidopsis overexpressing AtMYB44 was more sensitive to ABA and had a
more rapid ABA-induced stomatal closure response than wild type and atmyb44
knockout plants. AtMYB44 showed slightly decreased after 1 day under LD-30°C, but,
induced drastically after 5 day under LD-30°C. It suggests that the stress
phytohormones, including of ethylene and ABA, would be retrieved in response to AsA
status under elevated growth temperature.
Cluster 8:
In Fig. 21B and Table. 8, cluster 8 contains 55 transcripts that displayed more
significantly decreased expression pattern after 1 day under LD-30°C, but significantly
increased after 5 day under LD-30°C compared with cluster 7. GO of genes in cluster 8 displayed the major subcategories in “molecular function” was function on ATP binding.
The major subcategories in “cellular component” were located at plasma membrane,
43
cell wall. The major subcategories in “biological process” were related to defense
response and response to organic substance. Noteworthily, abundant genes in cluster 8
were predicted to encode various members of pathogenesis-related transcription factors,
including AtPR1 (At2g14610), AtPR4 (At3g04720), PDF1.2 (At5g44420). Furthermore,
they all displayed drastic decreased expression levels after 1 day under LD-30°C, and
increased after 5 day under LD-30°C, and suggested that they were response to
thermal-induced acclimation and sensing the redox state at the late phase to reduce
injury by pathogen presumably.
Cluster 9:
In Fig. 21B and Table. 9, total of 62 transcripts in cluster 9 displayed steady
expression pattern after 1 day under LD-30°C, but significantly increased in wild type
after 5 day under LD-30°C. GO of genes in cluster 9 displayed the major subcategory in
“molecular function” was function on cation binding. The major subcategory in
“cellular component” was located at vacuole. The major subcategories in “biological
process” were related to defense response, response to hormone stimulus and response
to carbohydrate stimulus. Noteworthily, abundant genes among cluster 9 were predicted
to encode various members of MYB transcription factors, including AtMYB73
44
(At4g37260), MYB77 (At3g50060). Interestingly, MYB77 modulated auxin signal
transduction (Shin et al., 2007). AtMYB73 was response to salicylic acid stimulus.
MYB77 was showed slightly decreased after 1 day under LD-30°C, but, induced
drastically after 5 day under LD-30°C. It suggests that the auxin and salicylic acid
stimulus in plant process was trigger by downstream genes under elevated growth
temperature.
Cluster 10:
In Fig. 21B and Table. 10, cluster 10 contains 53 transcripts that displayed
significantly decreased expression pattern after 1 day under LD-30°C, but, significant
increased after 5 day under LD-30°C. GO of genes in cluster 10 displayed the major subcategories in “molecular function” was provided with serine/threonine kinase
activity. The major subcategory in “cellular component” was located in cytosol. The major subcategories in “biological process” were elated to hormone stimulus and
response to abiotic stimulus. Noteworthily, abundant genes in cluster 10 were predicted
to encode putative protein kinase, including CIPK20, AtCPK6 (At2g17290).
Furthermore, they all displayed drastically decreased expression levels after 1 day under
LD-30°C, and increased after 5 day under LD-30°C, and suggested response to
45
thermal-induced acclimation.
2.2.3 Functional Categories of Expression Clusters in Accordance with Genotypes and Growth Temperature Condition
Those transcripts in response to genotypes and growth temperature were functionally
assigned to detail groups as shown in Fig. 22. The framework consists of the following:
Group I: Genes displayed up- /down- regulated by elevated growth temperature
both in wild type and transgenic plants (cluster 4 and 5 / cluster 1). Genes in this group
would be influenced by temperature and redox ratio, such as circadian clock genes,
MYB, HSP, RAP2.4 transcription factors, and CYP. The functions of these genes were
suggested to regulation of anthocyanin biosynthesis, circadian rhythm, heat shock
response and oxidative stress. Therefore, genes in Group I were suggested in response
to redox ratio under elevated growth temperature.
Group II: Genes showed strikingly up-regulated after 5 day under LD-30°C by
the coordination of elevated growth temperature condition and OgAPXOX background
(cluster 2, 6). Genes in this group would be predicted to response to stress, such as
AtMYB70, AtWRKY11. At3g47480 was predicted to encode calcium-binding protein. It
was suggested that genes in Group II were regulated calcium signal transduction and
46
stress response by sensing the redox state under elevated growth temperature.
Group III: Genes degraded immediately but de novo synthesis at late treatment
period (cluster 3, 8 and 10). The functions of these genes were suggested to regulated
pathogen defense, such as PR genes. It suggests that pathogen defense genes in Group
III would be influenced by temperature at late period.
Group IV: Down-stream genes in response to elevated growth temperature
condition (cluster 7 and 9). The functions of these genes were suggested to regulation of
hormone stimulus, such as AtMYB44, MYB77. It suggests that hormone stimulus could
be triggered as the down-stream genes under elevated growth temperature.
Noteworthily, the expression profiling of Group II indicates that OgAPX could act
as a positive effector on their expression level under elevated growth temperature.
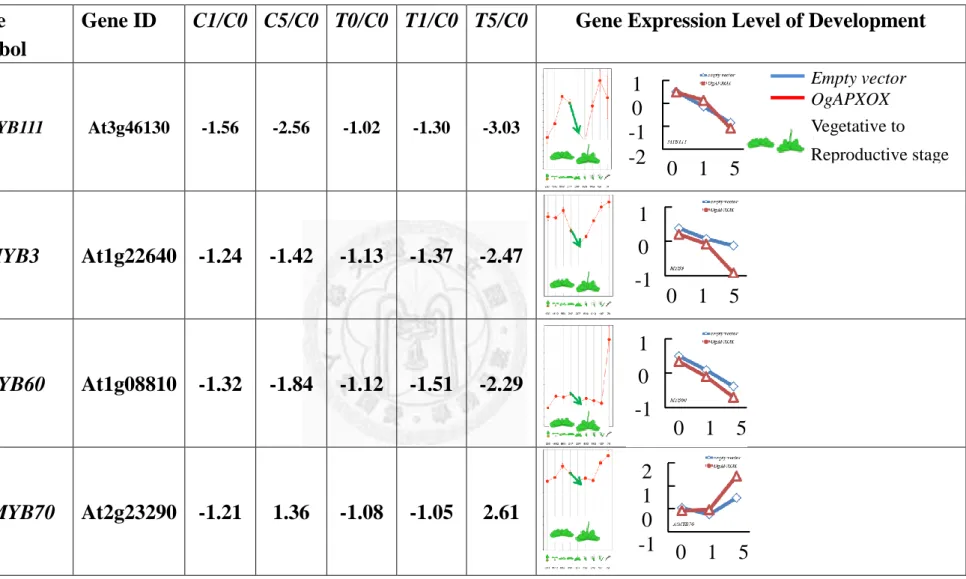
2.2.4 Transcription Profiling Revealed That Genes Encoding MYB and AP2 TFs Expressed with Higher/ Lower in OgAPXOX Plants under Elevated Growth Temperature
In accordance with above analysis, MYB and AP2 protein were the two TFs in
response to elevated temperature or fluctuant redox ratio. The relative expression level
47
of genes in transgenic plant and wild type after different days under 30°C between wild
type growing under LD-22oC were denoted T0/C0, T1/C0, T5/C0, C1/C0 and C5/C0,
respectively). It showed that the expression level of AtMYB70, AtMYB44 and AtMYB77
were up-regulated 2.61, 6.82 and 4.25 fold in T5/C0, respectively. AtMYB48, AtMYB3,
AtMYB60 and AtMYBL2 were down-regulated 3.03, 2.47, 2.29 and 1.95 fold in T5/C0,
respectively (Table. 11). MYB proteins have been recognized key factors in regulatory
networks controlling development, metabolism and responses to biotic and abiotic
stresses (Dubos et al., 2010). The functions of AtMYB3, AtMYBL2, AtMYB60,
AtMYB111 were well-characterized on control anthocyanin biosynthesis (Lepiniec et al.,
2008; Ohme-Takagi et al., 2008; Park et al., 2008; Stracke et al., 2010). AtMYB77
regulated lateral root formation by modulating the expression of auxin-inducible genes
(Shin et al., 2007). AtMYB44 regulates ABA-mediated stomatal closure in response to
abiotic stresses and AtMYB70 are likely to be associated with stress responses (Cheong
et al., 2008).But, the clear function of AtMYB70 is still scant. The expression level of
AtMYB70 was increased in wild type under LD-30°C, and it would be enhanced in
OgAPXOX. Therefore, we suggested the AtMYB70 was a critical recipient sensing the
drastic deceased redox status.
48
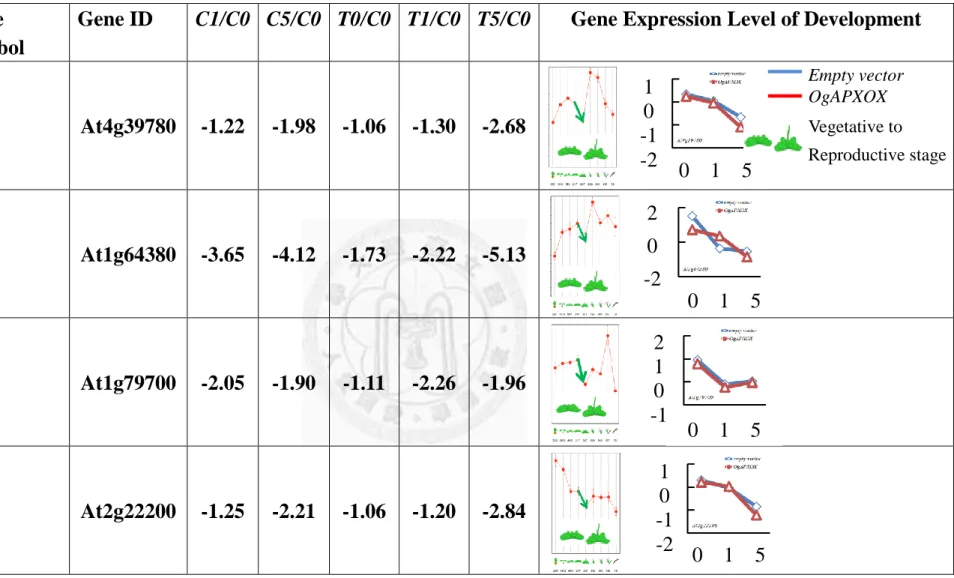
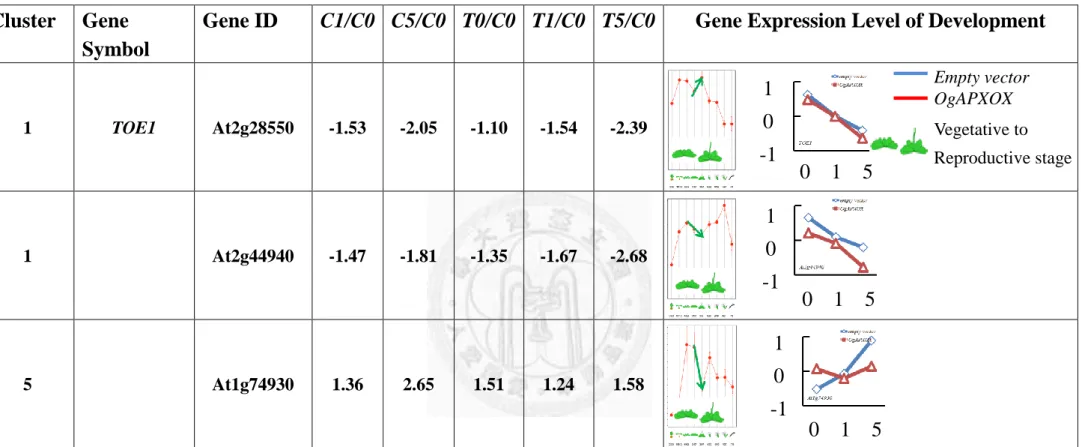
The AP2-type transcription factors including of At4g39780, At1g64380,
At2g22200, At2g28550 and At2g44940 were down-regulated 2.68, 5.13, 2.84, 2.39 and
2.68 fold in T5/C0, respectively (Table. 12). At1g79700 and At1g74930 were
up-regulated 1, 1.58 fold T5/C0, respectively. Noteworthily, Rap2.4a family genes
which were identified the redox-sensitive transcription factors functioning on the
control of antioxidant state, but the detail function is still unclear (Shaikhali et al., 2008).
This analysis suggested that contain Rap2.4 domain (i.e., At4g39780, At1g64380, and
At2g22200) might sense the drastic decease of redox status.
2.2.5 Genes Involving in Circadian Rhythm and Starch Synthesis Were Significantly Altered in APXOX Plant under Elevated Growth Temperature
Several genes, including LHY, PSEUDO-RESPONSE REGULATOR9 (APRR9),
SQUAMOSA PROMOTER BINDING PROTEINLIKE 3 (SPL3) and HEME
ACTIVATOR PROTEIN 2B (ATHAP2B) are robust markers for circadian rhythm
(Nakamichi et al., 2007; Wu et al., 2007; Yamaguchi et al., 2009). The expression levels
of SPL3, ATHAP2B were up-regulated 4, 1.49 folds T5/C0, respectively (Table. 13).