國立臺灣大學公共衛生學院流行病學研究所 碩士論文
Graduate Institute of Epidemiology College of Public Health National Taiwan University
Master Thesis
以同步定量聚合酶鏈反應偵測精神分裂症病患 及其家屬在 1q21.1 與 2q22.1 之拷貝數變異
Searching for copy number variation using qPCR around 1q21.1 and 2q22.1 in patients with schizophrenia and their nonpsychotic relatives
蔡育瑾 Yu-Chin Tsai
指導教授:陳為堅 教授 Advisor: Wei J. Chen, M.D., Sc.D.
中華民國 99 年 7 月
July, 2010
I
致謝
兩年的碩士班生涯就這樣結束了。不敢大放厥詞的張揚自己成長了多少,但 是時間走過的痕跡總是會在生命裡留下點什麼,但同時也帶走一些物事。
在陳為堅老師的研究室裡的第四個年頭即將進入尾聲,如果不是老師苦口婆 心的在公務繁忙之餘對於研究的每個細節耐心要求,帶領我進入研究的不同環 節,這份論文不會展現這般模樣;程蘊菁老師亦師亦友的適時給予我精神或學識 上的支持、陳嘉祥老師從國衛院遠道而來以及胡海國醫師的撥冗出席口試,一切 都讓這篇論文有了更加完備的思維。
季侑學姐、士儀學長、聖翔學長以及盈如學姐的耐心的與我討論,補足了好 多我眼界未及的知識,不光在研究上,他們也賦予我生活許多調劑;研究室的大 家更是這兩年來不可或缺的存在,伯璋總是和顏悅色處理我的好多瑣碎問題、哲 宗面惡心善的自我進入實驗室起就給予好多技術指導,彥婷、瑩萍、韻璇學姐、
恩羽、雅惠、瑋民、鈞傑、文綺、安省、育如、盈青、德天學姐、世亨學長,他 們的話語總讓碩班的時間壓力消弭於無形,還有那些研究子題或許不相關卻同窗 學習的國瑋、慧琪、儀君、彥伶、蘭馨以及好友雅婷、麗瑤、倪萱、念霖、鳳聲、
薏竹學姐,那些共同回憶是一輩子的珍寶。
感謝宇筑在這完成論文的緊迫階段始終陪著我,無論黎明或午夜;更重要的 是身在遠方仍不定時捎來問候的父母、奶奶、以及妹妹,何其有幸有他們在身後 成為堅實的後盾,讓我毫無後顧之憂的可以做自己想做的事。
僅以此文獻給他們,以及來不及見到此刻的爺爺與外公
蔡育瑾 謹誌 中華民國九十九年七月二十九日
II
摘要
背景與目的:拷貝數變異 (Copy Number Variation) 已經被提出是精神分裂症易感 受性的重要原因之一,過去研究指出拷貝數變異在精神分裂症病患上,有著和“常 見疾病是由罕見遺傳變異引起”假說並行不悖的特性。因此,用一種有效率且可信 賴的方式在精神分裂症的病患上找尋可能和疾病相關的拷貝數變異便成了一個重 要的課題。在這個研究中,我們透過精神分裂症病患及其家屬的樣本,希望能評 估用兩階段的定量聚合酶鏈反應 (quantitative polymerase chain reaction) 來找尋位 在 1q21.1 以及 2q22.1 兩段區域的拷貝數變異之實際可行性。
方法:研究樣本是來自臺灣精神分裂症連鎖研究 (Taiwan Schizophrenia Linkage Study),收集了來自全臺灣手足皆感染精神分裂症的病患及其一等親家屬,共有 2462 名個案,分別來自 607 個家庭。利用 ABI7900 以及 TaqMan® Copy Number Assays 偵測三段區域上拷貝數變異的探針,其中兩個位在 2q22.1 (HNMT gene) 一 個位在 1q21.1 (GJA8 gene),第一階段基因型定型 (genotyping) 的每一樣本皆以二 重複進行,以臨界週期數差異 (∆Ct) 的中位數 ± 3*標準差作為標準,超出這個範 圍的即視為離群值,帶有離群值的個案以及他們的家屬,以四重複的方式進行第 二階段的基因型定型,接著透過檢視拷貝數變異在家族中的基因型分佈來判定該 拷貝數變異是家族遺傳傳遞或突變而來。至於拷貝數變異與精神分裂症之關係則 會利用 FBAT 軟體進行分析。
結果:根據臨界週期數差異,個案被分成帶有三種不同基因型的組別,分別是:
1/0 (deletion, 在該區域上有序列缺失,∆Ct <中位數 − 3*標準差)、1/1 (野生型, 在 該區域之序列正常,∆Ct 位在中位數 ± 3*標準差間)以及 2/1 (duplication, 在該區
III
域上有序列重複出現,∆Ct >中位數− 3*標準差)。在第一階段的實驗中,在三個區
域分別有 8 名 (CNV marker 1) 、2 名 (CNV marker 2) 以及 25 名 (CNV marker 3) 帶有異常的臨界週期數差異,經第二階段實驗的驗證後,在三個區域分別只有 1 名 (CNV marker 1)、0 名 (CNV marker 2)、13 名 (CNV marker 3) 個案的臨界週期 數差異仍維持是離群值,這些人被視為帶有確定的拷貝數變異。共計在 CNV marker 1 有一個家族帶有 duplication,而在 CNV marker 3 有 6 個家族帶有 deletion。FBAT 的分析中,顯示 deletion 的 allele 帶有會增加罹病危險性的趨勢,但統計上則未達 顯著 (z-statistics = 1.134, P = 0.257)。
結論:這個研究展示了一種利用定量聚合酶鏈反應針對特定區域搜尋拷貝數變異 並且節省成本的實驗設計,結果指出在我們研究中找到的拷貝數變異大多是經由 家族性傳遞。
IV
ABSTRACT
Background and Objective: Copy number variations (CNVs) have been postulated to
be an important source of genetic susceptibility to schizophrenia. Previous findings on CNVs in schizophrenia patients appear to be compatible with the proposition of“common disease, rare variants.” Under this circumstance, it is important to search for CNVs in individual patients with schizophrenia in an efficient but robust way. In this study, we aimed to evaluate the feasibility of a two-stage quantitative polymerase chain reaction (qPCR) approach in detecting CNVs in two chromosomal regions, 1q21.1 and 2q22.1, in patients with schizophrenia and their families.
Methods: The sample consisted of 2462 participants from Taiwan Schizophrenia
Linkage Study, which recruited sib-pairs co-affected with schizophrenia and their first-degree relatives throughout Taiwan with a total of 607 families. Three CNV markers were chosen for genotyping using TaqMan® Copy Number Assays on the ABI7900, with markers 1 and 2 located on 2q22.1 (HNMT gene) and marker 3 on 1q21.1 (GJA8 gene). First-stage genotyping was performed with 2 replicates of each subject. Then the outliers with a ∆Ct value beyond median ± 3SD and their family members were re-assayed with 4 replicates. After the second-stage genotyping, we examined the pedigrees of those subjects with confirmed CNV to determine whether the CNV was due to familial transmission or a de novo one. The relations of the CNVs to schizophrenia were evaluated using family-based association analysis.Results: Subjects were categorized to 3 distinct genotypic groups according to their ∆Ct
values: 1/0 (deletion, i.e., > median+3SD), 1/1 (wild type, within the range of median ± 3SD) and 2/1 (duplication, i.e., < median − 3SD). In the first-stage genotyping, there were 8, 2, and 25 subjects counted as outliers for CNV markers 1, 2 and 3, respectively.V
Among them, 1 subject for marker 1, 0 subject for marker 2, and 13 subjects for marker 3 remained as outliers in the second-stage genotyping, whom were judged to be carriers of confirmed CNVs. In total, there was one family with confirmed duplication at CNV marker 1, and six families with confirmed deletion at CNV marker 3. The deletion at CNV marker 3 tended to be associated with schizophrenia, though not reaching statistical significance in family-based association analysis (z-statistics = 1.134, P = 0.257).
Conclusion: This study demonstrated an experimental design that is cost-saving in
searching for CNVs using qPCR for targeted regions. The results revealed that most of the CNVs found in families of patients with schizophrenia were due to familialtransmission.
VI
CONTENT
致謝 ... I 摘要 ... II CONTENT ... VI LIST OF TABLES ... VII LIST OF FIGURES ... VII
INTRODUCTION ... 1
MATERIALS AND METHODS ... 4
Study subjects ... 4
Measurement ... 4
Genotyping ... 5
Real-time TaqMan assay conditions ... 5
Two-stage qPCR procedure ... 6
Statistical analysis ... 7
RESULTS ... 8
DISCUSSION ... 10
REFERENCES ... 13
VII
LIST OF TABLES
Table 1. The information of the CNV markers selected for this study. ... 18 Table 2. The results of comparing the first round (2-replicate) ( number of subjects =
2462) and second round (4-replicate) genotypings ... 19
Table 3. Demographic features, clinical assessment, and performance on the Continuous
Performance Test (CPT) for 6 families with confirmed CNV at marker 3. ... 20LIST OF FIGURES
Figure 1. The scatter plot of ∆Ct values determined using an automatic setting vs. that
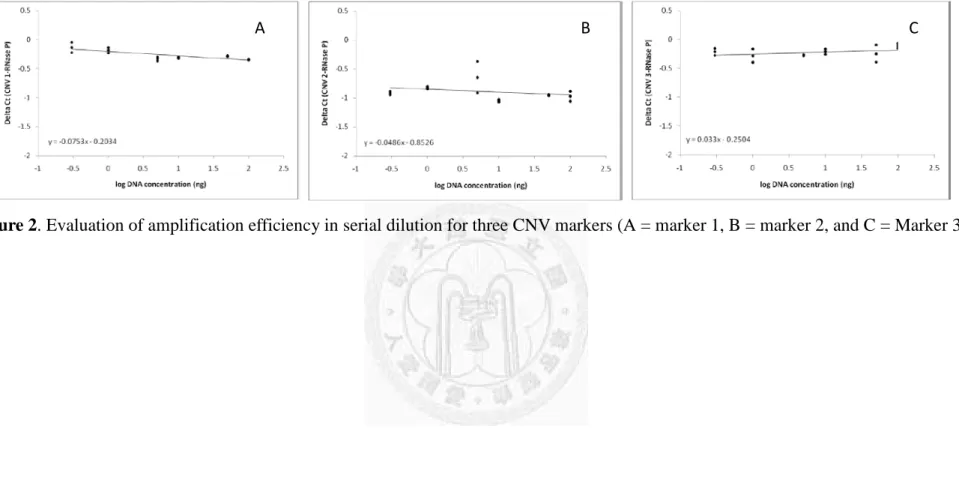
of ∆Ct values determined using a manual setting with 0.2 as the threshold in 96 subjects with 4 replicates contained in a single plate. ... 22Figure 2. Evaluation of amplification efficiency in serial dilution for three CNV
markers (A = marker 1, B = marker 2, and C = Marker 3) ... 23
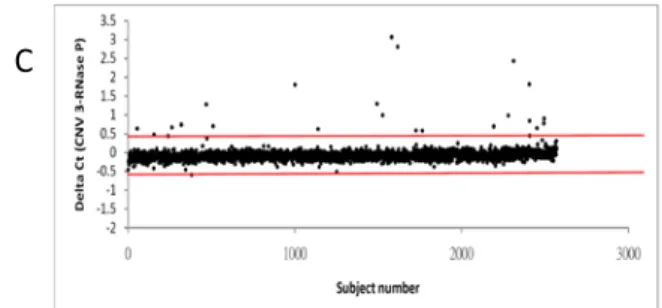
Figure 3. The scatter plot of the ∆Ct values in the first-round genotyping for all subjects
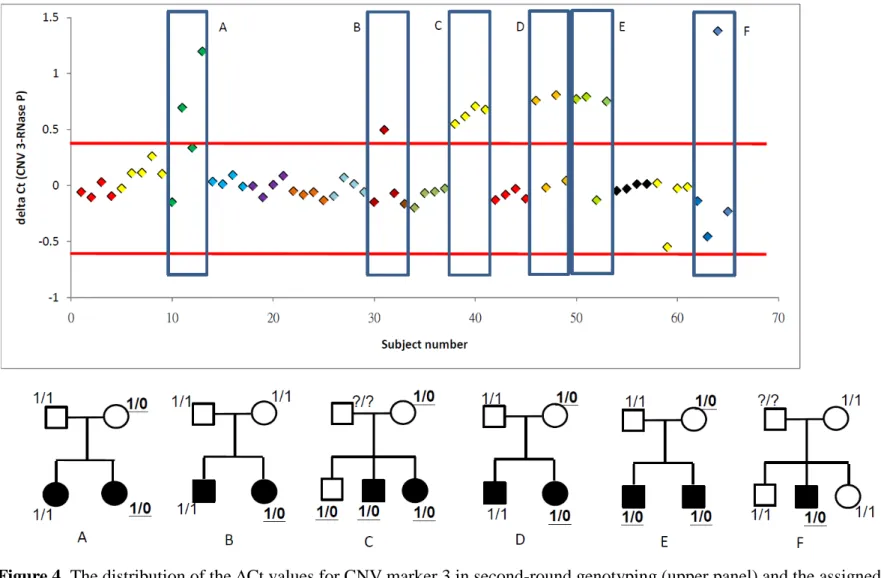
(A = marker 1, B = marker 2, and C = marker 3). ... 24Figure 4. The distribution of the ∆Ct values for CNV marker 3 in second-round
genotyping (upper panel) and the assigned genotype for each family (lower panel). ... 25
1
INTRODUCTION
Copy number variation (CNV) refers to a submicroscopic form of genomic variation, typically of a size ranging from 1 kilobase (kb) to megabases (Mb), and may exist as deletions, insertions, duplications, or complex multi-site variants (Redon et al. 2006). CNVs may cause functional loss by means of dosage-related microdeletions, duplications, or altering regulatory regions of genes (Stankiewicz and Lupski 2002). Even for those CNVs that are balanced with no functional change, certain carriers may have increased genomic instability in the future generation (Feuk et al. 2006). After early systematic searches reported hundreds of CNVs in human genome (Iafrate et al. 2004; Sebat et al. 2004), more CNVs have been discovered using different microarray platforms, in which only a small proportion overlapping with those found previously (Redon et al. 2006). The relative abundance and functional implications of CNVs have rendered them a new focus of association studies for complex diseases.
Currently there are two main approaches to detect CNVs: array-based (Dhami et al. 2005;
Sharp et al. 2005) and polymerase chain reaction (PCR)-based methods (Bieche et al. 1998;
Ponchel et al. 2003). Array-based methods can provide a genome-wide scan for novel CNVs, and their resolution varies with the lengths of clones. For example, bacterial artificial
chromosome (BAC) can be used as an array target with extensive coverage of genome, but has a poorer resolution than cDNA- or oligonucleotide-based probes (Locke et al. 2004). This approach can be adopted in an array chip to conduct genome-wide search for CNVs and then use qPCR to validate them (The International Schizophrenia Consortium 2008)(Stefansson et al. 2008). In contrast, quantitative PCR (qPCR) is a relatively cost-saving method that can provide robust findings for CNVs in targeted regions (Gomez-Curet et al. 2007)(Rose-Zerilli
2
et al. 2009)(Lv et al. 2010)(Zhou et al. 2010). High-throughput experimental settings for using qPCR in the detection of CNVs have also been established (Norskov et al. 2009).
CNVs have been postulated to be an important source of genetic susceptibility to
schizophrenia (Tam et al. 2009), which has been shown in twin studies to have strong genetic contribution (Cardno et al. 1999; Sullivan et al. 2008). Initial genome-wide searches for CNVs for schizophrenia employed BAC-array methods in small number of subjects (Moon et al. 2006; Wilson et al. 2006), whereas many later studies utilized SNP chips for genome-wide CNV detection in schizophrenia patients of large sample size (Stefansson et al. 2008; The International Schizophrenia Consortium 2008; Vrijenhoek et al. 2008; Walsh et al. 2008; Xu et al. 2008). Two CNVs in 1q21.1 and 15q13.3, respectively, were consistently discovered to be present in patients with schizophrenia in two different studies with a frequency ranging from 0.2% to 0.6%, higher than their counterparts in healthy controls (Stefansson et al. 2008;
The International Schizophrenia Consortium 2008). A deletion-form of the CNV in 1q21.1 was also of increased frequency in Japanese schizophrenia patients, though not reaching statistical significance (Ikeda et al. 2010). These findings on CNVs in schizophrenia patients appear to be compatible with the proposition of “common disease, rare variants” (McClellan et al. 2007; Pritchard 2001). Under this circumstance, it is important to search for CNVs in individual patients with schizophrenia in an efficient but robust way.
In this study, we aimed to evaluate the feasibility of a two-stage qPCR approach in detecting CNVs in two chromosomal regions, 1q21.1 and 2q22.1, in patients with
schizophrenia and their families. The first region in 1q21.1 was chosen because it was the most frequent CNV among the two CNVs replicated in patients with schizophrenia (Stefansson et al. 2008; The International Schizophrenia Consortium 2008). The second region in 2q22.1 was chosen because it had the most significant linkage signal derived from
3
an ordered subset analysis linkage analysis (Lien. et al. submitted). In the first-stage
genotyping, qPCR was performed for each subject with two replicates. Those subjects with an excessively high or low ∆Ct value and their family members were then selected for
second-stage genotyping, with the number of replicate increased to four to decrease
experimental uncertainty. Confirmed CNVs were then determined whether they were de novo mutation by means of the genotype distribution within each family. The relations of the CNVs to schizophrenia were evaluated using family-based association analysis.
4
MATERIALS AND METHODS
Study subjects
The study sample consisted of patients with schizophrenia and their first-degree relatives recruited from six data collection research centers throughout the nation in the Taiwan
Schizophrenia Linkage Study (TSLS) between 1998 and 2002 (Hwu et al. 2005). These families were ascertained on the basis of sib-pairs co-affected with schizophrenia, which included only families of Han Chinese ancestry. Out of the original 2490 individuals from 607 families, the DNA specimens were available for 2462 subjects of 607 families, including 1556 siblings (1252 affected, 80.5%) and 906 parents (65 affected, 7.2%). All participants provided written informed consent and the study was approved by both the US Department of Health and Human Services and the National Taiwan University Hospital’s Internal Review Board of Human Studies.
Before the genotyping, the DNA samples of 156 subjects were randomly selected to undergo a pilot study that was designed to test laboratory conditions.
Measurement
All participants were interviewed by well-trained assistants using the Diagnostic Interview for Genetic Studies (DIGS), which was designed specifically for family-genetic studies of schizophrenia with good inter-rater reliabilities (Nurnberger et al. 1994). The Chinese version of the DIGS was translated by two psychiatrists and one psychiatric
epidemiologist, and its reliability was good in Taiwanese population (Chen et al. 1998). The Chinese version of the Family Interview for Genetic Studies (FIGS) (NIMH Genetics Initiative 1992) was used to collect relevant information on relatives who were not
5
interviewed for the study. On the basis of information assembled in the DIGS, the FIGS, and clinical information from medical records, best estimate lifetime psychiatric diagnoses were determined according to the criteria of the Diagnostic and Statistical Manual of Mental Disorders, Fourth Edition (American Psychiatric Association 1994). Patients’ clinical
symptoms were assessed using the Schedule for Assessment of Negative Symptoms (SANS) (Andreasen 1983) and Schedule for Assessment of Positive Symptoms (SAPS) (Andreasen 1984).
In addition, each participant was administered the Continuous Performance Test (Beck et al. 1956). The CPT procedure has been described in detail elsewhere (Chen et al. 1998).
Briefly, numbers from 0 to 9 were randomly presented for 50 msec each, at a rate of one per second. Each subject undertook two CPT sessions: the undegraded 1-9 tasks and 25%
degraded 1-9 tasks. Sensitivity (d´), derived from the hit rate (probability of response to target trials) and false alarm rate (probability of response to nontarget trials), reflects an individual’s ability to discriminate target stimuli from nontarget ones.
Genotyping
Real-time TaqMan assay conditions
Three CNV markers were chosen for genotyping using TaqMan® Copy Number Assays on the ABI7900 (Applied Biosystems, Foster City, CA, USA), with markers 1 and 2 located on 2q22.1 (HNMT gene) and marker 3 on 1q21.1 (GJA8 gene) (Table 1). For each probe, the 5’ end was labeled with FAMTM reporter dye, and the 3’ end with a nonfluorescent quencher (NFQ) and a Minor Groove Binder (MGB), which allows for shorter probes by means of increasing the melting temperature. TaqMan RNase P (Applied Biosystems) was used as the endogenous control, with its probe being labeled with VIC reporter dye and TAMRATM
6
quencher. The PCR condition to amplify the target regions and endogenous control using ABI 7900HT was set as follows: 50°C for 2 minutes, 95°C for 10 minutes, and then 40 cycles with 95°C for 15 seconds and 60°C for 1 minute.
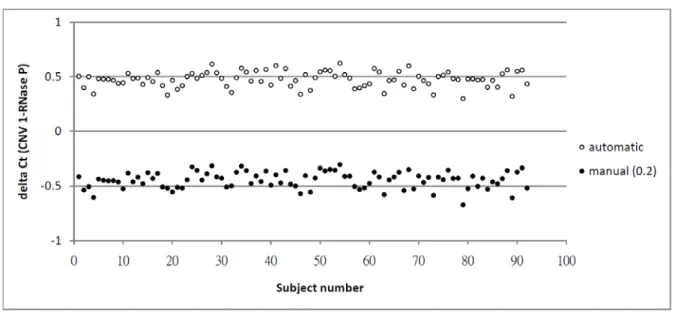
In determining the threshold cycle (Ct), two methods were compared: automatic setting provided in the Sequence Detection System (SDS) software version 2.2 (Applied Biosystems) versus manual setting. The automatic setting can formulate an appropriate threshold for all the PCRs on each plate, which contains 384 wells, and may vary from plate to plate. To make the threshold cycles comparable across plates, we chose 0.2 as the threshold after inspecting the amplification curves on all the plates. The scatter plot of the ∆Cts between a target gene and the endogenous control derived from the two methods of threshold setting shows similar results in the sample of pilot study of 156 subjects (Figure 1). Thus, we adopted the threshold of 0.2 manually to generate the ∆Ct of each marker for subsequent analyses.
Next, we utilized serial dilution to examine the appropriate range of DNA concentrations for multiplex PCR assay in duplicate. The slope of ∆Ct versus log DNA concentration in multiplex reaction is displayed in Figure 2. Since all the slopes were not significantly
different from zero, within the range of ± 0.1, the amplification efficiency of the target regions and RNase P could be assumed to be equal and hence the ∆Ct method could be applied in deriving the concentration of genomic NA templates.
Two-stage qPCR procedure
The DNA sample of each TSLS project, having been stored in -80°C with a
concentration of 200 ng/ul, was diluted to 5 ng/ul, which was judged to be within the range of optimal PCR efficiency for applying the ∆Ct method. For the purpose of cost-saving, 2
replicates were used for each subject in the first stage of genotyping. Then 4 replicates of each
7
subject were used for the second stage of genotyping. All the PCRs were carried out in a 384-well plate, each well containing 2 uL diluted DNA and 8 uL PCR mix (20X TaqMan Universal PCR Master Mix, 40X Taqman Copy Number Assay, 20X Taqman Copy Number Reference Assay and ddH2O). Manual setting with a threshold of 0.2 was adopted to derive
∆Cts for individual wells. On the basis of the median and standard deviation of the ∆Ct values in the whole sample, subjects can be segregated to 3 distinct genotypes according to their ∆Ct values: 1/0 (deletion, > median + 3 SD), 1/1 (wild type, in the range of medeian ± 3 SD) and 2/1 (duplication, < median − 3 SD).
In first-stage genotyping, those subjects with ∆Ct value beyond the range of median ± 3 SD were viewed as outliers. Those outliers along with their family members were then subjected to the second-stage genotyping with 4 replicates.
Statistical analysis
Mean ∆Ct over the replicates was used for each subject in the assignment of genotype.
Descriptive statistics were derived using software package SAS version 9.1.3 (SAS Institute Inc., Cary, NC, USA) and scatter plots of ∆Ct were depicted using Excel 2007 (Microsoft).
Potential association of CNVs and schizophrenia was assessed using program FBAT version 2.0.2 (Laird et al. 2000), in which subjects with de novo CVN were deleted from the analysis.
For the FBAT analysis, we used a bi-allelic additive model, with the requirement of at least one informative family.
8
RESULTS
On the basis of the first-stage genotyping for a total of 2462 subjects, the median ∆Ct value of CNV markers 1, 2 and 3 was −0.204, −0.938, and −0.085, respectively. As shown in
Figure 3, the lines of median + 3 SD and median − 3 SD are drawn on the scatter plots of ∆Ct
as the thresholds for defining outliers. Because the ∆Cts of some subjects were very close to the thresholds, these subjects and their family members were also included for thesecond-stage genotyping. The numbers of outliers for the first-stage genotyping as well as the corresponding total number of subjects included for the second-stage genotyping are
displayed in Table 2.
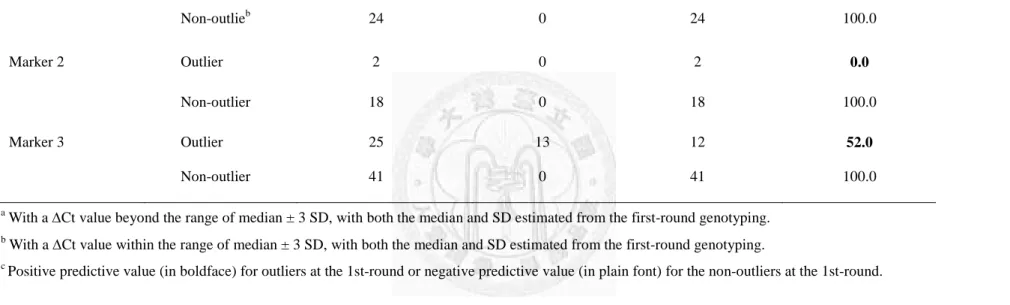
On the basis of the same thresholds, the number of first-stage outliers whose
second-stage genotyping remains as outliers was 1 out of 8 (12.5%) for marker 1, 0 out of 2 (0%) for marker 2, and 13 out of 25 (52.0%) for marker 3 (Table 2). These genotypes were considered as confirmed CNVs, with a founder-based carrier frequency of 0.11% (1/906) for marker 1 and 0.44% (4/906) for marker 3. In contrast, none of the family members whose first-stage ∆Ct values were within the normal range turned out to be outliers at the
second-stage genotyping, all with a negative predictive value of 100%.
For those with confirmed CNVs, a second-stage ∆Ct value of < median − 3 SD stands for one more copy in the target region, whereas that of > median + 3 SD stands for deletion.
Hence, an unaffected parent was judged to have duplication at marker 1, and thirteen other subjects from six families were judged to have deletion at marker 3. Among these six families for marker 3 (Figure 4), four families exhibited familial transmission in the CNVs (panels A, C, D, and E), one family had a de novo CNV (panel B), and another family could not be determined due to missing genotype in one parent (panel F).
9
For CNV marker 3, the frequency of carrying deletions in patients with schizophrenia (8/14 = 0.57) was only slightly higher than that in non-psychotic relatives (5/10 = 0.5). For a more formal association analysis, an FBAT analysis was conducted with an allele frequency of 0.002 for the deletion, which was estimated from founders. The result indicated that the deletion tended to be associated with schizophrenia, though not reaching statistical
significance (z-statistics = 1.134, P = 0.257). For these six families with confirmed CNVs in marker 3, their demographic feature, clinical status, and CPT performance indexes are
displayed in Table 3. Comparing the deletion carriers with non-carriers, there appear to be no consistent differences in terms of onset age, clinical symptoms, or CPT performance scores.
10
DISCUSSION
In this study, we utilized a two-stage qPCR approach to detect CNV at chromosomal regions in 1q21.1 and 2q22.1 among patients with schizophrenia and their families. The feasibility of our wo-stage genotyping was supported by the nearly perfect negative predictive value and reasonable positive predictive value for an arbitrary choice of the median ∆Ct value
± 3 SD as the thresholds. The results revealed that most of the CNVs found in families of siblings coaffected with schizophrenia were due to familial transmission.
Our method is particularly useful for CNV detection at targeted regions, which is becoming more important since the genetic variants contributing to complex diseases are believed to be rare rather than common. Although the choice of the thresholds at the median ± 3 SD of ∆Ct value was arbitrary in nature, our two-stage genotyping revealed that it can capture CNVs without incurring false negatives and be cost-saving by means of 2-replicate in the first-stage genotyping. Compared with array-based approach, our method does not require high quality and high concentration of DNA samples, and the data management and analysis is easier..
Among the three markers genotyped in this study, only marker 1 (near HNMT gene in 2q22.1, with a frequency of 0.11%) and marker 3 (near GJA8 gene in 1q21.1, with a
frequency of 0.44%) were found to have CNV in our sample. For comparison, a genomewide search for CNV among 813 Han-Chinese subjects in Taiwan failed to find any CNV at 2q22.1 (Lin et al. 2009), whereas a study among 2906 Islanders from Kosrae Micronesia reported a deletion at 2q22.1 with a frequency of 0.17% (Gusev et al. 2009). Taken together, the CNV around 2q22.1 is relatively rare in these populations. In terms of CNV around 1q21.1, one study among Chinese subjects did not find any CNV (Stefansson et al. 2008), another study in
11
North American population found a duplication of 0.17% (Zogopoulos et al. 2007), and a third study among Japanese subjects found a deletion of 0.17% in patients with schizophrenia but 0% in healthy controls (Ikeda et al. 2010). It appears that the frequency of the CNV around 1q21.1 is relatively more common in our sample. Moreover, our family-based association analyses indicate that the deletion around 1q21.1 might be related to schizophrenia.
Another strength of this study is that we included nuclear families for the genotyping and hence was able to determine whether the CNV is familial or de novo. Since our sample is families of siblings co-affected with schizophrenia, the majority of the relatively more
common CNV in 1q21.1 turned out to be due to familial transmission. Intriguingly, a previous study found that a de novo CNV in 1q21.1 was associated with schizophrenia, especially in sporadic cases (Xu et al. 2008). It warrants further investigation in schizophrenia patients of simplex families to clarify this.
Some limitations of this study should be kept in mind when interpreting our results. First, the limited number of markers used in our qPCR approach did not allow us to define the boundary of the CNV. Second, despite our relatively large number of nuclear families, our sample size remains not large enough to capture some very rare CNV. Third, the family-based association analysis conducted in this study may suffer from the rare occurrence of the CNV in the sample. Alternatively, future study may benefit from adopting a new approach by replacing definitive genotype assignment with intensity score (Ionita-Laza et al. 2008), or employing a Bayesian approach (Kosta et al. 2007).
In summary, this study examined the feasibility of a two-stage qPCR approach in detecting CNVs at 2q22.1 and 1q21.1 among patients with schizophrenia and their families.
The results indicate that our two-stage qPCR approach is cost-saving in searching for CNVs
12
at targeted regions. The results also revealed that most of the CNVs found in families of patients with schizophrenia were due to familial transmission.
13
REFERENCES
American Psychiatric Association. Diagnostic and statistical manual (DSM-IV). 4th edition.
Washington, DC: American Psychiatric Press (1994).
Andreasen, N. C. The Scale for the Assessment of Negative Symptoms (SANS): conceptual and theoretical foundations. Br J Psychiatry Suppl (1983) (7):49-58.
Andreasen, N. C. The Scale for the Assessment of Positive Symptoms (SAPS). Br J
Psychiatry Suppl (1984):49-58.
Beck, L. H., Bransome, E. D., Jr., Mirsky, A. F., et al. A continuous performance test of brain damage. J Consult Psychol (1956) 20(5):343-350.
Bieche, I., Olivi, M., Champeme, M. H., et al. Novel approach to quantitative polymerase chain reaction using real-time detection: application to the detection of gene amplification in breast cancer. Int J Cancer (1998) 78(5):661-666.
Cardno, A. G., Marshall, E. J., Coid, B., et al. Heritability estimates for psychotic disorders:
the Maudsley twin psychosis series. Arch Gen Psychiatry (1999) 56(2):162-168.
Chen, W. J., Liu, S. K., Chang, C. J., et al. Sustained attention deficit and schizotypal personality features in nonpsychotic relatives of schizophrenic patients. Am J
Psychiatry (1998) 155(9):1214-1220.
Dhami, P., Coffey, A. J., Abbs, S., et al. Exon array CGH: detection of copy-number changes at the resolution of individual exons in the human genome. Am J Hum Genet (2005) 76(5):750-762.
Faraone, S. V., Lasky-Su, J., Glatt, S. J., et al. Early onset bipolar disorder: possible linkage to chromosome 9q34. Bipolar Disord (2006) 8(2):144-151.
Feuk, L., Carson, A. R., and Scherer, S. W. Structural variation in the human genome. Nat Rev
14
Genet (2006) 7(2):85-97.
Gomez-Curet, I., Robinson, K. G., Funanage, V. L., et al. Robust quantification of the SMN gene copy number by real-time TaqMan PCR. Neurogenetics (2007) 8(4):271-278.
Gusev, A., Lowe, J. K., Stoffel, M., et al. Whole population, genome-wide mapping of hidden relatedness. Genome Res (2009) 19(2):318-326.
Hwu, H. G., Faraone, S. V., Liu, C. M., et al. Taiwan schizophrenia linkage study: the field study. Am J Med Genet B Neuropsychiatr Genet (2005) 134B(1):30-36.
Iafrate, A. J., Feuk, L., Rivera, M. N., et al. Detection of large-scale variation in the human genome. Nat Genet (2004) 36(9):949-951.
Ikeda, M., Aleksic, B., Kirov, G., et al. Copy number variation in schizophrenia in the Japanese population. Biol Psychiatry (2010) 67(3):283-286.
Ionita-Laza, I., Perry, G. H., Raby, B. A., et al. On the analysis of copy-number variations in genome-wide association studies: a translation of the family-based association test.
Genet Epidemiol (2008) 32(3):273-84.
ISC. Rare chromosomal deletions and duplications increase risk of schizophrenia. Nature (2008) 455(7210):237-241.
Jakobsson, M., Scholz, S. W., Scheet, P., et al. Genotype, haplotype and copy-number variation in worldwide human populations. Nature (2008) 451(7181):998-1003.
Kosta, K., Sabroe, I., Goke, J., et al. A Bayesian approach to copy-number-polymorphism analysis in nuclear pedigrees. Am J Hum Genet (2007) 81(4):808-12.
Laird, N. M., Horvath, S., and Xu, X. Implementing a unified approach to family-based tests of association. Genet Epidemiol (2000) 19 Suppl 1:S36-42.
Lewis, C. M., Levinson, D. F., Wise, L. H., et al. Genome scan meta-analysis of schizophrenia and bipolar disorder, part II: Schizophrenia. Am J Hum Genet (2003) 73(1):34-48.
15
Lien., Y.-J., Hsiao., P.-C., Liu., C.-M., et al. Genetic Linkage Evidence for Distinct Subtypes of Schizophrenia Characterized by Age at Onset and Neurocognitive Deficits,
submitted.
Lin, C. H., Lin, Y. C., Wu, J. Y., et al. A genome-wide survey of copy number variations in Han Chinese residing in Taiwan. Genomics (2009) 94(4):241-246.
Locke, D. P., Segraves, R., Nicholls, R. D., et al. BAC microarray analysis of 15q11-q13 rearrangements and the impact of segmental duplications. J Med Genet (2004) 41(3):175-82.
Lv, J., Yang, Y., Zhou, X., et al. FCGR3B copy number variation is not associated with lupus nephritis in a Chinese population. Lupus (2010) 19(2):158-161.
McClellan, J. M., Susser, E., and King, M. C. Schizophrenia: a common disease caused by multiple rare alleles. Br J Psychiatry (2007) 190:194-9.
Moon, H. J., Yim, S. V., Lee, W. K., et al. Identification of DNA copy-number aberrations by array-comparative genomic hybridization in patients with schizophrenia. Biochem
Biophys Res Commun (2006) 344(2):531-539.
NIMH Genetics Initiative. Family Interview for Genetic Studies. Rockville, MD: National Institute of Mental Health (1992)
Ng, M. Y., Levinson, D. F., Faraone, S. V., et al. Meta-analysis of 32 genome-wide linkage studies of schizophrenia. Mol Psychiatry (2009) 14(8):774-785.
Norskov, M. S., Frikke-Schmidt, R., Loft, S., et al. High-throughput genotyping of copy number variation in glutathione S-transferases M1 and T1 using real-time PCR in 20,687 individuals. Clin Biochem (2009) 42(3):201-209.
Nurnberger, J. I., Jr., Blehar, M. C., Kaufmann, C. A., et al. Diagnostic interview for genetic studies. Rationale, unique features, and training. NIMH Genetics Initiative. Arch Gen
16
Psychiatry (1994) 51(11):849-859; discussion 863-864.
Ponchel, F., Toomes, C., Bransfield, K., et al. Real-time PCR based on SYBR-Green I fluorescence: an alternative to the TaqMan assay for a relative quantification of gene rearrangements, gene amplifications and micro gene deletions. BMC Biotechnol (2003) 3:18.
Pritchard, J. K. Are rare variants responsible for susceptibility to complex diseases? Am J
Hum Genet (2001) 69(1):124-37.
Redon, R., Ishikawa, S., Fitch, K. R., et al. Global variation in copy number in the human genome. Nature (2006) 444(7118):444-454.
Rose-Zerilli, M. J., Barton, S. J., Henderson, A. J., et al. Copy-number variation genotyping of GSTT1 and GSTM1 gene deletions by real-time PCR. Clin Chem (2009)
55(9):1680-1685.
Sebat, J., Lakshmi, B., Troge, J., et al. Large-scale copy number polymorphism in the human genome. Science (2004) 305(5683):525-528.
Sharp, A. J., Locke, D. P., McGrath, S. D., et al. Segmental duplications and copy-number variation in the human genome. Am J Hum Genet (2005) 77(1):78-88.
Stankiewicz, P., and Lupski, J. R. Genome architecture, rearrangements and genomic disorders. Trends Genet (2002) 18(2):74-82.
Stefansson, H., Rujescu, D., Cichon, S., et al. Large recurrent microdeletions associated with schizophrenia. Nature (2008) 455(7210):232-236.
Sullivan, P. F., Lin, D., Tzeng, J. Y., et al. Genomewide association for schizophrenia in the CATIE study: results of stage 1. Mol Psychiatry (2008) 13(6):570-584.
Tam, G. W., Redon, R., Carter, N. P., et al. The role of DNA copy number variation in schizophrenia. Biol Psychiatry (2009) 66(11):1005-1012.
17
The International Schizophrenia Consortium. Rare chromosomal deletions and duplications increase risk of schizophrenia. Nature (2008).
Vrijenhoek, T., Buizer-Voskamp, J. E., van der Stelt, I., et al. Recurrent CNVs disrupt three candidate genes in schizophrenia patients. Am J Hum Genet (2008) 83(4):504-510.
Walsh, T., McClellan, J. M., McCarthy, S. E., et al. Rare structural variants disrupt multiple genes in neurodevelopmental pathways in schizophrenia. Science (2008)
320(5875):539-543.
Wilson, G. M., Flibotte, S., Chopra, V., et al. DNA copy-number analysis in bipolar disorder and schizophrenia reveals aberrations in genes involved in glutamate signaling. Hum
Mol Genet (2006) 15(5):743-749.
Xu, B., Roos, J. L., Levy, S., et al. Strong association of de novo copy number mutations with sporadic schizophrenia. Nat Genet (2008) 40(7):880-885.
Yan, L., Szumlanski, C. L., Rice, S. R., et al. Histamine N-methyltransferase functional polymorphism: lack of association with schizophrenia. Am J Med Genet (2000) 96(3):404-406.
Zhou, X.-j., Lv, J.-c., Bu, D.-f., et al. Copy number variation of FCGR3A rather than FCGR3B and FCGR2B is associated with susceptibility to anti-GBM disease. Int.
Immunol. (2010) 22(1):45-51.
Zogopoulos, G., Ha, K. C., Naqib, F., et al. Germ-line DNA copy number variation frequencies in a large North American population. Hum Genet (2007) 122(3-4):345-353.
18
Table 1. The information of the CNV markers selected for this study.
CNV marker Regions (gene) Assay ID Probe sequence
Marker 1 2q22.1 (HNMT) Hs01075733_cn ATACATTATTGGACTTCCATTTGGA
Marker 2 2q22.1 (HNMT) Hs00435589_cn CTCAACCATTCCACGGAACACCAGT
Marker 3 1q21.1 (GJA8) Hs02290971_cn ATCCCTCCACTCCATTGCTGTCTCC
19
Table 2. The results of comparing the first round (2-replicate) ( number of subjects = 2462) and second round (4-replicate) genotypings Results of N. of subjects for
2nd-round genotyping
Results of 2nd-round genotyping
CNV markers 1st-round genotyping Outlier Non-outlier PPV or NPV (%)c
Marker 1 Outliera 8 1 7 12.5
Non-outlieb 24 0 24 100.0
Marker 2 Outlier 2 0 2 0.0
Non-outlier 18 0 18 100.0
Marker 3 Outlier 25 13 12 52.0
Non-outlier 41 0 41 100.0
a With a ∆Ct value beyond the range of median ± 3 SD, with both the median and SD estimated from the first-round genotyping.
b With a ∆Ct value within the range of median ± 3 SD, with both the median and SD estimated from the first-round genotyping.
c Positive predictive value (in boldface) for outliers at the 1st-round or negative predictive value (in plain font) for the non-outliers at the 1st-round.
20
Table 3. Demographic features, clinical assessment, and performance on the Continuous Performance Test (CPT) for 6 families with confirmed CNV at marker 3.
Family IDa Sex Age Schizophrenia Age at onsetc
Global score of SAPSd and SANSe CPT (undegraded) CPT (degraded)
Positive Negative Disorganizing D’ ln β D’ ln β
A 1 F 31 Affected 20 4 1 2 -4.70 -2.27 -4.15 -2.75
2* F 29 Affected 14 6 - 5 -0.17 0.82 -4.36 -3.12
3* M 63 Unaffected - 0 2 1 -1.51 -3.52 -1.17 -1.90
4 F 55 Unaffected - 3 5 4 -3.66 -2.10 -1.99 -1.49
B 1 M 40 Affected 19 2 - 5 -2.46 -1.70 -2.26 -1.40
2* F 35 Affected 17 4 - 1 -0.62 1.73 -1.63 -0.02
3 M 66 Affectedb - 0 1 0 -1.93 -1.85 -3.28 -3.39
4 F 59 Unaffected - 0 1 0 0.43 -4.03 -2.72 -2.46
C 1* F 40 Affected 25 4 7 4 -3.07 -0.74 -5.12 -5.65
2* M 48 Affected 35 0 - 1 -1.87 1.76 -3.34 -1.87
3* M 72 Unaffected - 0 1 0 -1.91 -2.22 -2.44 -1.92
4* F 42 Unaffected - 0 0 0 -0.53 1.70 -3.95 -2.28
D 1* F 45 Affected 25 2 7 1 -3.44 -1.83 -2.31 -1.38
2 M 47 Affected 17 4 3 1 0.85 -0.13 0.11 1.76
3 M 74 Unaffected - 0 0 0 0.97 0.61 -0.85 -0.20
4* F 69 Unaffected - 0 0 0 -3.10 -2.35 -2.68 -2.49
E 1* M 27 Affected 19 - 8 4 -5.97 -2.15 -4.39 -2.41
2* M 24 Affected 18 8 4 7 -4.05 -2.14 -3.78 -1.70
3 M 51 Unaffected - 0 0 0 -0.11 1.18 0.11 0.14
4* F 49 Unaffected - 0 0 0 -4.33 -2.24 -3.36 -2.54
21
Table 3. Demographic features, clinical assessment, and performance on the Continuous Performance Test (CPT) for 6 families with confirmed CNV at marker 3 (continued)
Family IDa Sex Age Schizophrenia Age at onsetb
Global score of SAPSc and SANSd CPT (undegraded) CPT (degraded)
Positive Negative Disorganizing D’ ln β D’ ln β
F 1 M 37 Affected - - - - -3.57 -1.19 -2.91 -1.45
2* M 41 Affected 22 6 6 5 -1.14 -4.15 -1.68 -1.68
3 M 72 Unaffected - 0 0 0 -0.28 -3.42 -2.18 -2.13
4 F 50 Unaffected - 0 0 1 -0.28 -1.11 0.56 0.31
* Carriers of a deletion at CNV marker 3 (1q21.1)
a ID = 1 or 2 for affected siblings, and ID = 3 or 4 for parents.
b Onset age for schizophrenia
c Schedule for Assessment of Positive Symptoms
d Schedule for Assessment of Negative Symptoms
22
Figure 1. The scatter plot of ∆Ct values determined using an automatic setting vs. that of ∆Ct
values determined using a manual setting with 0.2 as the threshold in 96 subjects with 4 replicates contained in a single plate.23
Figure 2. Evaluation of amplification efficiency in serial dilution for three CNV markers (A = marker 1, B = marker 2, and C = Marker 3)
A B C
24
Figure 3. The scatter plot of the ∆Ct values in the first-round genotyping for all subjects (A = marker 1, B = marker 2, and C = marker 3).
A B C
A B C
25