College of Management
I-Shou University
Master Thesis
Evaluating Operational and
Risk-management Efficiency of
Commercial Banks in Vietnam and Taiwan
Advisor: Dr. Tsai, Ming-Chi
Graduate Student: Phan, Thi Phuong (Ivy)
i
Acknowledgements
I wish to express my deep gratitude to my thesis advisor Dr. Tsai, Ming-Chi, Department of Business Administration at I-Shou University in Taiwan, who always guided and encouraged me in the research process. He also provided me with the necessary documents as well as the methods to do research. He was always willing to help me when I have difficulty in research. I am very grateful to him for sharing his knowledge and professional experience with me so that I can complete my master thesis.
In addition, I would like to express my sincere thanks to the committee members, Dr. Fang, Wen-Hsin, Department of Business Administration at I-Shou University and Dr. Huang, Hui-Ling, Department of Business Administration at Chang Jung Christian University those who helped me to correct my paper and gave me valuable comments and suggestions about my thesis also.
Finally, special thanks to my Taiwanese friends those who helped me to find information and data of Taiwanese banks. Also, thanks to my classmates those who supported, shared and encouraged me in the time living and learning in Taiwan.
ii
Abstract
The commercial bank has formed, existed and developed for many years ago and it has gone with the development of commodity economy. It is also considered as the circulatory system of the capital of national and global economy. Because of its important role towards the economy, especially for market economy, commercial bank becomes more essential with every passing day. In general, commercial bank both holds the balance trade and decides the success or failure of an economy. Vietnam is a developing country and expected to have strong growth potential in the future. Besides, Vietnam has an important geographical location and as a link between Southeast and Northeast Asia. Taiwan is known as the country with a developed economy and has close corporation with Vietnam in recent years. They both are influenced by the impact of global economic crisis and overcome its consequence such as bad debt increasing, falling in investment, etc. For that reason, the purpose of this study is to propose some suggestions to improve performance of commercial banking system in Vietnam and Taiwan by evaluating operational and risk-management efficiency of 44 commercial banks in Vietnam and Taiwan by using Data Envelopment Analysis (DEA). Applying a two-stage DEA model, this study can assess the whole of banks efficiency. Based on the results of technical efficiency (TE), pure technical efficiency (PTE), scale efficiency (SE), the performance of the banks can be evaluated. Besides, this study also uses the slack analysis is to provide suggestions to improve banks efficiency and sensitivity analysis is to define the elements affect banks operation. Finally, the performance of banking system in Vietnam and Taiwan would be compared.
Keywords: commercial banks; operational efficiency; risk-management efficiency; Data
iii
Table of Contents
Acknowledgements ... i Abstract ... ii List of Tables ... v List of Figures ... viList of Abbreviations ... vii
Chapter 1 INTRODUCTION ... 1
1.1 Research Background ... 1
1.2 Problem Statement and Research Objectives ... 2
1.3 Research Significance ... 4
1.4 Research Process ... 5
Chapter 2 LITERATURE REVIEW ... 6
2.1 The Operational Efficiency ... 6
2.2 The Risk-Management Efficiency ... 7
2.3 An Overview of Commercial Banks in Vietnam and Taiwan ... 9
2.3.1 Vietnam commercial banks ... 9
2.3.2 Taiwan commercial banks ... 11
2.4 Data Envelopment Analysis ... 12
2.4.1 DEA–CCR model ... 13 2.4.2 DEA–BCC model ... 15 2.4.3 Slack analysis ... 16 2.4.4 Sensitivity analysis ... 17 2.4.5 Sorting ... 18 2.4.5.1 Assurance region ... 19
2.4.5.2 Common compromise weights ... 19
2.4.5.3 Cross efficiency ... 20
2.4.5.4 A&P model ... 20
Chapter 3 RESEARCH METHODOLOGY ... 22
3.1 Research Framework ... 22
3.2 Selection of Input and Output Items ... 23
3.3 Data Collection ... 26
Chapter 4 RESULT AND DISCUSSION ... 29
4.1 The First Stage Efficiency Analysis ... 29
4.1.1 Descriptive statistics analysis ... 29
4.1.2 Correlation ... 30
4.1.3 Efficiency analysis ... 31
4.1.4 Slack analysis ... 34
iv
4.1.6 Sorting ... 40
4.2 The Second Stage of Efficiency Analysis ... 42
4.2.1 Descriptive analysis... 42 4.2.2 Correlation ... 43 4.2.3 Efficiency analysis ... 43 4.2.4 Slack analysis ... 46 4.2.5 Sensitivity analysis ... 48 4.2.6 Sorting ... 50
4.3 Two Stages Analysis Comparison... 52
4.4 Banks’ Performance Comparison ... 54
Chapter 5 CONCLUSIONS AND SUGGESSIONS ... 57
5.1 Research Summary ... 57
5.2 Suggestions ... 58
5.2.1 Suggestions for Vietnam commercial banks ... 58
5.2.2 Suggestions for Taiwan commercial banks ... 59
5.3 Research Limitations ... 60
5.4 Suggestions for Future Research ... 60
Bibliography ... 62
Appendix A.1 The Data of 44 Commercial Banks in 2012 (Stage 1) ... 68
Appendix A.2 The Data of 44 Commercial Banks in 2012 (Stage 2) ... 70
Appendix B.1 Technical efficiency scores of the banks over the years 2008-12 (Stage 1) ... 72
Appendix B.2 Technical efficiency scores of the banks over the years 2008-12 (Stage 2) ... 74
Appendix C.1 Projections to improve efficient score for inefficient DMUs (Stage 1) ... 76
Appendix C.2 Projections to improve efficient score for inefficient DMUs (Stage 2) ... 82
Appendix D.1 The efficient scores of CCR, CCW and AR model (Stage 1) ... 90
Appendix D.2 The efficient scores of CCR, CCW and AR model (Stage 2) ... 92
Appendix E Comparison between two stages ... 94
v
List of Tables
Table 2.1: Efficient level of sensitivity analysis ... 18
Table 3.1: Selection of input and output items in previous researches………....23
Table 3.2: List of commercial banks in Vietnam and Taiwan ... 27
Table 4.1: The first stage analysis - Descriptive statistics on Inputs and Outputs data ……….29
Table 4.2: The first stage analysis - Correlation of Inputs and Outputs ... 30
Table 4.3: The first stage efficiency analysis ... 31
Table 4.4: The first stage analysis - The slack analysis of the banks ... 35
Table 4.5: The first stage analysis – Sensitivity analysis for the banks ... 38
Table 4.6: The second stage analysis - Descriptive statistics on Input and Output data ... 42
Table 4.7: The second stage analysis – Correlation of Inputs and Outputs ... 43
Table 4.8: The second stage efficiency analysis ... 43
Table 4.9: The second stage analysis – The slack analysis of the banks ... 46
Table 4.10: The second stage analysis – Sensitivity analysis for the banks ... 48
Table 4 11: t-Test analysis: Evaluating operational efficiency of the banks ... 54
vi
List of Figures
Figure 1 1: Research process of this study ... 5
Figure 2 1: Vietnam- Credit growth and GDP growth trend line ……….9
Figure 2 2: The SWOT analysis of Vietnam commercial banks ... 11
Figure 2 3: The SWOT analysis of Taiwan commercial banks ... 12
Figure 3.1: Research framework of this study………....22
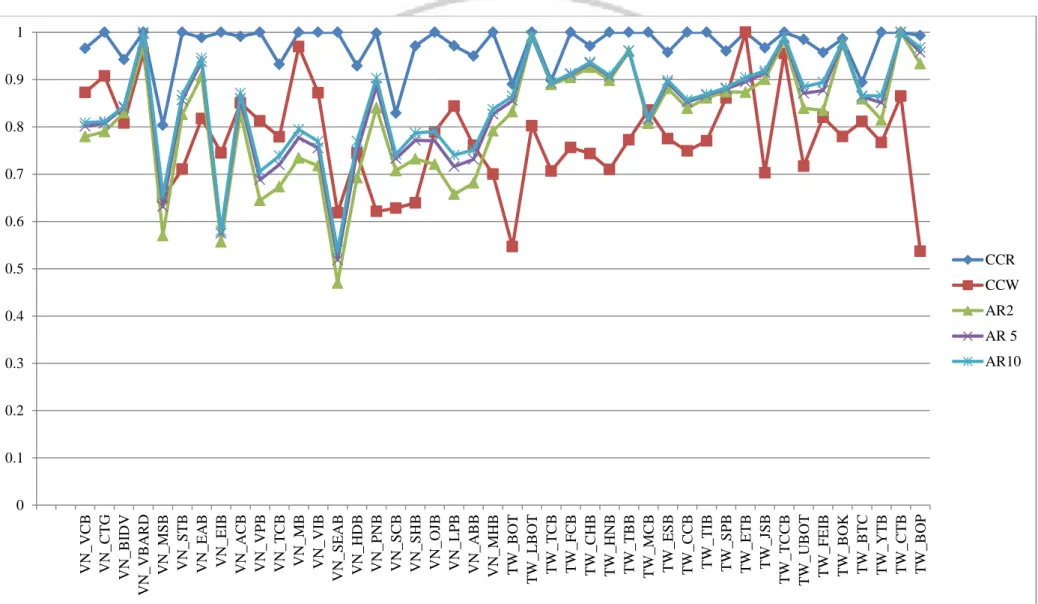
Figure 4.1: The first stage - Comparison between CCR, CCW, AR method... …………41
Figure 4.2: The second stage analysis - Comparison between CCR, CCW, AR method ... 51
vii
List of Abbreviations
Abbreviations Meaning
WTO World Trade Organization
APEC Asia Pacific Economic Cooperation
US The United State
GDP Gross Domestic Product
DEA Data Envelopment Analysis
ROA Return on Assets
ROE Return on Equity
SOCBs State Own Commercial Banks
JSCBs Joint Stock Commercial Banks
FBs & FBBs Foreign Banks & Foreign Bank Branches
JVs Joint venture
DMU Decision Making Unit
CCR Charnes, Cooper and Rhodes
CRS Constant Returns to Scale
RTS Returns to Scale
IRS Increasing Returns to Scale
DRS Decreasing Returns to Scale
BCC Banker, Charnes and Cooper
VRS Variable Returns to Scale
TE Technical Efficiency
PTE Pure Technical Efficiency
SE Scale Efficiency
CW Common Weight
CE Cross Efficiency
AR Assurance Region
EPS Earnings Per Share
NPL Non-performing loans
HSBC The Hong Kong and Shanghai Banking
1
Chapter 1 INTRODUCTION
Excluding the impact of the global economic crisis, as one of the member of the WTO, Vietnam has potential to develop country on all sides of economy especially import – export operations. It makes a great opportunity for the development of trade relations between Vietnam and Taiwan. Besides, these two countries both are the members of the WTO and APEC, which shows that the relationship between them is closer. Therefore, banking services are considered as a key of international trade. The development of banking system also helps the international trade operations more efficient and promotes international economic integration of these two countries. In this chapter, the author will introduce more clearly about the research motivation and the importance of this study.
1.1 Research Background
According to Hagiwara (2010), “the economic crisis of 2008-09 has caused a serious fall in international trade around the world” and after 5 years of struggling with the financial crisis and the most severe recession so far, the world economy began to show signs of recovery. Although, it is not really stable because the US and the Eurozone continue facing financial difficulties.
For Vietnam economy, “like the rest of East Asia, Vietnam suffered a sharp decline in economic growth in 2008 and 2009 as the region felt the impact of the global financial crisis” (Manning, 2010). However, after the WTO accession, although there were many Vietnamese enterprises focused on production and business, made great profits for society. Nevertheless, there were also a lot of firms and individuals speculated in assets and neglected their business and leading to loss-making businesses and rising bad debts. For banking sector, there are two impacts for Vietnamese commercial banks. On the positive impact, according to Nguyen (2013), commercial bank is still a major channel to meet
2
capital for the economy and significant contribute to annual GDP growth. In this international integration, competition is the motivation to reform and renovate banking system. On the negative impact, those are challenges for opening the banking and finance market for Vietnamese banking system. The participation in the international economic integration means increasing risks and sensibility of domestic financial market for the fluctuations of the international market such as the international economic crisis. Additionally, domestic banks have to face up to the competition with foreign banks in management ability, price, service, etc. (Do, 2013).
As for Taiwan’s economy, according to Taiwan commercial banking report (2012), this country is now an advanced economy, a developed industrial country with good infrastructure and high technology, workforces are trained with high quality, and the 4th largest foreign exchange reserves in the world. Contrary to these strengths, Taiwan has to face sensitive matter with the rise of China, especially in manufacturing sector. Like a small island in Asia, Taiwan still has high dependence on outside factors of this country. In general, Taiwan’s economy was also affected by the impact of global economic crisis and in addition, Taiwan has to struggle with the rise of China. It is observed from the results that banking system in Taiwan is over-fragmented, which causes many difficulties for Taiwanese banks to have a stable growth.
1.2 Problem Statement and Research Objectives
In the Taiwan’s economic policy towards ASEAN, Vietnam always occupies a priority position. Currently, the Vietnamese Government extremely concerns about foreign investors, especially Taiwanese investors. Although there are some difficulties in infrastructure, Vietnam is still a good country for investment (Nguyen & Trinh, 2011). Many Taiwanese businesses have been familiar with the Vietnamese market and have
3
achieved much success and profit in there. That is the reason why the author conducts the research regarding the banking system in both Vietnam and Taiwan.
This research studies on estimating operational capabilities as well as risk-management abilities of commercial banks in Vietnam and Taiwan. Through the input and output data taken from Financial Statement and Balance Sheet of commercial banks, and based on the DEA model and data processing, the results are evidences and tools to assess operational efficiency and risk management ability of banks. The DEA model has been used in many studies over the world and will be presented in more details in next chapter.
From background and main objective that were pointed out above, they show that although Vietnam and Taiwan are two different countries in economic level but they also have some problems with bank and finance factors. Therefore, the problem statement of this research will be presented through several research questions:
1. How do commercial banks in Vietnam and Taiwan operate?
2. What factors affect operational ability and risk-management ability of commercial banks?
3. How can the banks manage their operation and risk management well?
By following these research questions, the research objectives can be summarized out: 1. Systematize and illuminate theoretical basis in operational efficiency and
risk-management of commercial bank and then investigating the factors that affect banks’ efficiency.
2. Using the secondary data retrieved from banks’ annual report to evaluate the actual situation of commercial banks in these two countries. After that, indicating how banks in Vietnam and Taiwan operate.
4
3. Propose some assessments and suggestions for the banks to enhance operational efficiency as well as risk-management efficiency.
1.3 Research Significance
This research already indicated objectives of research as mentioned above, and indicated that operational efficiency and risk-management are two important factors for any commercial bank. These affect the assessment of a bank’s health. For that reason and from the results, the rankings about operations and risk-management quality of commercial banks are pointed out. Hence, it is very useful for those who are interested in banking sector such as managers, investors or government to evaluate banks’ health. For instance, they may obtain the useful information about which banks are currently good and vice versa.
Moreover, this research is also carried out on a wide scale that is evaluating efficiency of commercial banks in two countries – Vietnam and Taiwan. Therefore, it may be a quite fresh research so far because there are many previous researches done with small scale as one nation for example. Although there were a lots of researches in banking sector but most of them are only focus on individual factor such operational efficiency or risk-management efficiency. This study will be done with both factors. Thus, the author would like to analyze this problem with a two-stage DEA model. It would be better than researches whom using DEA with one-stage. This is because, at the first stage, one bank can be effective and get a high score but it may not get an absolutely score at the second stage. Based on the two-stage of DEA model, this paper will fill a gap in previous studies and help managers to conduct the assessment more objectively and precisely than other researches.
From these points, this research will have a significant implication for commercial banks in Vietnam and Taiwan in improving their operational and risk-management efficiency as well as in the national economy development.
5
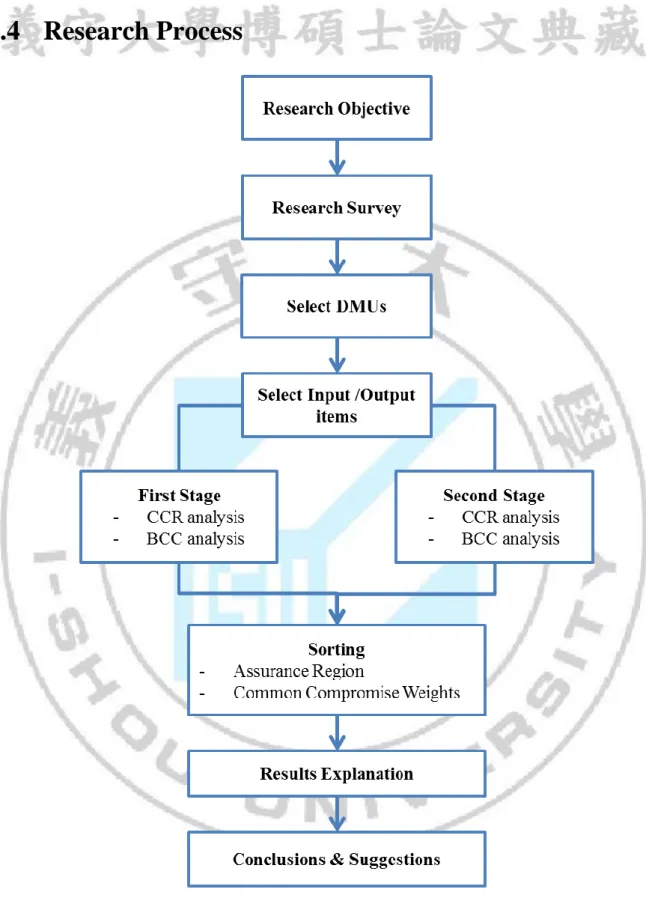
1.4 Research Process
6
Chapter 2 LITERATURE REVIEW
In this chapter, the author will introduce the necessary theoretical contents related to the purposes of this research, with an overview of commercial banks in Vietnam and Taiwan. Then the important content is to introduce about DEA model and the literature reviews that using this model to research in banking sector.
2.1 The Operational Efficiency
As one of the financial institutions, commercial bank is responsible for relationship between lenders and borrowers. They provide a variety of important products and services such as deposits, loans, foreign exchange, electronic banking, credit card, etc. Therefore, operational quality is always the top concern of commercial banks. According to Marie et al (2013), evaluating efficiency of commercial bank and its service quality is an important problem to governments, customers, and managers.
In general, operational efficiency reflects quality side of business activities, and comparison between output and input elements. In other words, it reflects ability of using resources (e.g. labor, machine, equipment, technology and capital) to achieve the ultimate goal to maximize profit. According to Ndungu (2014), operational efficiency refers to the degree of achievement whether or not an organization is able to deliver a given set of limited resources.
For a bank, efficiency can be measured by profitability, market share, customer satisfaction or return on equity to shareholders. ROA and ROE are used to measure performance of bank in financial aspect. “ROA shows the ability of management to acquire deposits at a reasonable cost and invest them in a profitable investment” (Badreldin, 2009). “ROE is seen as a simple method to calculate and measure past performance while giving a fairly good indicator of future ROE” (Wilcox, 1984). In other studies, the assessment of
7
bank operational efficiency is also based on other elements such as deposit and credit schedule (Ibrahim, 2011), total assets, operation cost, operation expenses, net sales (Chen & Chen, 2009).
2.2 The Risk-Management Efficiency
Risk-management is an indispensable activity for a commercial bank. According to many financial experts, commercial bank is one of sectors that have the highest risk. The kinds of risk have close relationship and interaction with each other. They can cause major losses to a banking system. In this context, there is no bank can exist and have long-term growth without building an effective risk-management system.
According to Hassan & Faris (2007), all banks are now facing many types of risk “including credit risk, foreign exchange risk, interest rate risk, liquidity risk, market risk”. They have significant influence on banking systems. In addition, efficient risk-management is a matter needed to be absolutely considered. Pyle (1997) examined “risk-management is the process with which managers satisfy needs by identifying key risks, obtaining consistent, understandable, operational risk measures, choosing which risks to reduce and which ones to increase and by what means, and establishing procedures to monitor the resulting risk position”.
All banks in the world are now in accordance with the guidelines of the international standards of Basel Committee on Banking Supervision*, especially the principles of Basel II to improve quality and stability of the international banking system. Following the contents of Basel II, risks in credit, market, liquidity, capital adequacy and operational are the major factors that may affect the bank’s operation. The details of these factors are as follows:
Firstly, credit risk is potential that a borrower is a failure in business and unable or not willing to repay their debt to the bank along with the terms or other commitments in the
8 contract (Alam & Masukujjaman, 2011).
Secondly, market risk is a possibility that the banks may loss because of fluctuations of some variables in the market (Kanchu & Kumar, 2013) such as the changes in interest rates, exchange rates or commodity prices.
Thirdly, liquidity risk in the view of Sidthidet (2011) can be shown at the balance sheet in the bank’s report. Liquidity risk occurs when customers/depositors do not want to extend the term of their deposits and in other situations when they suddenly withdraw that the banks may be unforeseen.
Fourthly, capital adequacy risk occurs when the banks may not have enough capital reserves for business operation or unforeseen risks related to credit risks, market risks and operational risks (Bangkok Bank annual report, 2008).
Lastly, operational risk as a result from the loss of business through operational processes, it may be caused by the failures to meet policies, regulations and laws requirement (Njogo, 2012). In other words, it is the risk of mistakes in internal processes, banking systems, human factor.
In general, risk-management plays an important role in banking system. Therefore, affective risk-management is a good identification of risks as well as the potential of risks may have influence on banking system to handle them effectively.
(*) Note: “The Basel Committee on Banking Supervision provides a forum for regular
cooperation on banking supervisory matters. Its objective is to enhance understanding of key supervisory issues and improve the quality of banking supervision worldwide” (Bank
9
2.3 An Overview of Commercial Banks in Vietnam and
Taiwan
2.3.1 Vietnam commercial banks
By the end of 2012, the number of banks in Vietnam shown that the banking system in Vietnam includes 6 state owned commercial banks (SOCBs), 38 joint stock commercial banks (JSCBs), 32 foreign and branches of foreign banks (FBs & FBBs), and 5 joint venture banks (JVs). These are identified by The State Bank of Vietnam.
Figure 2 1: Vietnam- Credit growth and GDP growth trend line (Source: Vietnam Banking Survey 2013 by KPMG)
This figure shows that there is close correlation between credit growth and GDP growth. According to Vietnam Commercial Banking Report (2012), along with economic development, Vietnam banking system is having rapid growth with untapped potential and a high savings rate there. It may make advantage for banks to mobilize capital from public. However, besides these strengths, domestic banks have to face some disadvantages to 5.00% 5.50% 6.00% 6.50% 7.00% 7.50% 8.00% 8.50% 9.00% 2001 2003 2005 2007 2009 2011 0.00% 10.00% 20.00% 30.00% 40.00% 50.00% 60.00% 2001 2002 2003 2004 2005 2006 2007 2008 2009 2010 2011 2012 Credit Growth GDP Growth
10
reduce risks from credit activities while credit growth increasingly because of the lack of capital and technology. Currently, there are many financial accounts of commercial banks that are still opaque. Therefore, Vietnam Banking system has to face many threats, especially under the pressure of macroeconomic instability.
The State Bank of Vietnam indicated the framework of banking operations in 2012. It shows that monetary indicators have reasonable growth, in accordance with the goal of controlling inflation at a low level (6.81%), macroeconomic stability. Although banking system has a low credit growth but structure of credit shifted to positive direction, suitable to government policy. Hence, liquidity of credit institutions was improved and after increasing sharply in the early months of years, non-performing loans have been controlled and solved step by step. After one year of restructuring credit institutions, systematic risk is gradually controlled. However, The State Bank of Vietnam also acknowledged that operating monetary policy and banking operations in 2012 still have some limits, such as credit growth, which is lower than the target, bad debt increase, difficulties in liquidity of several commercial banks and some financial institutions have not strictly executed the rules of the Central Bank.
In general, the overview of Vietnam commercial banks can summary through the SWOT analysis:
11
Figure 2 2: The SWOT analysis of Vietnam commercial banks
(Source: Vietnam Commercial Banking Report, 2012)
2.3.2 Taiwan commercial banks
As mentioned in previous chapter, the author pointed out the overview of Taiwan’s economy. The economy in Taiwan also affects local banking system. Taiwan commercial banking report (2012) indicated that most of commercial banks in Taiwan have low rate of total loans to total deposits. Besides, the granting of credit to customer was made more stringent, notwithstanding that commercial banks faced non-performing loans problem in the past. This report also notes that banking industry of Taiwan is over-fragmented and although banking system is in the process of consolidation but it is quite slow. From that point, there are many opportunities for Taiwanese banks to improve quality of credit and consumer relationship effectively. Information retrieved from online newspaper (Chinapost.com.tw), citing Moody’s Investors Service comments on Taiwan banking sector outlook. Which indicates that there is a closely relationship between Taiwan banking system and Taiwan’s economic. Banking system will remain stable along with improvement of the economy in the coming years.
12
For the overview of Taiwan commercial banks, it is also shown through SWOT analysis:
Figure 2 3: The SWOT analysis of Taiwan commercial banks
(Source: Taiwan Commercial Banking Report, 2012)
2.4 Data Envelopment Analysis
DEA is an application of linear programming. There were many studies using this model to evaluate or measure the relative efficiency of decision making units (DMUs) in common research objectives. After it was introduced by Charnes, Cooper, and Rhodes (1978), DEA model has been used to estimate comparative efficiencies in various factors such as bank branches, school, hospital, courts, and so on (Thanassoulis, 1999). This study focuses on banking system, therefore based on multiple inputs and outputs selected by DEA approach helps “to compare relative efficiency of banks that determines the efficient banks as benchmarks and measures the inefficiencies in input combinations in other banks relative to the benchmark” (Jemric & Vujcic, 2002).
13
called DMUj (j=1, 2,…,n) with m inputs are used to consumed, called xij (i= 1, 2,…,m), and
s outputs are produced, called yrj (j= 1, 2,…,s). The relative efficiency of DMUj will be shown by the ratio between the weight of inputs and outputs. There are two basic DEA approaches: CCR model was introduced by Charnes, Cooper, Rhodes (1978) which assumes constant returns to scale (CRS), and BCC model was introduced by Banker, Charnes, Cooper (1984) which assumes variable returns to scale (VRS) (Guedes et al., 2012).
2.4.1 DEA–CCR model
DEA approach with CCR model estimates Technical Efficiency (TE) scores of each DMU. Based on previous study of Farrell (1957), according to Charnes et al, (1978), efficiency measurement of “any DMU is obtained as the maximum of a ratio of weighted outputs to weighted inputs” and provided that “the similar ratios for every DMU be less than or equal to unity”. Following the formula of DEA-CCR Input – oriented model:
0 , ..., 2, 1, , 1 1 1 1 1 r u i v n j m i ij x i v s r rj y r u s.t. m i ik x i v s r rk y r u k h Max. (2.1) Where:
hk:is the relative efficiency of kth DMU, k = 1, 2, …, n.
yrj:the rth output item of jth DMU.
14
rk:the weight for the rth output item of kth DMU.
ik: the weight for the the ith input item of kth DMU.
:Non-Archimedean small number, researchers suggest =10-4 or 10-6.
Following the Charnes and Cooper transformation (1962), the above equation can be transform into linear fractional programming problem:
n k ik v rk u n j m i ij x ik v s r rj y rk u m i ik x ik v s.t. s r rk y rk u k Max. ,..., 2 , 1 , 0 , ,..., 2 , 1 , 0 1 1 1 1 1
(2.2)
For above linear programming problem, the dual problem is:
free 0 , , 0 -1 1 1 1
i r j i n j j ij ik rk r n j j rj s r r m i i k S S S x x y S y s.t. S S h Min.(2.3) Where:
Si-:the slack variable of the ith input item.
Sr+:the slack variable of the rth output item.
j:the weight of the jth DMU.
15
return of scale, generally called the Technical Efficiency (TE). Under this model, a DMU is said to be effective in technical if TE equals to 1 and vice versa.
2.4.2 DEA–BCC model
After CCR model, Banker, Charners & Cooper (1984) proposed BCC model to evaluate the efficiency of DMU under variable return of scale to evaluate the efficiency of DMUs by assess Pure Technical (PTE) and Scale Efficiency (SE) of each DMU. The mathematical program of BCC Input – oriented model:
free 0 , ,..., 2 , 1 , 1 0 1 1 0 1 1 0
i r m i ik i s r rk r m i ik i s r rk r k v n j v u y s.t. v u y h Max.(2.4)
Above equation can be transformed in linear programming problem:
free 0 , ,..., 2 , 1 , 0 1 0 1 0 1 1 1 0
i r s r m i ik i rk r m i ik i s r rk r k v n j u v y v s.t. u y h Max.(2.5)
The different between BCC model and CCR model is that BCC model adds one more variable u0, where u0 is used as an index to recognize the return of scale. u0 =0 represents constant return of scale; u0 >0 represents decreasing return of scale; and u0 <0 represents increasing return of scale
16 The dual of linear programming of this model is:
free 0 , , 1 ..., 2, 1, , 0 -1 1 1 1 1
i r j n j j i n j j ij ik rk r s r j ij s r r m i i k S S n j S x x y S y s.t. S S h Min. (2.6)Under BCC model with assumption that variable returns to scale, total TE include Pure Technical Efficiency (PTE) and Scale Efficiency (SE) (Gokgoz, 2009). Therefore, the formula to calculate SE as follows:
PTE TE
SE
(2.7)
In general, Technical Efficiency score (TE) can be obtained by using CCR model with constant returns to scale (CRS) to gain total TE and besides, using BCC model with variable returns to scale (VRS) to gain PTE. The differences between the score of TE and PTE explain the score of SE. If SE equals to 1, DMU will be called scale efficient and in process under increasing returns to scale and vice versa if SE less than 1 (Aldeseit, 2013; Gokgoz, 2009). Based on the measurement of SE, it helps managers to choose the size of scale, for instance the banks’ scale or scale of production (Kumar & Gulati, 2008).
2.4.3 Slack analysis
DEA model provided some methods or tools to analyze efficiency as well as resources utilization such as input excesses or output shortfall. Under DEA model, slack analysis helps managers to define the relatively inefficient DMUs and then to investigate the input
17
and output utilization and hence to improve efficient scores (Lie & Lih, 2005; Luo & Donthu, 2001). In other words, when TE does not equal to 1, DMU has a low efficient score, slack variables that aims to optimize input and output resources can be used to improve TE score equals to 1. For any inefficient DMUk, assume its input and output are
(x
k, y
k)
, to improve its efficiency, the amount of input should reduce△x
ik
x
S
i
m
x
x
ik
ik
* ik
i*,
1,
2,
...,
(2.8)
And the amount of output should increase
△
yrk
y
S
y
r
s
y
rk
rk
r*
rk,
1,
2,
...,
(2.9)
Where: xik is ithinput of the kth DMU
yrk is rth output of the kth DMU
Si- is the input excess of ith input
Sr+ is the output shortfall of rth output.
Under slack analysis, maximum and minimum value of each DMU will be compared with efficient DMUs that have efficient scores (equal to 1). Hence, for each inefficient DMUs, slack analysis will show which inputs and/or outputs should be added or removed to enhance operating efficiencies (Lie & Lih, 2005).
2.4.4 Sensitivity analysis
Besides the slack analysis method, DEA model also performs sensitivity analysis on utilization of input and/or output resources. It aims to examine if changing some input/output items, how they differ from original efficiencies. In other words, based on the removal of some variables, sensitivity analysis helps to define changes of efficiency in DEA model.
18
be classified into five groups as shown in the following table:
Table 2.1: Efficient level of sensitivity analysis
Group Name Description
1 Robustly efficient The efficient score equals to one or no significant reduction 2 Marginally efficient The efficient score equals to 1 for the base model and in several
cases it still remains at 1, but in other cases it reduce significantly.
3 Marginally inefficient The efficient score is less than 1 but greater than 0.9 for base model and stable during the sensitivity analysis.
4 Significantly inefficient The efficient score is less than 1 but greater than 0.9 for base model and unstable during the sensitivity analysis
5 Distinctly inefficient The efficient score is significant low in most of conditions (less than 0.9)
2.4.5 Sorting
DEA method tries to define the best weights for each DMU and the relative efficiencies of DMUs to evaluate the relative efficiencies and maximum performances. By the DEA’s result, it may get many efficient DMUs. There were a lot of studies tried to classify efficient DMUs by sorting the DMUs. For instance, Thompson el al. (1986) proposed Assurance region, Sexton et al. (1986) proposed Cross efficiency and Roll et al. (1991) proposed Common compromise weights, Andersen & Petersen (1993) proposed A&P model.
19
2.4.5.1 Assurance region
Charnes et al. (1990) indicate that it may have some deficiencies when setting up an empirical production function. For instance, it cannot point out what the realistic results are to assess efficiency of each DMU or cannot accurately evaluate the input and/or output resources utilization. To solve these situations, Thompson et al. (1986) used Assurance region (AR) to sort the DMUs. It allows setting additional weights restrictions for the specific utilization (Lin & Okudan, 2010). This model provides the upper and lower bounds as above based on the acceptable values of variable as follows:
,s
,
, r
U
u
u
L
,m
,
, i
U
v
v
L
Or i Or Ii i Ii
2
2
1 1
(2.10)Where: L is the lower bond
U is the upper bond
2.4.5.2 Common compromise weights
Under Common compromise weights method of DEA framework, the DMUs will be classified into two groups: efficient and inefficient DMUs. According to Kao & Hung (2005), the DMUs have an efficient target that is the efficient score was retrieved from the DEA model. The DMUs collect the common compromise weights to shorten the distance between the vector of efficient score and target score. On the other hand, using CCW model is to compute the set of weights for each DMU. Therefore, the DMUs will be compared together on one scale. Roll et al. (1991) first proposes common compromise weights (CCW). There are also some research propose another common weights model in different ways (Roll & Golany (1993), Bao (2007), Chen (2009). The formula to compute the set of CCW as follows:
20 n v v n j ij * i
1(2.11) n u u n j rj * r
1(2.12)
Where: vi* is the set of weights for all inputs
ur* is the set of weights for all outputs
After the set of weights is obtained, the efficiency value for all DMUs can be computed as:
ik i rk r k x v y u * * (2.13) And: j n j k k , 1 ,2 ,..., } max{ *
(2.14)
2.4.5.3 Cross efficiency
Cross efficiency (CE) is a model that uses the set of weights for other DMUs to assess its efficiency, and then take the average value as its efficiency. In other words, the purpose of this model is to apply DEA framework in a similar evaluation instead of the mode of a self – assessment. The formula of this model as follows (Sexton et al., 1986):
n k j j kj k E n e , 1 ) 1 /( (2.15)Where: Ekj shows the relative efficiency of DMUk with optimal weights for every variable of DMU0; ek is the average of all Ekj.
2.4.5.4 A&P model
21
Petersen (1993) using to sort the efficient DMUs. The formula of A&P model as follows:
free 0 2, 1 2 1 0 j k J-, j λ s , , r , y y λ m , , , i , x x s.t. θ Min. θ j rk rj j k J j ij k J j ik
(2.16)In general, there are many ways to sort the efficient DMUs. However, this research was supported using the Assurance region and Common compromise weights method to sort the efficient DMUs. Because the results of these two models are similar to the remaining model and they are also not complicated to compute.
22
Chapter 3 RESEARCH METHODOLOGY
As mentioned in the previous chapter, the author would like to propose Data Envelopment Analysis (DEA) to evaluate banking performance and risk management of commercial banks in Vietnam and Taiwan. In this chapter, the author will give out the research framework for this study, where in next part is the selection of input and output items and data collection used to run DEA program.3.1 Research Framework
This study uses two-stage DEA model to evaluate a whole of banks performance: the first stage assesses operational efficiency and the second stage assesses risk-management efficiency. This process is carried out continously. Therefore, outputs in the first stage would be inputs in the second stage, that called intermediate variables. They are shown in the figure 3.1 and the explanation for each variable will be shown in the next section.
23
3.2 Selection of Input and Output Items
In the past, there were a lot of studies that using DEA model research on evaluating efficiency of bank’s performance. To apply this model, it is necessary to identify input and output items related to the research subject and that is the way to find down which banks are efficiency or inefficiency. In this part, firstly, the author will point out some selected inputs and outputs in other studies.
Table 3.1: Selection of input and output items in previous researches.
Year Author(s) Method Input Inter. Output
1997 Brockett, P. L.,
et al. DEA
.Interest expense .Non-Interest expense .Provision for loan losses .Total deposits .Interest income .Non-interest income .Allowances for loans losses .Total loans 1998 Chen, T. Y., Yeh, T.L. DEA .Bank assets .Staff employed .Interest expense .Loan .Investment .Interest revenue .Non-interest revenue 1999 Seiford, L. M. Zhu, J. DEA (2 stages) .Employees .Assets .Stockholders’ Equity .Revenue .Profits .Market Value .Total Return to investors
.Earnings Per Share
2004 Chen, Y. Zhu, J. DEA (2 stages) .Fixed assets .No. of employees .IT investment Deposits .Profit .Percentage of loans recovered.
2007 Mostafa, M. DEA .Total assets
.Shareholders’ Equity .Net profit .Return on assets .Return on equity 2007 Pasiouras, F., et al. DEA .Fixed assets .Total deposits .No. of employees .Total loans .Liquid assets & investment
24
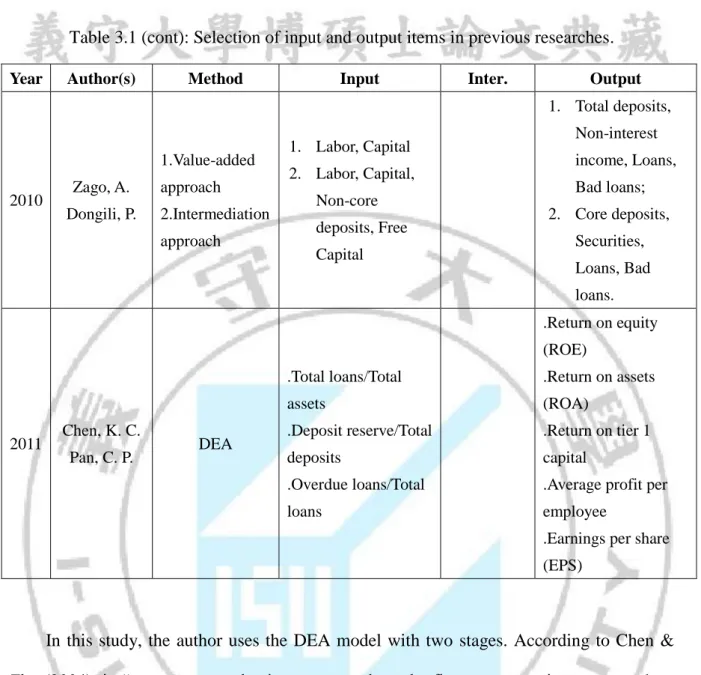
Table 3.1 (cont): Selection of input and output items in previous researches.
Year Author(s) Method Input Inter. Output
2010 Zago, A. Dongili, P. 1.Value-added approach 2.Intermediation approach 1. Labor, Capital 2. Labor, Capital, Non-core deposits, Free Capital 1. Total deposits, Non-interest income, Loans, Bad loans; 2. Core deposits, Securities, Loans, Bad loans. 2011 Chen, K. C. Pan, C. P. DEA .Total loans/Total assets .Deposit reserve/Total deposits .Overdue loans/Total loans .Return on equity (ROE) .Return on assets (ROA) .Return on tier 1 capital
.Average profit per employee
.Earnings per share (EPS)
In this study, the author uses the DEA model with two stages. According to Chen & Zhu (2004), in “two stages production process where the first stage uses inputs to produce outputs, and then these outputs are used as inputs in the second stage to produce outputs” and certainly these are the other outputs. From the secondary data as well as the previous studies on banking system, this study uses 4 inputs and 4 outputs in the first stage and 3 outputs in the second stage. The key words explanation is based on research of Thai & Nguyen (2009).
Stage 1:
Input factors include:
- Total assets: Bank assets show the employment of bank capital (bank budget) and it also express the operation of bank. The amount of money that banks spend to have
25
the cash on hand, loans, investment, fixed assets, working tools, materials, etc. These assets directly make the income to banks and play an important role to revenue earning activity of bank.
- Fixed assets: Including the value of bank assets such as offices, equipment, infrastructure and necessary outfits for the business operation of bank.
- Shareholder’s equity: The bank’s own capital is contributed by the shareholders and supplemented in the business process, including bank’s capital, reserves, foreign exchange differences, asset revaluation differences and retained profits.
- Interest expenses: The expenses that the bank has to pay for deposits, borrowings, valuable papers issued and others expenses on credit activities.
Intermediate factors include:
- Total deposits: The amount of money that the bank was got from the customers, including demand deposits, term deposits, deposits for specific purposes and margin deposits.
- Total loans (Credit): Credit activities are primarily profit-making activities of the commercial banks. These are amount of money that the customers were got through the disbursements from the bank in fiscal year.
- Interest income: They are interest income from loans and advances to customers, balances with loans to other credit institutions, trading and investment debt securities, investment securities, financial lease and others income from credit activities.
- Profit before tax: It is differential between total operating income and total operating expenses. This indicator uses to evaluate the profitability of the bank, help the investors can compare with the other banks together.
Stage 2:
26
- Earnings Per Share (EPS): The profit earned on each share.
- Revenue per employee: This indicator is calculated by dividing business’ revenue by total number of employee. It is most useful in this study when comparing commercial banks together.
- Total loans/bad debt: It shows that how much money of loans could make one non-performing loan (bad debt). The bigger this indicator get, the more effective the bank credit activity is.
For the indicator of bad debt, it is calculated by total non-performing loans divided by total loans and it was used in previous study lots. However, when using DEA model and put it as an output factor, it causes many difficulties in assessing bank’s performance. Consequently, in this study, the author will reserve this indicator into “Total loans/bad debt”. It will be used as another way to analyze the bad debt status as well as the operational efficiency and risk management of the bank. In fact, credit risk has great influence on the risk-management activities of the banks. In business, credit is the main activity and yields the most profits for the banks. Therefore, bad debt ratio indicator uses for evaluating the bank’s risk ability.
3.3 Data Collection
This research tries to investigate bank’s performance and also evaluate the risk management efficiency of commercial banks in Vietnam and Taiwan. Consequently, the DMUs are 22 out of 44 Vietnamese domestic banks and 22 out of 37 Taiwanese domestic banks and except for foreign and joint venture banks for year 2012 because some banks do not have available annual report, therefore the author cannot collect these banks data. The banks data will be collected from Annual Report of these banks retrieved from banks website and other resource.
27
Table 3.2: List of commercial banks in Vietnam and Taiwan
No Name Abbreviation Type
1 Vietcombank VN_VCB State-owned
2 Vietinbank VN_CTG State-owned
3 Bank for Investment and Development of Vietnam VN_BIDV State-owned
4 Agribank VN_VBARD State-owned
5 Maritime Bank VN_MSB Joint-stock
6 Sacombank VN_STB Joint-stock
7 DongA Bank VN_EAB Joint-stock
8 Eximbank VN_EIB Joint-stock
9 Asia Commercial Bank VN_ACB Joint-stock
10 Vietnam Bank for Private Enterprise VN_VPB Joint-stock
11 Techcombank VN_TCB Joint-stock
12 Military Bank VN_MB Joint-stock
13 Vietnam International Bank VN_VIB Joint-stock
14 Southeast Asia Bank VN_SEAB Joint-stock
15 Housing Development Bank VN_HDB Joint-stock
16 Southern Bank VN_PNB Joint-stock
17 Saigon Commercial Bank VN_SCB Joint-stock
18 Saigon Hanoi Bank VN_SHB Joint-stock
19 Ocean Commercial Bank VN_OJB Joint-stock
20 LienViet Post Bank VN_LPB Joint-stock
21 An Binh Bank VN_ABB Joint-stock
22 Mekong Housing Bank VN_MHB Joint-stock
23 Bank of Taiwan TW_BOT State-owned
24 Land Bank of Taiwan TW_LBOT State-owned
25 Taiwan Cooperative Bank TW_TCB State-owned
26 First Bank TW_FCB State-owned
27 Chang Hwa Bank TW_CHB State-owned
28 Hua Nan Bank TW_HNB State-owned
29 Taiwan Business Bank TW_TBB State-owned
30 Mega Bank TW_MCB State-owned
28
Table 3.2: List of commercial banks in Vietnam and Taiwan (continue)
No Name Abbreviation Type
32 Chinatrust Bank TW_CCB Joint-stock
33 Taishin International Bank TW_TIB Joint-stock
34 Bank SinoPac TW_SPB Joint-stock
35 En Tie Commercial Bank TW_ETB Joint-stock
36 Jihsun Bank TW_JSB Joint-stock
37 Taichung Bank TW_TCCB Joint-stock
38 Union Bank of Taiwan TW_UBOT Joint-stock
39 Far Eastern International Bank TW_FEIB Joint-stock
40 Bank of Kaohsiung TW_BOK Joint-stock
41 Ta Chong Bank TW_BTC Joint-stock
42 Yuanta Bank TW_YTB Joint-stock
43 Cota Bank TW_CTB Joint-stock
44 Bank of Panhsin TW_BOP Joint-stock
Sources: The State Bank of Vietnam
Central Bank of the Republic of China (Taiwan)
(*) Note: VN-bank’s name: Bank in Vietnam TW-bank’s name: Bank in Taiwan
29
Chapter 4 RESULT AND DISCUSSION
In this chapter, the results of DEA model will be shown and explained. Applying two-stage of this method, firstly, author will show the result of each stage including descriptive analysis, correlation between input and output variables, the results of CCR and BCC model through TE, PTE, SE scores, slack analysis and sensitivity analysis. After that, this study also uses sorting to classify efficient DMUs because those results may indicate too many efficient DMUs that can realize which DMU is the best one. Finally, there is a comparison between the results of two stages.
4.1 The First Stage Efficiency Analysis
4.1.1 Descriptive statistics analysis
In the first stage, the data of 44 commercial banks in 2012 (see Appendix A.1) will be carried out by running CCR-input oriented model. The results will be presented step by step. The following table is a brief summary of the basic data retrieved from the banks.
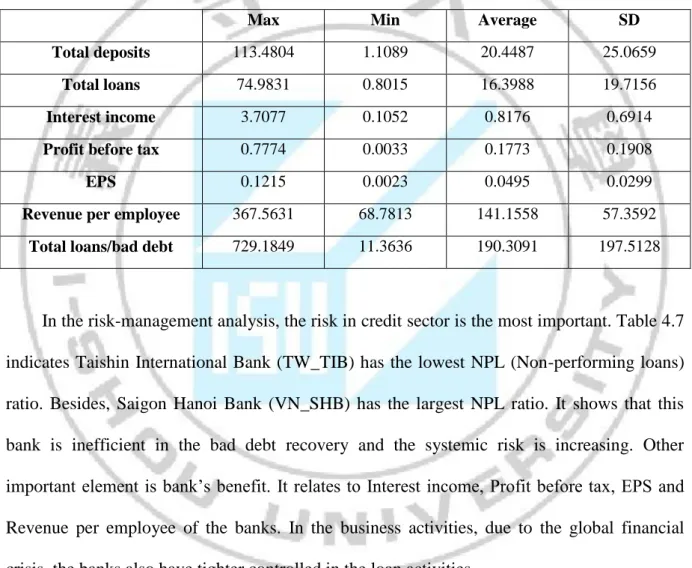
Table 4.1: The first stage analysis - Descriptive statistics on Inputs and Outputs data
Max Min Average SD
Total assets 139.647 1.824 26.366 31.099 Fixed assets 3.350 0.011 0.362 0.573 Shareholder's equity 8.704 0.165 1.673 1.905 Interest expenses 2.424 0.037 0.459 0.431 Total deposits 113.480 1.109 20.449 25.066 Total loans 74.983 0.802 16.399 19.716 Interest income 3.708 0.105 0.818 0.691
30
Table 4.1 indicates the maximum, minimum, average and standard deviation corresponding to each input and output variables. Besides, each value corresponds to different DMUs. For example, Bank of Taiwan (TW_BOT) gets the largest value in total assets ($139.647 billion US) but the largest value in profit belongs to Mega International Commercial Bank (TW_MCB) at $0.7774 billion US.
4.1.2 Correlation
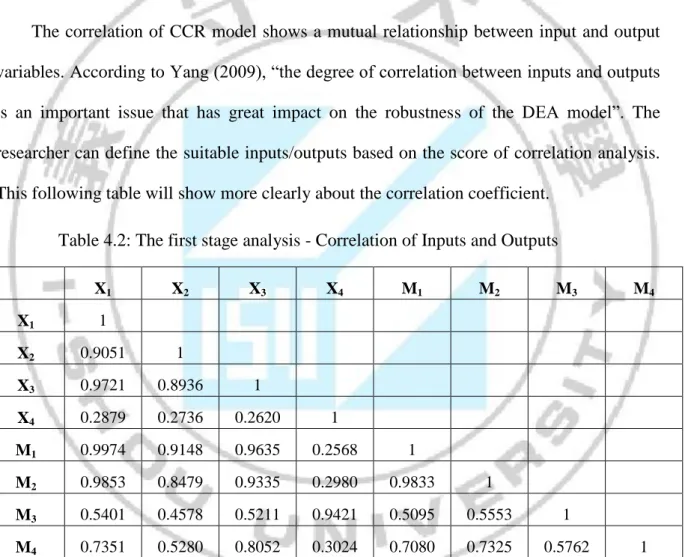
The correlation of CCR model shows a mutual relationship between input and output variables. According to Yang (2009), “the degree of correlation between inputs and outputs is an important issue that has great impact on the robustness of the DEA model”. The researcher can define the suitable inputs/outputs based on the score of correlation analysis. This following table will show more clearly about the correlation coefficient.
Table 4.2: The first stage analysis - Correlation of Inputs and Outputs
X1 X2 X3 X4 M1 M2 M3 M4 X1 1 X2 0.9051 1 X3 0.9721 0.8936 1 X4 0.2879 0.2736 0.2620 1 M1 0.9974 0.9148 0.9635 0.2568 1 M2 0.9853 0.8479 0.9335 0.2980 0.9833 1 M3 0.5401 0.4578 0.5211 0.9421 0.5095 0.5553 1 M4 0.7351 0.5280 0.8052 0.3024 0.7080 0.7325 0.5762 1
Notes: X is input variable; M is immediate variable (output) in stage 1. X1: Total assets. X2: Fixed assets. X3: Shareholder’s equity. X4: Interest expenses. M1: Total deposits. M2: Total loans. M3: Interest income. M4: Profit before tax.
This table points out many different scores, for very high correlation between input and output variable, this input/output can be seen as a proxy of the other input/output and vice versa. On the other hand, for very low correlation, this input/output is not suitable with the
31
model. Here, the correlation between two inputs Shareholder’s equity and Total assets is quite high (0.9721) and two outputs Total loans and Total deposit is 0.9833. In common case, it is necessary to remove highly correlated variables from data set. Unfortunately, these variables are very important in evaluating efficiency of banking system. Therefore, the author would like to keep them in the data set.
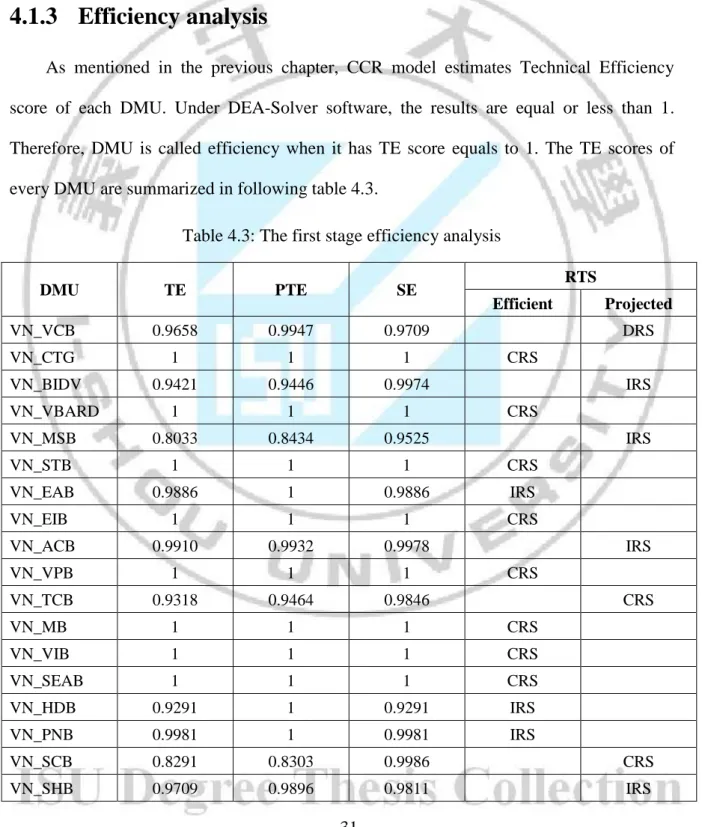
4.1.3 Efficiency analysis
As mentioned in the previous chapter, CCR model estimates Technical Efficiency score of each DMU. Under DEA-Solver software, the results are equal or less than 1. Therefore, DMU is called efficiency when it has TE score equals to 1. The TE scores of every DMU are summarized in following table 4.3.
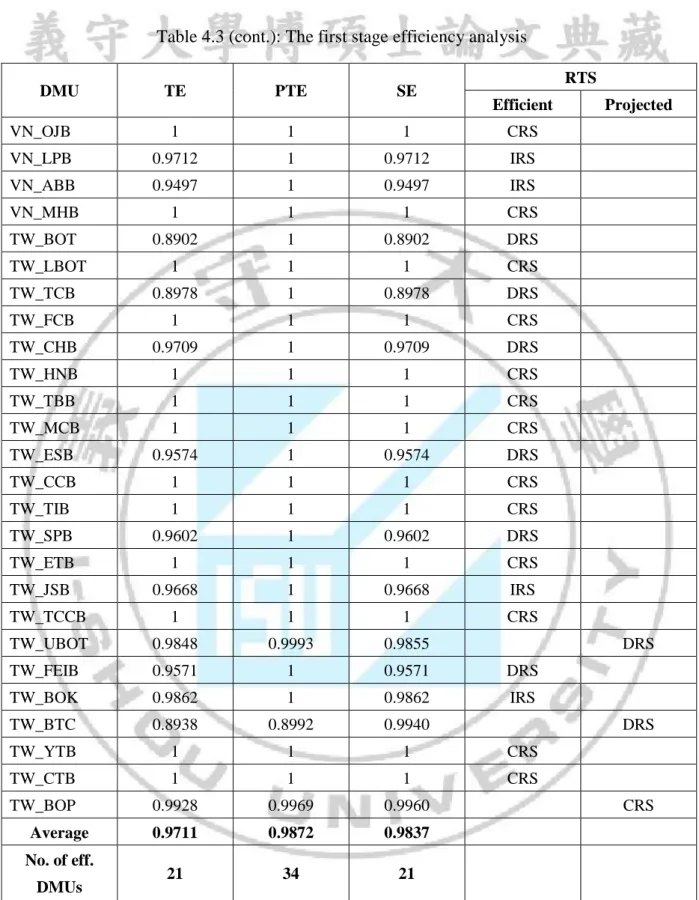
Table 4.3: The first stage efficiency analysis
DMU TE PTE SE RTS Efficient Projected VN_VCB 0.9658 0.9947 0.9709 DRS VN_CTG 1 1 1 CRS VN_BIDV 0.9421 0.9446 0.9974 IRS VN_VBARD 1 1 1 CRS VN_MSB 0.8033 0.8434 0.9525 IRS VN_STB 1 1 1 CRS VN_EAB 0.9886 1 0.9886 IRS VN_EIB 1 1 1 CRS VN_ACB 0.9910 0.9932 0.9978 IRS VN_VPB 1 1 1 CRS VN_TCB 0.9318 0.9464 0.9846 CRS VN_MB 1 1 1 CRS VN_VIB 1 1 1 CRS VN_SEAB 1 1 1 CRS VN_HDB 0.9291 1 0.9291 IRS VN_PNB 0.9981 1 0.9981 IRS VN_SCB 0.8291 0.8303 0.9986 CRS VN_SHB 0.9709 0.9896 0.9811 IRS
32
Table 4.3 (cont.): The first stage efficiency analysis
DMU TE PTE SE RTS Efficient Projected VN_OJB 1 1 1 CRS VN_LPB 0.9712 1 0.9712 IRS VN_ABB 0.9497 1 0.9497 IRS VN_MHB 1 1 1 CRS TW_BOT 0.8902 1 0.8902 DRS TW_LBOT 1 1 1 CRS TW_TCB 0.8978 1 0.8978 DRS TW_FCB 1 1 1 CRS TW_CHB 0.9709 1 0.9709 DRS TW_HNB 1 1 1 CRS TW_TBB 1 1 1 CRS TW_MCB 1 1 1 CRS TW_ESB 0.9574 1 0.9574 DRS TW_CCB 1 1 1 CRS TW_TIB 1 1 1 CRS TW_SPB 0.9602 1 0.9602 DRS TW_ETB 1 1 1 CRS TW_JSB 0.9668 1 0.9668 IRS TW_TCCB 1 1 1 CRS TW_UBOT 0.9848 0.9993 0.9855 DRS TW_FEIB 0.9571 1 0.9571 DRS TW_BOK 0.9862 1 0.9862 IRS TW_BTC 0.8938 0.8992 0.9940 DRS TW_YTB 1 1 1 CRS TW_CTB 1 1 1 CRS TW_BOP 0.9928 0.9969 0.9960 CRS Average 0.9711 0.9872 0.9837 No. of eff. DMUs 21 34 21
From this table, the data analyzes in the fiscal year 2012 shows that the average of TE scores is 0.9711 and the number of efficient DMUs is 21 make up more than 47% and inefficient DMUs is 23 make up about 53% in total 44 commercial banks. Moreover, 21 efficient banks represent use of input and output elements effectively. Besides, among
33
efficient banks, there are 10 Vietnamese banks and 11 Taiwanese banks. For inefficient banks, there are 12 Vietnamese banks and 11 Taiwanese banks have less performance than the others. The main reasons for this situation are firstly depend on too much use of Shareholder’s equity for business such as Vietcombank (VN_VCB), Asia Commercial Bank (VN_ACB), Housing Development Bank (VN_HDB), Saigon Commercial Bank (VN_SCB), Lien Viet Post Bank (VN_LPB), An Binh Bank (VN_ABB), Ta Chong Bank (TW_BTC). In other situation, some commercial banks invest too much in fixed assets such as DongA Bank (VN_EAB), Southern Bank (VN_PNB), Saigon Hanoi Bank (VN_SHB), Bank of Taiwan (TW_BOT), Taiwan Cooperative Bank (TW_TCB), Chang Hwa Bank (TW_CHB), E.Sun Bank (TW_ESB), Jihsun Bank (TW_JSB), Union Bank of Taiwan (TW_UBOT), Bank of Panhsin (TW_BOP). Therefore, the banks have to wait for a long time to recover capital and make benefit.
Hence, the banks of two countries can be compared by divided into two groups. By calculating, the average overall TE score of Vietnamese banks is 0.9669 and the average overall TE score of Taiwanese banks is 0.9754. This indicates that Taiwanese banks are more efficient than Vietnamese bank in resource utilization.
For the BCC model analysis, after running CCR input – oriented model (constant retail to scale) to get the Technical Efficiency scores for the banks, for the assume that variable to scale, BCC input-oriented model evaluates efficiency through Pure Technical Efficiency (PTE) and Scale Efficiency (SE) scores. They are shown in table 4.3 in previous section. At the same time, this table also pointed out the current status by returns to scale (RTS) and prediction for every bank. In the evaluating return to scale, for any DMU, if there is the same proportional change of the output variables in a positive direction (increase) when the output variables increase, this situation is constant returns to scale (CRS). On the other hand, if the output variables increase but with the proportional change less than the increase of the
34
input variables, that is decreasing returns to scale (DRS). Contrary to above situation, if the output variables increase with the proportional change more than the increase of the input variables, this is increasing returns to scale (IRS). Consequently, that table indicates that among 44 commercial banks, there are 24 banks are operating at most productive scale and under CRS. Further, there are 11 banks are operating at best scale under IRS. For the 9 remaining banks are DRS, they are operating at ineffective scale.
The table 4.3 also shows pure technical efficiency scores, and indicates that 34 banks are efficient because the PTE score of those banks equal to 1. Besides, there are 21 in out of 34 banks got efficient score under CRS model (constant returns to scale), and 13 remaining banks got efficient score under VRS model (variable returns to scale). For 10 inefficient banks, there are 6 banks have the PTE score less than SE score. That case points out the inefficiency caused by the use of resource is inefficient. On the other hand, it can summary that SE score is very important in evaluating overall efficiency. For instance, some banks have the PTE score equal to 1 but the TE score is low because of the score of SE less than 1. The average PTE score of 44 DMUs is 0.9872. For the inefficient DMUs, they may effected by their own manager ability such as mismanagement, missing in selecting input variables and the other reason may be the banks operate with inappropriate scale. In the Appendix B.1, the author will present the results of DEA over period 2008-12 to see more clearly about the banks efficiency through the years.
4.1.4 Slack analysis
The slack analysis only uses for the DMU that identified as inefficient based on DEA model. Consequently, these slacks will provide the important information for them and indicate that how they need to improve the efficient scores or gain the status of the efficient DMUs. The table below provides the input and output slacks of 23 inefficient banks in 2012
35
Table 4.4: The first stage analysis - The slack analysis of the banks
DMU Score Excess
Excess Excess Excess Shortage Shortage Shortage Shortage X1 X2 X3 X4 M1 M2 M3 M4 S1 - S2 - S3 - S4 - S1 + S2 + S3 + S4 + VN_VCB 0.9658 0 0.027 3 0.670 6 0.028 6 0 0 0 0 VN_CTG 1 0 0 0 0 0 0 0 0 VN_BIDV 0.9421 0 0 0 0 2.287 5 0 0.095 2 0 VN_VBARD 1 0 0 0 0 0 0 0 0 VN_MSB 0.8033 0 0 0.003 4 0.005 6 0 1.421 6 0 0.032 2 VN_STB 1 0 0 0 0 0 0 0 0 VN_EAB 0.9886 0 0.037 0 0.114 6 0 0 0 0.006 5 0 VN_EIB 1 0 0 0 0 0 0 0 0 VN_ACB 0.9910 0 0 0.153 4 0.014 4 0 0.866 1 0 0.029 8 VN_VPB 1 0 0 0 0 0 0 0 0 VN_TCB 0.9318 0.2380 0 0 0 0 1.331 6 0 0.034 0 VN_MB 1 0 0 0 0 0 0 0 0 VN_VIB 1 0 0 0 0 0 0 0 0 VN_SEAB 1 0 0 0 0 0 0 0 0 VN_HDB 0.9291 0 0 0.063 3 0.024 3 0 0.321 4 0 0 VN_PNB 0.9981 0 0.030 8 0.037 9 0.171 8 0 0.715 4 0 0.029 2 VN_SCB 0.8291 0 0.007 1 0.091 0 0 0.314 5 0.204 9 0 0.055 8 VN_SHB 0.9709 0 0.147 5 0.067 7 0.093 1 0 0 0 0 VN_OJB 1 0 0 0 0 0 0 0 0 VN_LPB 0.9712 0 0 0.125 4 0 0.132 9 0.449 7 0 0.002 1 VN_ABB 0.9497 0 0 0.066 3 0 0.073 8 0.286 9 0 0.004 5 VN_MHB 1 0 0 0 0 0 0 0 0 TW_BOT 0.8902 0 1.906 3 1.712 7 0 0 12.51 27 0.860 8 0.150 2 TW_LBOT 1 0 0 0 0 0 0 0 0 TW_TCB 0.8978 0 0.320 2 0.031 6 0 0 0 0.219 0 0.021 3 TW_FCB 1 0 0 0 0 0 0 0 0 TW_CHB 0.9709 0 0.387 1 0.158 3 0 0 0 0.078 6 0.017 9
36
Table 4.4 (cont.): The first stage analysis - The slack analysis of the banks
DMU Score Excess
Excess Excess Excess Shortage Shortage Shortage Shortage X1 X2 X3 X4 M1 M2 M3 M4 S1 - S2 - S3 - S4 - S1 + S2 + S3 + S4 + TW_HNB 1 0 0 0 0 0 0 0 0 TW_TBB 1 0 0 0 0 0 0 0 0 TW_MCB 1 0 0 0 0 0 0 0 0 TW_ESB 0.9574 0 0.306 9 0 0 0 3.689 2 0.006 5 0 TW_CCB 1 0 0 0 0 0 0 0 0 TW_TIB 1 0 0 0 0 0 0 0 0 TW_SPB 0.9602 0.2102 0.000 0 0 0 0 2.369 3 0 0 TW_ETB 1 0 0 0 0 0 0 0 0 TW_JSB 0.9668 0 0.087 8 0.145 2 0 0 0.314 6 0 0.005 8 TW_TCCB 1 0 0 0 0 0 0 0 0 TW_UBOT 0.9848 0 0.065 5 0 0 0 1.716 2 0 0 TW_FEIB 0.9571 0 0 0.018 1 0.031 1 0 2.410 9 0.021 1 0.012 0 TW_BOK 0.9862 0 0 0.019 9 0.006 0 0 0 0.011 2 0.016 1 TW_BTC 0.8938 0 0 0.006 5 0 0 0.312 5 0 0.028 4 TW_YTB 1 0 0 0 0 0 0 0 0 TW_CTB 1 0 0 0 0 0 0 0 0 TW_BOP 0.9928 0 0.152 2 0.012 1 0 0 0.498 5 0.017 3 0.010 1
Notes: X is input variable; M is immediate variable (output) in stage 1. X1: Total assets. X2: Fixed assets. X3: Shareholder’s equity. X4: Interest expenses. M1: Total deposits. M2: Total loans. M3: Interest income. M4: Profit before tax.
Using the results of slack analysis in table 4.4, the amounts to decrease inputs and the amounts to increase output of each DMU can be obtained in the Appendix C.1. The way how to calculate the improvement suggestions for efficient DMUs by using the formula 2.8 and 2.9 (section 2.4.3) will be defined. In the first stage DEA model, there are 23 inefficient banks. This study only randomly selects a single inefficient bank for the example, Bank of Taiwan (TW_BOT).
37
Firstly, for the suggestion to decrease input Total assets: 0.8902 * 139.6474 – 0 ≈ 124.3110
139.6474 - 124.3110 ≈ 15.3364 15.3364/139.6474 * 100% ≈ 10.98%
Secondly, for the suggestion to increase output Total loans: 74.9831 + 12.51 ≈ 87.4958
87.4958 - 74.9831 ≈ 12.51 12.51/74.9831 * 100% ≈ 16.69%
Doing the same way with the other inputs and outputs and then the slack explanation of inputs and output as follows: The overall TE of this bank is 0.8902. For the inputs utilization, that bank should reduce to 10.98% of Total assets ($15.336 Billion US), 67.90% of Fixed assets ($2.274 Billion US), 30.66% of Shareholder’s equity ($2.669 Billion US), 10.98% of Interest expenses ($0.125 Billion US). For the outputs quality, to improve operational efficiency that bank should increase 16.69% of Total loans ($12.513 Billion US), 43.34% of Interest income ($0.861 Billion US), 53.92% of Profit before tax ($0.150 Billion US) and Total deposits value of this bank is efficient. See more at Appendix C.1.
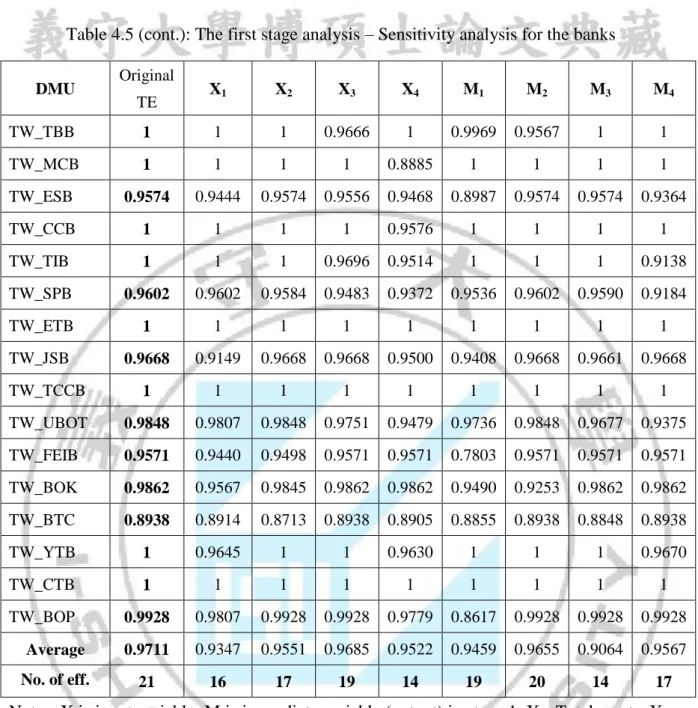
4.1.5 Sensitivity analysis
Currently, there are two ways to evaluate sensitivity analysis: removing efficient DMUs to change the efficient scores of the remaining DMUs. Therefore, the results will show more efficient DMUs than the original efficiency. This study uses another way that removing input/output variables one by one and gets the new efficient scores under DEA model. The table 4.5 is summary of overall technical efficiency after removing each variable: